Kevin Kilty
There is great disagreement and discussion about how heat once planted on the Earth’s surface redistributes itself and makes its way back to space. Not that it makes much difference to settling our debates, but I see value in what observations tell us.
SURFRAD stations are highly instrumented platforms capable of revealing anything one would wish to know about insolation, surface albedo, upward long wave infrared (LWIR) flux, and yes, even the thing that a few people say has never been demonstrated, downward LWIR flux commonly known as the greenhouse effect.
There are only eight such sites in the continental U.S. and I have chosen two of them, representing the end members of summertime climate in the lower 48, for detailed review. In conducting this review I add balloon soundings from nearby stations and calculations from the U of Chicago version of MODTRAN.
The suite of instruments at each SURFRAD installation include paired upward/downward oriented pyrometers and pyrgeometers. These instruments integrate radiant intensity data over a hemisphere of view and over the wavelength range of 4 to 40 micrometers (um). There is also a suite of meteorological instruments. People can reach this data through the Global Monitoring Laboratory website.
Desert Rock, Nevada
Figure 1 shows the Desert Rock site. It is a desert region of sparse vegetation and loose soils common to over half the Western U.S. Figure 2 shows solar and LWIR data over a solar day organized from SURFRAD data. The principal features of interest are: a peak in downward solar flux of just over 1,000W/m2 and upward solar flux that is a constant 20% of downward (surface albedo). The integrated net solar flux for the day is 24 million J/m2.

Figure 1. The default radiation plots from SURFRAD stations are synchronized to Coordinated Universal Time (UTC), so these plots are spliced to provide a clearer view of daily evolution.
Of greater interest is the LWIR record that Figure 2 illustrates. I will first note that the green curve is that which some people claim has never been measured – the greenhouse downward LWIR flux nearly all of which originates in the atmosphere.

Figure 2. Red – downward solar flux; Blue upward solar flux; Amber upward LWIR; Green downward LWIR.
The amber colored curve is upward LWIR flux. The earliest hour just prior to dawn exhibits an average value of 465 W/m2. Since the 10m of intervening atmosphere between the surface and the pyrgeometer contributes less than 1W/m2 from my MODTRAN calculations, 464 of that must represent the black body contribution from the surface. This suggests a surface temperature of 30C (86F). The meteorological station records an average of 31C 2m air temperature during this interval.
At its peak of the day, however, upward LWIR reaches an average value of 670W/m2. The implied ground temperature is now 59C, far above the 2m air temperature of 39C. Intense solar radiation produces a superadiabatic layer near the ground surface which is the source of the ubiquitous dust-devils and thermals similar to those which I described at Albuquerque in this essay and its addendum.
The day ended in all respects near in temperatures and fluxes where it began. Thus, we can conclude that energy storage during this day was close to zero. The cooling due to LWIR is positive upward at a net of about 13.6 million J/m2. In other words, on this day the near surface Earth was cooled 57% by LWIR and 43% by other means – thermals or horizontal transport but no significant latent heat probably because the day was cloudless and RH remained low.
One final interesting observation involves the downward LWIR flux before dawn. The hourly averaged value is 383W/m2. I thought it would be interesting to compare this value to what MODTRAN would calculate from its midlatitude summer model, with an appropriate adjustment of surface temperature and surface humidity.

Figure 3. A comparison of balloon soundings and a MODTRAN model atmosphere.
This turned out to be 325W/m2; the 58W/m2 difference between the two seemed a large departure. I wondered about it.
To investigate this I obtained balloon soundings from Las Vegas, Nevada which is the closest I could find to Desert Rock. Figure 3 shows a comparison of the MODTRAN midlatitude summertime model atmosphere temperature structure offset by 30C, to the morning and midday soundings. A notable observation is that a 1,000m thick layer of the atmosphere near the ground surface cools overnight through radiation. This is so common throughout dry and elevated portions of the Earth that it is only notable about one time.
Figure 3 shows the MODTRAN model atmosphere has a more or less constant temperature gradient as the orange curve indicates. The morning sounding (6 am Las Vegas time on the 26th) shows a structure that if the orange curve was offset to the surface temperature of the sounding would leave a thick segment of air aloft with a temperature above the model atmosphere. I did an approximate calculation using MODTRAN and found about 33W/m2 of adjustment. There is little doubt in my mind that the entire 58W/m2 is explainable by atmosphere temperature structure.
Goodwin Creek, Mississippi
This SURFRAD station is located near the Waterways Experiment station at Vicksburg. Figure 4 shows the location which is lush with surface grasses and nearby woods. The tower with the pyrometers is apparent as is the meteorological station.

Figure 4.
Figure 5 shows my reconstructed solar day data. I find it a remarkable example of how clouds modify insolation. The downward solar flux is greatly depressed while clouds, especially thunderheads, pass over. However, clouds do more than just shade the Earth. The peak insolation is nearly 1250W/m2 showing that clouds can redirect insolation to places other than the places they shade. The net full day insolation here is 8.6 million J/m2.
The LWIR flux curves are remarkable also. Note how close they are to one another. They even intersect at times. This is a consequence of the extremely wet atmosphere near the surface which ranges in relative humidity from 80% to 100% from the surface to 700mb at 3.2km above the surface. Net LWIR, while being directed upward, does not supply nearly the fraction of cooling that it does at Desert Rock. Net LWIR is only 2.1 million J/m2. Thus, LWIR provides only about 24% of the cooling needed to offset insolation. Assuming that at the end of day we return near enough to conditions at the start of the day, bulk heat transport must provide 76% of the cooling.[1]
The upward directed LWIR in the darkness before dawn (449W/m2) is exactly what the 26C air temperature at the time would predict. At the peak of upward LWIR in the 1800 UTC hour, the implied surface temperature is just 6C warmer than air, but this is enough to run thermals as the observations at Albuquerque and its addendum showed.

Figure 5. Radiation plot from Goodwin Creek, Mississippi for the day beginning at about 6 am local time on July 25 and ending at roughly 6 am on the 26th. The default radiation plots from SURFRAD stations are synchronized to Coordinated Universal Time (UTC), so these plots are spliced to provide a clearer view of daily evolution.
Figure 6 is a Skew T plot of the balloon sounding from Jackson Mississippi at 7 am local time on the 25th. The extremely humid atmosphere from surface to 700mb is apparent. The atmosphere at this time consists of layers of humid air interspaced with dry air. A similar structure is observed from balloon soundings across the plains and Mississippi valley this same day.
What a person can see with Skew T plots at west coast stations from a few days prior is that dry air throughout the troposphere is a boundary condition to the continental U.S. established by flow over the Pacific. Modifications occur each successive day as air traverses the country. Exactly how the atmosphere obtains the structure of Figure 6 is too complicated to unravel with the limited data at hand. Suffice it to say that radiation and bulk heat transfer work hand in hand to produce it.

Figure 6. Skew T diagram of the balloon sounding from Jackson, Mississippi at 7 am local time on the 25th of July, 2026. Note the extremely moist atmosphere below 700mb.
Appendix A
People like to quote Richard Feynman. His most famous quotation may be his definition of science being the primacy of experiment over theory. Yet, I keep in mind another quotation I find more valuable. Feynman stated it in reference to the classical theory of paramagnetism being just plainly wrong, but it applies to all of science. Just eliminate the word “classical” in this.
“If you start a [classical] argument in a certain place and don’t go far enough, you can get any answer you want.”[2]
I am also tempted to invoke Fredric Bastiat’s broken window fallacy to prove this idea is universal, but maybe that’s whipping a dead horse. We all know about politicians getting any answer they want.
There is a common refrain in discussions here that bulk heat transport dominates at the Earth’s surface, takes the job away from radiation so to speak, and only hands off the job back to radiation very high in the atmosphere. I think it’s important to dispel this notion because from data and other considerations, it’s difficult to view the job of transporting heat from surface to space as anything other than a shared responsibility of radiation and bulk transport.
The commenter known as “Frank from NOVA” urged me to look at an online document, which I located and downloaded from Andy May’s website, by Tom Shula and Markus Ott. Its explanations of the interaction between radiation and matter are 90% correct, but just as Feynman warns, they aren’t taken far enough for a valid conclusion.
Let’s begin with their Figure 2.

All that this diagram shows us is that a CO2 molecule may absorb a 15um photon then release a photon (spontaneous or stimulated) to return to its ground state. According to the authors this is a slow process. So far, so good.
Proceed now to their Figure 5.

Their Figure 5 shows the process of de-excitation of a CO2 molecule without emission of radiation. The molecule of CO2 in an excited state of vibration has collided with another molecule and converted the energy of its excited state into altered kinetic energy of that other molecule. So far, so good, also.
Now they embark on a discussion about how often the process of their Figure 5 occurs with respect to the process of their Figure 2. They find the vast majority of CO2 molecules in an excited state will proceed via Figure 5 back to a ground state. Also, so far, so good.
Yet here is what they state as the main take-away of their discussion to this point.
“That means that in air under ambient conditions the thermalization rate is by a factor of about 50,000 higher than the emission rate of the excited state. As a result of this rough calculation, we can say that at atmospheric pressure and ambient temperature the thermalization of the excited state of the CO2 bending vibration is by four to five orders of magnitude faster than the spontaneous emission from this excited state. Even if an excited state somehow escapes the thermalization and emits a 15-micrometer photon, this photon will be absorbed after traveling a few meters through the atmosphere by another CO2 molecule. It is highly probable (~50,000:1) that the excited state resulting from this lucky escape will then be thermalized. Under these conditions a radiative transport of energy through the lower layers of the atmosphere by a cascade of emission and absorption events is not possible.”
First, keep the words “not possible” in mind. I’ll return to this. Then let me simply state that the rapidity measured by (50,000:1) is really a red herring in this context. All that rate tells us is that exchanges of energy within the volume of gas occur in tremendous numbers per unit time. But what seems underappreciated is that through such exchanges there is a process of establishing thermal equilibrium. Molecules within a sea of photons and subject to a flux of photons from a source like the Earth’s surface, or out of a neighboring volume of gas, is going on at a very healthy rate. This rapidity is what produces and maintains a state of Local Thermodynamic Equilibrium (LTE). It’s what returns a state of momentary disequilibrium back to equilibrium.
Now, refer to their Figure 8.

Figure 8 shows us how the alleged impossibility of the release of a 15um photon down in the lower atmosphere actually becomes possible throughout the atmosphere. The de-excitation process is actually two-way. Through collisions the CO2 molecule may be raised to an excited state and release a photon.
This is where Feynman’s dictum about not taking an argument to a conclusion becomes essential. The processes of their Figures 2, 5, and 8, all take place within each volume of gas down at the Earth’s surface, and each one high in the atmosphere, and each one every place in between. It is an example of the principle of detailed balance in operation.
The authors even calculate what the results of detailed balance and thermal equilibrium imply – a Boltzmann distribution. They correctly figure a stationary ratio of molecules in the excited state to those in the ground ground state at any time as a function of local temperature – 1.3% at -53C, 3% at 15C, 4% at 30C.[3]
What this implies is that at Earth’s surface, where a mole of atmosphere is contained in around 25 liters of air, there are 6×10²³ molecules of air, 2.4×10²⁰ molecules of CO2, and around 9×10¹⁸ of those CO2 molecules in an excited state that will emit a photon in the next half-second. There is a vigorous diffusion of photons, and other energy conversions, all serving to keep the system as a whole near LTE. Moreover, since the process of their Figure 8 occurs at a boundary of the gas volume, 15um radiation will be detected by a radiometer of suitable design. A pyrgeometer is just such a beast of suitable design.
Citations:
1-Balloon soundings taken over the full day at Jackson show that the atmosphere’s structure has changed. No doubt some of this change is due to the heat conveyed away from the Earth’s surface but I haven’t enough information to analyze how.
2-Feynman’s Lectures on Physics, Vol. II, 34-6, First Paragraph.
3-We might include the Lectures on Physics, Vol. II, 35-8, midpage starting with “Now statistical mechanics tells us …”
SURFRAD believes the imaginary 396 BB/333 “back”/63 duplicate net hallucination.
I’d post a graphic or not.
Solar based balance one
SURFRAD dw_solar
This is comparable to TFK_bams09 161 maybe divided by 4.
SURFRAD uw_solar
This is comparable to TFK_bams09 63
SURFRAD (dw_solar – uw_solar) = kinetic modes
This is comparable to TFK_bams09 (17 + 80).
SURFRAD (dw_solar – uw_solar)/dw_solar
This is comparable to TFK_bams09 (160 – 63)/160 = 61%.
Emissivity 1 = 63/160 = 0.39. Emissivity 2 = 63/396 = 0.16 Used to correct IR readings and denominator of emissivity ratio.
This solar energy ASR/OLR loop is balanced and complete.
Nicholas Schroeder espouses nonsense. Doesn’t know what emissivity is… Rather than let him hijack these comments, here is the last go-round of a few dozen exchanges on his bullshist …from June 28….
https://wattsupwiththat.com/2026/06/28/open-thread-196/#comment-4211678
Now you may continue with Kevin’s good stuff.
You continue to deflect from my 3 points.
GreenHouse Effect theory says with it Earth’s Global Mean Surface Temperature would be 288 K or 15 C, while without it GMST would be 255 or -18 C, a difference of 33 C (not K) and Earth would become a -18 C ball of ice.
That is simply wrong.
There is no consensus that 288 K is the GMST & 255 K is the result of a 30% albedo also no consensus. GMST was 15 C in Arrhenius’ 1896 paper (walked back in 1906) and no GHE means no 30% albedo. Without GreenHouse Gas water vapor there is no GHE and Earth would become much like the Moon, barren, 400 K lit side, 100 K dark.
The GHE energy balance graphic found in TFK_bams09 and a plethora of clones does not in fact balance and violates both 1st & 2nd laws of thermodynamics.
The kinetic heat transfer processes of the contiguous atmospheric molecules render “extra” surface energy upwelling as a calculated 396 W/m^2 black body impossible.
The GHE is failed science and Catastrophic Anthropomorphic Global Warming a fear mongering political and social power grab.
“…continue to deflect”…sorry you forget previous rebuttals so easily…
https://wattsupwiththat.com/2026/04/10/matt-ridley-thinks-the-climate-parrot-is-almost-dead/#comment-4183604
396/333/63 is rubbish, period.
You have not explained the origin of these made up numbers.
Part 2
Calculated balance 2 w BB at ground temperature.
Calling this assumed calculation real does not make it real.
SURFRAD uw_ir
This is comparable to TFK_bams09 396, a BB at 16 C. It is “extra” violating LoT 1.
SURFRAD dw_ir
This is comparable to TFK_bams09 333, “back” radiation violating LoT 2. Instruments are calibrated and spoofed to measure it.
(uw_ir – uw_solar ) = dw_ir
This is comparable to TFK_bams09 396 – 63 = 333
Column 13 – Column 14 = Kinetic Modes = Column 25
These do not match: 13 – 14 = 146.5 & Column 25 = 164
See attached Excel tab (sheet 1)
Column 27 subtracts net solar measured (kinetic modes) 25 & net ir calc’d 26 (uw_solar) . That’s not legitimate.
I guess your heart is in the right place. Your method, though, is terrible. Are you so obsessive/compulsive you do not see that you are bombing every topic with content that we have all long ago concluded is not worth trying to decipher? Write an article, run it by the Mods. If it gets posted then you can duke it out in the comments of that article.
Eaxctly. This is what a vigorous debate should entail.
So, why & how am I wrong?
Earth is cooler w atmosphere/water vapor/30% albedo not warmer.
Ubiquitous GHE balance graphics (TFK_bams09 et al) don’t + violate LoT.
Kinetic heat transfer processes of contiguous atmospheric molecules render surface BB and “extra” GHE energy impossible.
GHE = bogus & CAGW = scam.
43 words.
Bet you can’t refute them in as few.
Going off topic or changing the subject to esoteric Wiki’s, appeals to authority &/or ad hominem insults do not count.
OK. I’ll bite.
Without water vapor, as SURFRAD shows, albedo is around 20% and Earth is warmer with clear sky.
I have never liked a “Global Energy Balance”. Engineers would agree that averages are basis of bad designs. I wish scientists would consider the same.
Forty-two words.
No water vapor means no clouds, ice, snow, no 30% albedo for that matter no oceans.
GHE say w/o is 255 K.
No albedo = 278 K
GHE is wrong.
Temperature is by definition and application the kinetic energy of stuff.
In the void of space there is no stuff or KE so temperature is undefined.
When the EMR of the no longer void encounters stuff, that radiation produces KE.
How do we know?
Stuff gets hot.
The Moon, ISS, Earth, Artemis, Sky Links, JWST, hood of your truck sitting in the parking lot.
How hot?
ISR is 1,368 W/m^2.
Applying the S-B hocus pocus factor: (1,368W/m^2 / 5.67E-8 W/m^2/K )^.25 = 394 K, 121 C, 250 F.
I remember someone here once claiming that there were no pilots that fit the dimensions of the ‘average’ pilotl
Earth is cooler w atmosphere/water vapor/30% albedo not warmer.
Without water vapor, as SURFRAD shows, albedo is around 20% and Earth is warmer with clear sky.
This seems to say the same thing?
Gets a lot less vigorous when you cancel your critics and skeptics.
“Your method, though, is terrible.”
Back that up.
NS….the thread-jacker…mods can you limit this guy’s word count per article or something ?
Is that your science – censorship??
Considering some of the 10,000 word bloviaotrs I’m hardly wordy.
“Write an article, run it by the Mods. If it gets posted then you can duke it out in the comments of that article.”
I have a cover page w glossary and 3 power point decks.
If the Mods are interested in posting, they can let me know.
How about you taking the initiative and not hijack the thread?
Refute my points.
“Column 27 subtracts net solar measured (kinetic modes) 25 & net ir calc’d 26 (uw_solar) . That’s not legitimate.”
27 is a real number, 26 is a calculation out of thin air.
You are quite correct on one very important point.
Those energy imbalance graphics seriously over simplify reality and are pointless and worthless.
They are the essential heart of the GHE & without them GHE fails as does CAGW.
Kevin, great sleuthing with the SkewT…liked your Shula and Ott take-down…a paper sometimes referred to in these pages that draws conclusions before really finishing it’s calculations by putting watts to them…
Thanks for the kind remarks. There is so much available data online that I often dispair of just pointing it out to everyone, let alone writing about its meaning.
Despair not dispair — stream of consciousness typing…
‘…a paper sometimes referred to in these pages that draws conclusions before really finishing it’s calculations by putting watts to them…’
I didn’t see the word ‘watt’ in the referenced article, other than as a reference to ‘WUWT’. I am curious, however, how you can attribute directional energy flow to ‘measured’ multi-directional radiances given the non-existence of any instrument that can actually measure the Poynting vector.
“ I don’t see the word WATT in the referenced article”
Exactly my point…
…And my point was that you said their paper draws conclusions ‘by putting watts to them’, which, of course, they didn’t because Watts didn’t enter into any of their calculations.
I was saying they draw conclusions before doing any “watts” calcs…they are running very close to junk science…
I see a lot of work by others, including van Wijngaarden & Happer, in their paper. So they’re not differing on the basis of Watts, but about the predominant mechanism of energy transport through the troposphere.
Given that Dr K grades them out at 90%, along with a few ‘so far, so good’ comments, perhaps you can point out exactly where you believe they are ‘running very close to junk science’.
They use the S-B hocus pocus factor which involves correct emissivity which no one here understands.
Interesting, the discrepancy between the Nevada observations vs. ‘midlatitude summer model’.
Knowing (& finding herein) little description of how the ‘MODTRAN Model’ works, I asked the following question:
And received this ‘overview’ answer:
So the question for KK is which ‘built-in or user-defined microphysical cloud model’ has he attempted, in order to resolve the discrepancy?
It isn’t possible to use the gratis MODTRAN interface provided by U of Chicago to do truly detailed calculations because I can’t input a model atmosphere. They provide 6 clear-sky models, and then allow a person to modify water vapor, CO2, and a couple of very minor IR active molecules, then add just a few different cloud models. The clear sky models all exhibit declining temperature and RH with height and so are very unlike the Skew T in Figure 6.
Spectral Sciences, Inc. also offers a free online version, but it uses a slightly better radiative calculation, does so over a more restricted range of wavelengths, and doesn’t allow for much more modification. Keep in mind its use is not the study of weather and climate but to aid in the design of optical instrumentation and sensors.
A full functioning model from Spectral Sciences, Inc. would cost about $5,000 and would come with an annual fee of about $5,000. I could never justify the expense. However, it’s possible to extend the free versions by assuming linear departures when the adjustments are small and then engage in superposition of portions of models.
I hope this explains the situation in general.
If you have detailed questions, I might be able to answer them
Briefly, YES, and much obliged for this clear response: ‘Clear-Sky’ limited.
An immodest suggestion:
Perhaps, for this predawn remote-desert case of the ‘extra 58 W/m^2’ of IR, the instrumental infrared spectrum would show a low-broad-background (integrating to ~ 60 W/m^2) that could be subtracted from the total signal, leaving the clear-sky (vapor-only) spectrum that matches the MODTRAN output, both in its spectrally resolved component and (to the question) its integrated intensity (~ 383).
“Clear Sky Limited”….but you can select a cloud model at the climate zone of your choice…run it at 400 and 800 ppm CO2 and discover that the additional CO2 has less effect than the Clear Sky model at the same zone….cuz albedo mostly…
Can someone confirm this:
Infrared electromagnetic radiation (LWIR) is a photon – – singular – – and does not have a temperature that can be measured like a cup of hot coffee. Thus, it is meaningless to argue that the cold atmosphere cannot transfer heat to a warm earth surface.
One site on the web offers this: “… temperature is a parameter defining a statistical distribution, …”. In my mind, a photon is not a distribution of independent particles or molecules.
There are dozens (hundreds) of sites on the web offering often confusing discussions.
Oops! forgot this:
” the green curve is that which some people claim has never been measured “
This is a really good comment and I’ll try to be brief. There is all sorts of argument defining what a photon is, and it’s best to ignore most of it. EM radiation, as you may know, sometimes behaves like a wave and at other times like a particle. In the context of the distribution of energies that defines the “temperarure” of an ensemble of molecules, it best to think of photons as a ensemble of particles too. The entire ensemble “molecules + photons” must be in a stationary equilibrium if we are to equate a bulk property like temperature to the ensemble.
If one were to suddenly allow a beam of photons from a hot body to invade our ensemble then this would upset the equilibrium, thus change the shape of the distribution of energy in “molecules + photon” and by the time a new equilibrium were established the bulk material would have a higher temperature.
When the number of molecules is extremely low ber unit volume, but the number of photons much greater, then it is difficult to establish equilibrium. The photons would look like they have a different temperature than the molecules. In this state there is no local thermodynamic equilibrium (LTE) but this never occurs, I suspect, anywhere below about 70km above the surface.
If one looks closely at the 2 slit experiment one finds photon as a particle fails the null hypothesis test.
Photon was assumed to be a particle but showed EM interference patterns with no discernable particle signature. Hence, it was declared there was a dual particle wave phenomenon.
The experiments with electrons and proton failed to note that both are charged particles. Being like charged they will interfere with each other. In addition, charge in motion creates an EM field. The magnitudes may be too small to be detectible, which could be part of the reason it was not addressed.
There is nothing in physics that declares that an EM wave front has to be as large or larger than the Plank calculation.
End.
This isn’t exactly correct. A photon or quanta doesn’t have a temperature. It has energy as in E = hc/λ. λ or wavelength must match the absorption frequency of a molecule or it won’t be absorbed. A black body radiating a Planck curve will most likely have a wavelength that matches a large number of molecules. However, a simple molecule like CO2 does not absorb/radiate a Planck curve with all frequencies like a black body would. CO2’s main absorption wavelength at IR is 15 um. A CO2 molecule can extract a quanta or even a number of quanta from an EM wave depending on the different oscillations it has. When it emits, it does so at 15 um only, not a full Planck curve. It is one of the reasons I believe that CO2 has little effect on the surface temperature. It is a pimple on the Planck curve of the surface.
To add a bit to Kevin’s reply, thermally induced LWIR consists of a flux of photons of varying energies where the distribution of photon energies depends on the temperature of the object and the emissivity of the object as a function of photon energy. One of the projects in the B-70 program was to develop a coating that had high emissivity at energies corresponding to high atmospheric IR absorption (i.e. IR stealth), conversely many researchers have developed coatings that have high emissivity in the atmospheric IR windows and low elsewhere. In the latter case, the coated surface is cooler than its surroundings as it reflects the downwelling IR.
To get back to your original question, all bodies above absolute zero will be radiating and thus transferring some heat from cold to hot but the net flow of heat will be from hotter to cooler.
As for the “greenhouse effect”, think of it as a form of thermal insulation in that it impedes heat transfer from the earth’s surface to the 3K temperature of cosmic background radiation.
‘As for the “greenhouse effect”, think of it as a form of thermal insulation in that it impedes heat transfer from the earth’s surface to the 3K temperature of cosmic background radiation.’
Occam’s razor. Why not just consider that GHGs cause the troposphere to convect, and that convective heat transfer is a slower process than radiative energy transfer?
Frank,
You don’t need IR active gases for the atmosphere to convect. With a diurnal cycle there is plenty of convection due to direct conduction from the surface.
You do need IR active gases to cool the atmosphere, however.
John: As far as I can see, no one knows exactly what a photon or, for that matter, any subatomic “particle” IS. That of course leads to massive confusion. But we do know at least some of the properties of all photons. The three properties that seem relevant here are that photons have a velocity (the speed of light), photons have 0 (zero) mass, and that every photon contains a indivisible, transferable dollop (a “quantum”) of energy.
A consequence of the above is that photons can’t have a temperature according to classical physics because classical physics equates temperature to kinetic energy — mass times velocity squared. Plenty of velocity squared times zero mass is still zero. But photons can transfer their energy (all of it, quanta are not divisible) to things they encounter. In the case of CO2 and LWIR, that energy ends up in the molecular bonds between Carbon and Oxygen. The “excited” CO2 molecule can then either eventually reradiate the energy or, because collisions between molecules in the lower atmosphere are very frequent, translate the energy to kinetic energy by speeding up the molecules involved in the collision. That increases the temperature of the atmosphere by an amount exactly equal to the amount of energy that was “lost” by the original source when the photon was emitted.
I hope that makes sense.
Nice explanation. I would only add that photons are not unique particles, they are part and parcel of an EM wave at a given wavelength. They are only particle like when an EM wave at the correct wavelength interacts with a physical phenomenon like a molecule or atom. I envision it in my mind like an EM wave being beads strung on a string. The energy inherent in an EM wave can have lots of quanta or photons that can be absorbed if the wavelength is correct. As energy is increased in the emitted wave, more quanta or photons are available for absorption.
I think the photons are like a plasma shield created at the front of the electromagnetic UV wave.
The high speed of the UV wave creates heat which creates this plasma shield.
In applications that use plasma, emissions occur in the form of UV radiation.
A photon, contrary to what many believe, is not a particle. It has no substance. It is a quantum of energy. It is a mathematical expression using Planks’ Equation that defines the energy needed to raise the valence state of an electron.
A photon is not a “particle” in the classical sense, or any sense for that matter. There is no wave function for the position of a photon, its “position cannot be defined.
A photon is an excitation of the electromagnetic field, but the electromagnetic field itself is not intrinsically quantized in position space. The quantization only manifests in interactions with matter, which does have intrinsically quantized allowable energy levels. Position space is what we experience and observe. The quantization of the E-M field is in “mode space”, a mathematical construct of quantum electrodynamics.
Imagining electromagnetic radiation as consisting of photons as little packets of electromagnetic energy whizzing about is a sometimes useful bookkeeping analogy, but it does not represent reality.
Nice article, thank you. But I have one suggestion and one question:
In the last paragraph before the listing of citations, I suggest the following correction as noted in bold text:
What this implies is that at Earth’s surface, where a mole of atmosphere is contained in around 25 liters of air, there are 6×10^23 molecules of air, 2.4×10^20 molecules of CO2, and around 9×10^18 of those CO2 molecules in an excited state that will emit a photon in the next half-second or—much more likely—share their excess energy with N2 or O2 molecules via collisions well before that half-second or so elapses.
Question: in the above article’s Figure 2, what explains the approximately constant value of the green line (downward LWIR) over a 24 hour period despite the significant variations and daily peaks in the red (downward solar flux), blue (upward solar flux, i.e., albedo), and amber (upward LWIR)? There appears to be some sort of power flux “regulation” occurring w.r.t. atmospheric “back radiation” . . . but given that these measurements were obtained over dry, desert land located outside of tropical zones, neither the “atmospheric iris” hypothesis offered by Prof. Richard Lindzen nor the “emergent phenomena/thunderstorm thermostat” hypothesis offered by Willis Eschenbach would seem to explain this.
Curious . . . and I can’t even speculate as the what might be at work here, assuming the presented data is representative of the majority of days in a year.
Possible explanations from others would be most welcome!
I am glad you raised this point because it helps me understand the confusion about this topic. You have addressed others for commentary, so I will confine my response to simply clearing up your “correction”.
Your correction is what I am trying to correct in this Appendix A. If it is possible to speak of a “temperature” that defines a volume of air, that temperature is related intimately to a distribution of molecules in various states of energy. It determines the shape of the distribution or what is equivalent the occupation numbers of various energy levels. It is what is called a “stationary” distribution. That is to say, stationary means it doesn’t vary with time. So, as long as temperature remains constant for this volume of gas then the ratio of molecules in one energy state or another remains constant. The individual molecules may be doing all sorts of things, but the fraction remains the same. You can equate the term stationary with Boltzmann.
So, there are always roughly “9×10^18 of those CO2 molecules in an excited state that will emit a photon in the next half-second “.
It is a constant of the problem and the rate of 50,000 or whatever per second is, as I said, a red herring. There is always this number available in the upper state of energy each with a probability of transitioning spontaneously to the lower state in the next half-second or so.
Others can tackle the remainder of your comment.
Well, thank you for your reply, but my understanding is that a Boltzmann energy distribution is an equilibrium state for a mixture of gases, but that is not the same as a “stationary” distribution that you define as having some fraction of molecules “in an excited state that will emit a photon in the next half-second”.
Again, my understanding is that, in a Boltzmann distribution for a mixture of gases, the atoms/molecules are spread across different energy levels—all sharing the same average kinetic energy per degree of freedom—based on probability theory (ensemble statistics) for the given uniform temperature of the mixture, and absent any fraction of such particles have a particular “excited” state.
But perhaps I’m wrong.
Boltzmann is the stationary distribution. Other possible distributions are Bose-Einstein for spin one particles or Fermi-Dirac for spin 1/2 particles, but both of these converge under common conditions to the Boltzmann distribution.
I am having trouble interpreting your second paragraph.
1) To repeat,a “stationary distribution” as you have defined it, is simply NOT a Boltzmann (equilibrium) distribution.
2) A Boltzmann distribution applies only to a “continuum” (aka large ensemble) of interacting particles, such as molecules and/or atoms in Earth’s atmosphere where Kn < 0.01, and is based on statistical probabilities of modes mechanical energy (sensed overall as temperature) as determined by translational, rotational and bond-vibration degrees of freedom. It does not involve electron cloud energy levels (including spin states) or nuclear particle spin states.
3) Bose-Einstein distributions apply quantum mechanics to cases where bosons (subatomic particles with integer spin state) are cooled to near absolute zero. Similarly, Fermi-Dirac distributions rely on quantum mechanics as applied to fermions (subatomic electrons, protons, and neutrons) with half-integer spin state, especially at temperatures approaching absolute zero. Neither of these distributions has any significance when applied to the range of conditions (including intact atoms and molecules) encountered in Earth’s atmosphere. In this regard, I am having trouble interpreting your statement that “both of these converge under common conditions to the Boltzmann distribution.”
Regarding “stationary” just use AI with the following query:
“is the boltzmann distribution a “stationary” distribution?”
Bose-Einstein and Fermi both converge toward Boltzmann at environmental temperatures. I.e. once quantum mechanics looks pretty much like classical statistical physics…
‘It is a constant of the problem and the rate of 50,000 or whatever per second is, as I said, a red herring.’
Kevin, I’m very certain that Shula-Ott (SO) never disavowed the existence of atmospheric radiance. The actual ‘red herring’ is applying the mechanism of radiative transfer to tropospheric energy transport on the belief that this observed radiance actually means that thermal EMR from the surface escapes to space predominantly via the spontaneous absorbtion and emission of ‘photons’ in accordance with Kirchoff’s Law.
What the 50,000:1 (or whatever) ratio effectively means is that thermal EMR emitted by the surface is effectively decoupled from the radiation observed from space by the process of thermalization, i.e., the conversion of thermal EMR to sensible heat.
This sensible heat is convected aloft by air parcels, which are not just sitting there at ‘LTE’, which is another red herring, but are expanding and doing work in accordance with an irreversible thermodynamic process.
Frank, I’ve done my best on a number of occasions. I am making no progress with a contingent of folks here. You have engaged nicely in discussion with me.
Best to you.
Best to you, as well, Kevin. Your articles on the subject at hand always rank among WUWT’s most interesting and insightful. As I alluded to Rud Istvan, below, but for the ‘paleo record’, I would probably be ok with your explanation of the GHE.
Thank you for your efforts on these topics, Kevin.
A wide array of possibilities of how physical phenomena work is essential for best understandings.
I get that you can only avail yourself of and work with whatever pre-prepared base numbers are made available by those entities who produce such constructs.
I just wish that “the industry” would introduce and impose a ‘pedantic’ definition of correct use of the term “data”.
For example, change the term ‘Global Average Temperature” to something more honest such as “Earth’s Derived Temperature Construct”.
The basis of my beef on all this is that “data” seems to have become the accepted term for sets of numeric values that have often-times been the end products of more additives & processing than ketchup requires.
These practices corrupt the Probity of presented temperatures values as scientific inputs.
“Data” should only describe and mean the assembled plural datum (not SUM or PRODUCT, AVERAGE, MEAN or any other process) of “direct, untouched readings from certified, calibrated instruments or other specialist devices”.
If a numerical construct is actually the end result of averaged averages for example, it should not the accorded the status & respect that “data” carries.
Call it what it is – a construct often involving multiple assumptions (a.k.a. opinions?).
And those multiple assumptions are often unstated and therefore unexamined.
A succinct description of the difference between a datum and a construct. An average is a construct, especially when used with temperature that is intensive. A construct to be fully understood must have a description defining its shape. That is, an average number without a variance, standard deviation, range, etc. has no meaning because one cannot envision the data that was used to build that construct.
An anomaly is another construct using two different constructs. If the means of those constructs are added or subtracted in the case of an anomaly, then one must also deal with the variances of each construct to determine the final shape of the construct. Climate science fails to deal with any of this and simply forges ahead ignoring the full description of a construct and acts like the mean/average is a standalone number that can be used in more constructs with no further attention.
Kevin,
Thank you for this article – obviously a lot of effort has gone into it, so I’m certain it will take some time to formulate what I presume will be a number of questions. I’ll start with these (all reference to Desert Rock Figure 2):
Since you brought up ‘Boltzmann’ and ‘Feynman’, here’s an abbreviated Q&A from a lecture by the late Michael Mishchenko:
https://youtu.be/hjKJyn_uoIE?t=3522&si=TK3l54MEhKZ_7wtY
The LWIR instruments are at 10m height.
You can look at the various radiometers specifications. Naturally the Eppley website appears to be down because no link from the GML works. However, to be called a pyrometer the response range must be around 0.4um to 3 or 4um. To be a pyrgeometer it is 4 or 4.5um out to perhaps 40um. The response is flat. It is in effect a bolometer. so what flux the instrument records 8-13um is the flux in the 8-13um band.
Taking data from Desert Rock as an example, at peak of day you can get an air temperature of 37C at 2m that is close to the dome temperature at 10m on the pyrgeometers of say 314K = 41C. Keep in mind, though that if you lay a whole group of objects out in the sun they will all be found at different temperatures because their heat transfer characteristics are all a bit different — chrome plated tools are owwie.
The LWIR instruments are corrected using a First Law of Thermodynamics balance on a control volume. So there really is no “reference” temperature per se. They are corrected to the dome and case temperatures which are measured.
Yes, at night you can see downward LWIR flux at Desert Rock as my text states again of 383W/m^2 in the early morning hours before dawn. The flux declines generally during the night as air temperatures within a couple hundred meters near surface decline.
I get frustrated listening to Mishchenko. He’s one of those guys, often from Eastern Europe or the Soviet Union, who will insist that you are doing everything wrong, because you are too steeped in physics or are maleducated. Then around and around in circles you go with him until in the end you are back exactly where you started.
As an example, Mishchencko would say that your well collimated radiometer is not measuring the radiance of its view because off axis radiant energy is scattered into view — perfectly good observation. Yet what he is describing is just noise. One either finds a way to bypass the noise (restrict band width perhaps) or process it out, or think about a different way of imaging; but what one doesn’t need is new physics or in the case of what he is often advocating, really old physics.
‘To be a pyrgeometer it is 4 or 4.5um out to perhaps 40um. The response is flat. It is in effect a bolometer. so what flux the instrument records 8-13um is the flux in the 8-13um band.’
Absent specifying where the ‘back radiation’ is coming from, this doesn’t clarify anything for me. Specifically, on a clear night, the downward-facing instrument will be ‘seeing’ radiation emitted from the ground, aka condensed matter, within the atmospheric window, plus the radiance from GHGs in its immediate vicinity.
Meanwhile, the upward-facing instrument will only be ‘seeing’ the radiance from GHGs in its immediate vicinity. Given that both instruments are at roughly the same level above ground and presumably seeing the same amount of GHG radiance, how does this support the alarmist concept of ‘back radiation’, i.e., that the surface is being warmed by the spontaneous emission of ‘photons’ from CO2 up in the wild blue yonder?
‘…Mishchencko would say that your well collimated radiometer [WCR]is not measuring the radiance of its view…’
I think his actual point was that a WCR IS measuring radiance, but not directional energy flow. By the way, there are / were non-Eastern European / Soviet physicists, e.g. Freeman Dyson, who are / were also skeptical of the current RTT paradigm.
The downward facing radiometers are on the ten meters tower, upward facing instruments are on a lower platform well separated to avoid shadowing.
It would be extreme circumstances that would produce much radiance from 10 m of air. 10m of 400ppm CO2 at sea level is only 0.004 atm-m or about 0.01 atm-ft of path and at 300K the equivalent emissivity graphs indicate an effective emissivity of 0.03 — pretty small.
Heat definitely escapes at the top of the troposphere, at the 200–150 hPa level. The lowest oxygen radiation is always recorded above this level. Radiation slowly increases starting at the 70 hPa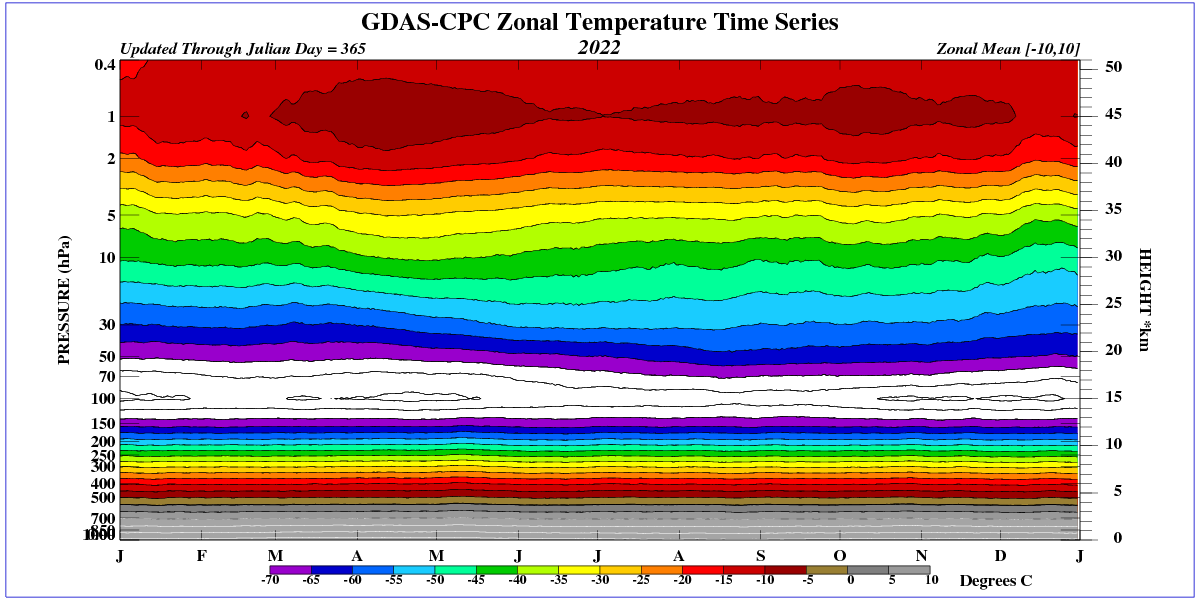 level.
Gorgeous graphics!
Does “Zonal Mean [-10,+10]” refer to Latitude, i.e the equatorial tropics?
How does it look as troposphere-only, e.g. the range (1,000 to ~ 150 hPa, or 0 — 12 km)?
Yes, this applies to equatorial regions. At high latitudes, the situation is more complicated. It can be seen that heat loss begins as early as an altitude of about 300 hPa (about 7 km).
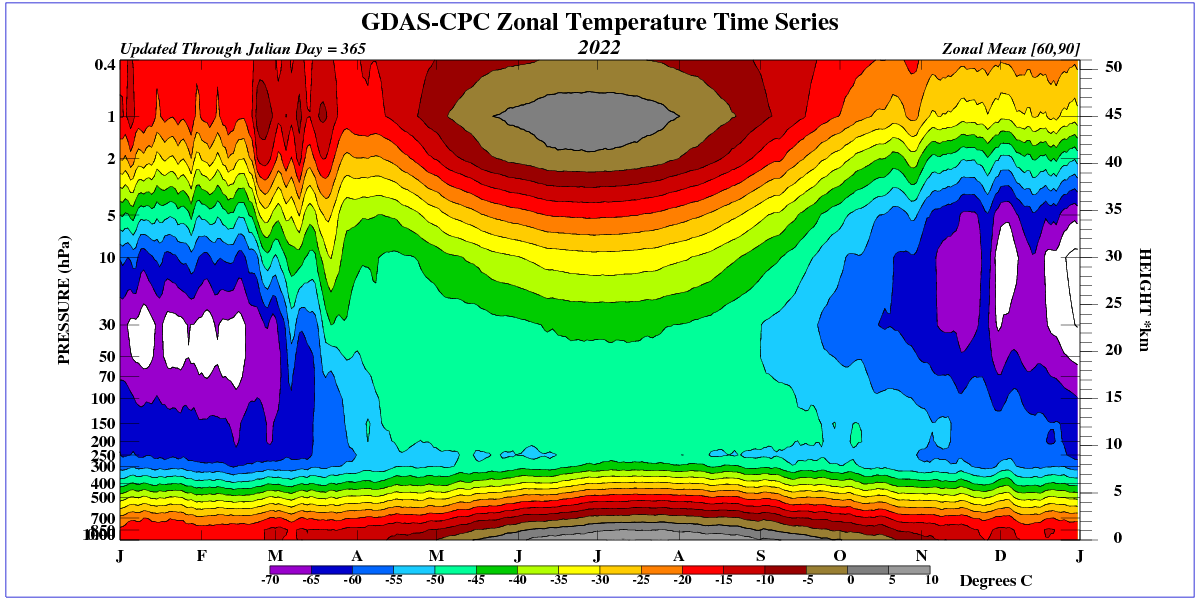
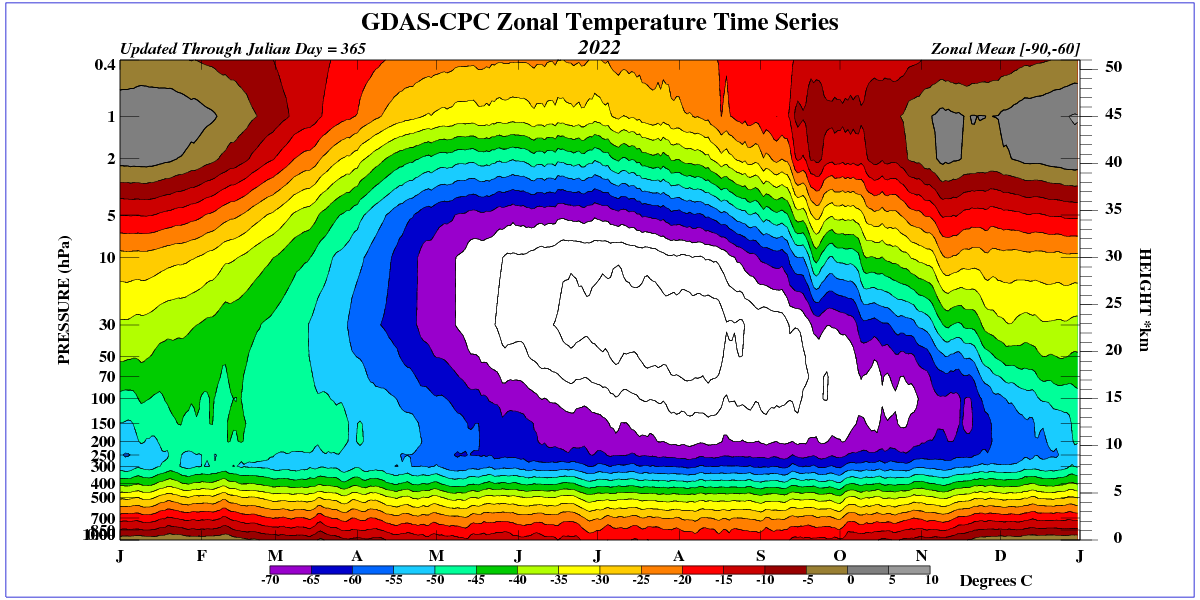
In contrast, down to the 150 hPa level in the tropics, the troposphere is distinctly adiabatic. Of course, the graph shows average values measured by a satellite.
Nicely done. Kudos.
Unlike you, I concluded a few years back that posting observational basics for those who appear not to recognize them was a fruitless endeavor.
Twenty four years as an industry consultant followed by 24 years as a college professor has trained me to “engage” no matter the success of previous experience.
Excellent point. College instructors get a new group of students every couple of months and have to start at the beginning.
Try telling recent HS graduates the Moon doesn’t make tight circles around Earth. Success? Rare.
There are no ‘observational basics’ in the either the carbonate rock or ice core records that support the theory that atmospheric CO2 content is the control knob of the Earth’s climate. However, climate models, which rely upon radiative transfer codes to model heat transfer through the troposphere, would lead one to conclude otherwise. My presumption is that the latter are incorrect.
Downwelling infrared is available throughout the day.
Downwelling global solar is only available during those hours of sunlight.
Downwelling infrared is included in downwelling global solar.
Why is downwelling global solar lower outside those hours of sunlight than downwelling infrared, when downwelling infrared is included in downwelling global solar?
Have a careful look at the Planck function and you will note that at temperatures like that of the Sun there is almost no black body radiance beyond 4 um or so. Thus, you can separate LWIR from Solar with great efficacy. Downward solar is limited to shorter wavelengths. It does not include LWIR from blackbodies at 300K.
If downwelling IR doesn’t come from the sun’s IR radiation, the term is misleading. The term downwelling IR should in this case be atmospheric IR.
Solar IR, atmospheric IR, ground IR.
Solar IR comes from the sun.
Atmospheric IR comes from stored heat energy in the atmosphere.
Ground IR comes from stored heat energy in the ground.
Downwelling “back” IR originates with the BB upwelling which does not exist as a real thang.
How many times can IR be reflected?
Is the heat energy or radiation intensity affected when IR is reflected?
Or is the heat energy or radiation moved each time IR is reflected or emitted to a new location?
What I’m failing to see here–and I really want to see– is the amount of water in the air, and more importantly is the effect of the water.
According to GROK, at STP if the atmosphere is 10% humidity (typical for summertime in the desert South West), the water content of the atmosphere is about equal to the CO2 content. The percentage of photons striking CO2 molecules will be about equal to the percentage striking H2O molecules.
Then we get into energizing N2 and especially O2 molecules splitting off free radicals. In the Southwest, especially in late summer hot afternoons O3 is plainly detectable by the scent of the air.
Another major point, 78% of Earth isn’t covered by rock, but instead by water. These measurements done over water would be much more relevant … especially referenced to Willis’ work.
FYI, the specific humidity of the lower troposphere averages about 2%, and ranges from near zero (Antarctic winter) to about 4% over equatorial ocean.
The average water vapor impact on GHE for all GHG is computed in an excellent reference paper, available free on line at Heliyon 5(1), 1/23/2019: e01145. For example, the paper shows that the GHE impact of methane given water vapor is negligible.
Thanks, Kevin – very informative post.
Nice article but I have a couple of questions. Here is a graph of temperature and insolation at my weather station.

As you can see the atmospheric temperature varies significantly from day to night. This should be reflected in the downwelling IR. Your graphs show little change and leads one to conclude that the atmosphere’s temperature doesn’t change much.
Also the upwelling IR changes little from day to night and especially during the period of high insolation.
Could you explain what is occurring here.
Thank you.
Any object or gas with a temperature above absolute zero (-273.15 °C or 0 Kelvin) gives off thermal radiation, these objects or gases will emit IR radiation until their temperature has reached absolute zero.
The sun adds thermal energy to objects or gases during the hours of sunlight.
If the sun adds more thermal energy to objects or gases during the hours of sunlight than the objects or gases emit in a day, the temperature rises.
If the sun adds less heat energy to objects or gases during the sun’s rays than the objects or gases emit during a day, the temperature drops.
If what you say is true that gases emit based on temperature then please post an X-Y plot of temperature vs wave length for CO2 from -60 C to +200 C.
Gases like carbon dioxide CO2 do not behave like solid blackbody radiators; they emit and absorb radiation at fixed discrete wavelengths determined by quantum mechanical molecular transitions, meaning their primary emission bands remain at 2.7µm, 4.3µm, and 15.0µm across the entire temperature range from -60°C to 200°C. Unlike solids that follow Wien’s Displacement Law by smoothly shifting their peak wavelength as temperature changes, a gas’s emission wavelengths are constant, while only the intensity of the emission and spectral line-broadening change with temperature.
Quantum Nature of CO2 Emission Bands
Because CO2 is a linear triatomic molecule, it possesses specific vibrational modes that govern its interaction with infrared light:
15.0µm Band (Bending Mode): This is the most crucial band for the atmospheric greenhouse effect. It is active at all temperatures within this range and dominates thermal emission at lower temperatures like -60°C.
4.3µm Band (Asymmetric Stretching Mode): A highly energetic vibration band. While present at -60°C, its emission intensity grows exponentially as the temperature climbs towards +200°C.
2.7µm Band (Symmetric/Combinational Mode): A weaker absorption/emission band that becomes prominently populated at elevated temperatures.
Thanks for the graph. Glad you have admit You were incorrect about gases.
4.3µm Band (Asymmetric Stretching Mode): A highly energetic vibration band. While present at -60°C, its emission intensity grows exponentially as the temperature climbs towards +200°C.
“They will emit IR until reaching absolute zero”
NO, they won’t….they will emit IR until they receive an amount of IR from their surroundings that is equal to what they are emitting.
P = eσA [ Thot ⁴ – Tcold ⁴ ]. ……where TCold is the surroundings temp of the hot object.
Does this mean that CO2 molecules stop emitting IR radiation when the surrounding environment is warmer than the CO2 molecules?
No…if it has a temperature it will emit…just the surroundings emit relatively more for a brief fraction of a microsecond….but much rebounding of CO2 with the 2500 other nearby molecules is gonna make those emissions look all the same temp to an infrared thermometer…don’t know if that helps.
This means that CO2 molecules emit and receive IR radiation all the time.
The intensity of a CO2 molecule’s IR emission depends on the temperature of the CO2 molecule.
If the surrounding environment is warmer than the CO2 molecules, the CO2 molecule receives more IR radiation than the IR radiation it emits.
If the surrounding environment is cooler than the CO2 molecules, the CO2 molecule emits more IR radiation than the IR radiation it receives.
Wrong. A simple counter example: in a container of Neon, or any inert gas, the gas will not emit any radiation below what is required to initiate electron dissociation, roughly 250,000 K. Statistically, some dissociation could occur at ~10,000 K, but not at terrestrial temperatures.
The principle applies to condensed matter only, not gases.
Take a look at the Las Vegas temperature curves and compare 6pm to the following 6 am. Note that only about the lowest 1,000m of atmosphere have cooled over night. Moreover the air is very dry (20% night, 12% day RH), so minimal IR active gas. Thus little change in downward LWIR. The upwelling IR changes a lot — by around 270W/m^2 because the surface, a blackbody, has become much warmer.
“however, upward LWIR reaches an average value of 670W/m2. The implied ground temperature is now 59C, far above the 2m air temperature of 39C.”
2 m air temperature is not the ground temperature. My studies of USCRN data w ground temperatures confirm that the Sun heats the ground, the ground heats the air.
.
I get 689 W/m^2. This is more energy than arrived from the Sun, more than the net, net to the surface violating LoT 1.
This is wrong!!! The instruments are wrong!!! BB emissivity is wrong!!!
The problem is not that downwelling has not been demonstrated or proven, as a product of the 670 imaginary upwelling it, too, does not exist.
BTW I have studied both of your SURFRAD sites & could show you graphs & tables or not.
I never said the 2m air temps are the ground temps. Yes, the surface exchanges heat with air in immediate contact through conduction, but the surface also radiates — a completely separate transport mechanisms.
“…a completely separate transport mechanisms…”
Not so. They are codependent.
Conduction + convection + advection + latent + radiation = 100% & work in concert and are joined at the hips.
Temperature is a function of the kinetic processes, radiation is a function of temperature.
If convection is enhanced with, say, fans the temperature decreases as does radiation which just goes along for the ride.
Kevin, my personal opinion is that your Desert Rock and Goodwin Creek pics, graphs, Skew-T diagrams, and practical discussions using the SURFRAD station data are something WUWT could use a lot more of…for a lot more places and dates…they are truly very good demonstration of the findings and limitations of ground and weather balloon calculations…LW and SW heat flows, MODTRAN,etc…with a lot to be learned by newbies to the WUWT website (and long-tooths as well)…it would be great if you could do something similar every 3 to 6 months or so, as a service to humanity…or at least the part of humanity that expects to find factual climate information at WUWT. I know it’s a lot to suggest…being myself too lazy to write comments any longer than it takes for my morning coffee to get cold…
I liked the appendix, but you didn’t need it to be a “Class A” informative article.
As I tried to convince readers in my article, https://wattsupwiththat.com/2016/09/12/why-albedo-is-the-wrong-measure-of-reflectivity-for-modeling-climate/ , albedo is a term purloined from astronomers who were observing non-luminous bodies in the solar system. Other than Earth, none of them have water. Thus, the retro-reflectance from them is diffuse. If they were uniformly reflective, then the apparent brightness would be controlled by the field of view, and if applicable, the phase. However, for non-uniform bodies, the total out-going flux can only be obtained by integrating the hemispherical bi-directional reflectance distribution function. If the source (Sol), measuring station (Earth), and the diffuse reflector (moon or Earth) are not essentially collinear, then the positions of the diffuse reflecting surface, observing position, and source (Sol) have to be specified for the calculation of the retro-reflection being intercepted and measured.
However, Earth is uniquely different in that ~71% of the surface of Earth is covered with water, whose dominant behavior is specular. That means the water behaves like a mirror, with minor contributions from suspended sediment and plankton, and some minor perturbations from waves that introduce diffuse components. I say “minor contributions” because as the angle of incidence increases, an ever smaller percentage of light actually enters the water where the suspended particles could potentially reflect it back. This is unique because the direction of surface reflection is tightly constrained to a sheaf of rays whose intensity depends on the angle of incidence. One needs to use Fresnel’s equation to determine the reflectivity for a given angle of incidence; the reflectivity varies between about 2% for sea water at normal incidence (0 deg) and 100% for a glancing ray (90 deg). There is a further complication of total internal reflection that I won’t go into here. The following graphic shows the difference:
Nadir-viewing satellites (normal angle of incidence) capture low-angle of incidence views and measurements, averaging about 15% over land, with cloud-free conditions. However, for specular sheaves of bundles of rays, they are likely to be outside the view of the satellite. If the satellite attempting to measure the intensity of a cross-section of a sheave is looking away from the sun it will not measure the sheaf. If there is land between the vertical downward projection of the satellite orbit and the direction of the sun, then the satellite will measure the approximately diffuse reflection of terrestrial materials, or alternatively, clouds. The satellites used in the CERES program typically ‘bin’ their measurements in the region where the reflectivity is changing the most for a change in angle of incidence. I doubt that there are any measurements made of the sun sitting on the limb of Earth because of concern for damaging the sensor.
Basically, I’m encouraging you not to use the term “albedo” unless it refers to a diffuse retro-reflection, and to be wary of claims about albedo that include a geometry that cannot capture specular reflections leaving Earth in the direction opposite the sun. Even the BRDF of waxy leaves of plants tend to have a strong forward lobe so one must be careful of forward reflections of any material. I have a background in remote sensing, which few ‘climatologists’ can match.
Reflection is a complicated subject for sure. I should go see if the GML folks use albedo, but in defence, if you examine these SURFRAD sites they largely consist of grasses or dirt near the tower and the radiometers integrate over a hemisphere of view. They are measuring principally diffuse radiation.
Note added: they do use the term albedo. I also learned that the meteorology suite of instruments is on the 10m tower. I had assumed the temperatures at least were reported at 2m to make consistent with other measuring systems. None of these details affect what I wrote.
Using ‘albedo,’ instead of the more descriptive “diffuse reflectivity,” for those desert locations is acceptable. The problem arises with using ‘albedo’ in climatology as a surrogate for the amount of light that is not retained on a world that is dominated by water. That is, ‘albedo’ is appropriate for estimating the light flux that illuminates the moon, but is is a lower-bound for the light that is not absorbed. Put another way, more light escapes from Earth than is suggested by the measured retro-reflection that characterizes ‘albedo.’
Even newly mown grass has a distinct BRDF that impacts the directional reflectivity for the directions of illumination and observation:
That is, the appearance is changed by different reflectivity created by the orientation of grass blades and the location of the sun and camera. The other key point is that, regardless of the color of an object (a subtractive effect), the higher the reflectivity, the closer the spectrum of the reflected light approaches the spectrum of the source. Thus, both the intensity and spectral characteristics of specular light change with the angle of incidence. Water strongly absorbs IR at normal incidence, but reflects it at glancing angles; climatologists often remark about “dark water” in the Arctic but don’t take into consideration that as the reflectivity increases, the amount absorbed decreases. These issues aren’t taken into consideration in climate modeling.
Anybody with an understanding of EMR knows that downward LWIR does not physically exist. The pyrgeometers that infer downward LWIR through upward optical path transmission are calibrated to the S-B equation to give a scale reading in W/m^2.
There are no self-powered pyrgeometers because they are not measuring energy. By contrast there are self-powered pyranometers because they can use the energy they are measuring to run the indicator.
Rick,
If there is a temperature inversion, and the air above the pyrgeometer is warmer than the sensor, which is at the colder surface temperature, does the downward LWIR physically exist in this case?
If the air is warmer than the surface then there is EMR energy from the air to the surface. You would not use a pygeometer to measure it though. Its calibration would not suit that situation.
Rick,
My inexpensive (battery-powered) kitchen infrared thermometer does a fine job accurately inferring temperatures both above ambient (when the incoming IR is greater than the outgoing) and below ambient (when the incoming IR is less than the outgoing).
No recalibration is needed to do this – if incoming is greater than outgoing, the sensor temp is higher than the reference temp; if the outouting is greater than incoming, the sensor temp is lower than the reference temp. The same thermopile circuits can easily handle both cases.
The same is true for a pyrgeometer. I don’t know why you make it more complicated than it is.
In the case of a temperature inversion, the EMR is radiating from the atmosphere to the surface. However the pyreometer will not read that actual power flux. It will indicate much higher than the physical power flux because it is using the S-B equation to infer a downwelling radiation that needs to be offset by the inferred upward long wave from its body temperature. The only real physical energy flow is from the atmosphere to the surface when there is an inversion.
Separating the T^4 terms in the S-B equation is unphysical claptrap. It leads to all sorts of nonsense like the “Greenhouse Effect” – certifiable BS.
Rick,
Seriously? You believe that the radiative energy flux from an object is dependent on what it is radiating towards? That the higher the temperature of the “target”, if still lower than the source’s temperature, this energy flux will reduce but still be greater than zero? But if the temperature of the “target” is greater than that of the source, it will not radiate anything?
What underlying mechanism do you propose for this behavior? How does the object “know” the temperature of what it is radiating to?
Can you provide any proper reference to back up your assertions? I have never found any, and I have seen many. None of the textbook sources I have ever seen for thermal radiation and the Stefan-Boltzmann law mention anything about the radiative energy flux being dependent on the “target” temperature. (The Wikipedia entry on the S-B law matches my old textbooks well.)
The “S-B equation” in any real reference does not mention a second “target” temperature. There are applications of this equation for the resulting heat transfer between two objects that do use both temperatures, but “separating the T^4 terms” is most certainly NOT “unphysical claptrap”.
The objects exist in the E-M field and they equilibrate at the speed of light. The speed of interaction is the same speed for gravity interaction in the gravity field.
I could ask how does Earth “know” the Sun is there so it can orbit it? Matter communicates through the gravity field. And radiating matter communicates through the E-M field.
NASA physicist Michael Mischenko has done most to apply real physical field theory to radiation transfer rather than the unphysical use of radiation Transfer Equations.
This paper gives the real physical perspective of EMR compared with using classic RTEs:
11_1_online.pdf
This is from the paper:
Even more fundamentally, the local instantaneous Poynting vector ) , ( t rS is a monodirectional vector. This means that even if one assumes that ) , ( t rS describes the direction and rate of local electromagnetic energy flow, then at any moment this flow occurs in only one direction.
Well said, Rick.
Rick,
Ah yes, yet another Poynting vector fanboy who doesn’t understand the underlying physics! The Poynting vector is simply an interesting and sometimes useful statistic about electromagnetic waves.
You quote Mischenko as saying that “the local instantaneous Poynting vector is a monodirectional vector… [it] describes the direction and rate of local electromagnetic energy flow, then at any moment this flow occurs in only one direction.”
But this Poynting vector is just the vector sum of those for all of the EM waves passing through that point. There are an infinite number of possible underlying waves that would produce the same Poynting vector.
It is as if you were arguing that a business’ profit/loss “vector” was a thing by itself, so that there were really no “income sources” or “expenses” for the business. In reality of course, the profit/loss is just the vector sum of income sources (pointing in the positive direction) and expenses (pointing in the negative direction).
You say that “radiating matter communicates through the E-M field”. What property of the E-M field suppresses the radiation of other sources? Which of Maxwell’s equations should I apply?
Fundamentally, you are treating energy flow as a moving physical substance, just as the early 19th century fans of caloric theory did. You do know that has long been discredited, don’t you?
Ed, assuming it’s well calibrated, your kitchen IR thermometer is fine for ascertaining the temperature of bodies that radiate at wave lengths within the atmospheric window. Given that a pyrgeometer also detects the radiance of GHGs in its immediate vicinity, what do you think it’s telling you?
Frank,
A kitchen infrared thermometer is typically used for objects with distances of a meter or less. Any radiance from atmospheric gases in those distances is absolutely trivial.
Most objects you want to measure radiate as graybodies with high emissivities (typically about 0.95). They radiate in the atmospheric window and on both sides of it. There is no need to limit wavelengths used to the window. (This is contrasted with devices meant to measure temperatures at long distances, where atmospheric radiance could be an issue.)
Of course, pyrgeometers do not want to limit themselves to the atmospheric window, becasue they are interested in wavelengths outside of the window.
The global warming theory?
If the greenhouse gases in the atmosphere increase, the temperature rises.
If the greenhouse gases in the atmosphere decrease, the temperature drops.
https://myedspace.co.uk/myresources/gcse/physics/aqa/revision-notes/ir-radiation-and-temperature-triple-only
If greenhouse gases are compared to a battery.
The battery emits a constant amount of energy during the day and must be charged every day.
If the battery is larger, does the battery emit more energy because it is larger?
If the battery is charged with more energy, does the battery emit more energy because it contains more energy?
If the battery is charged with less energy, does the battery emit less energy because it contains less energy?
The behavior of greenhouse gases.
If greenhouse gases are charged with more energy, the temperature of the greenhouse gases rises and the greenhouse gases emit more IR radiation.
If greenhouse gases are charged with less energy, the temperature of the greenhouse gases decreases and the greenhouse gases emit less IR radiation.
https://optris.com/knowledge-library/plancks-law/
Is Planck’s radiation law a temperature control mechanism that regulates the temperature?
If the temperature rises, the greenhouse gases emit more IR radiation.
If the greenhouse gases emit more IR radiation than is supplied from the sun in a day, the temperature decreases.
Greenhouse gases cannot emit more IR radiation than is supplied from the sun even if the amount of greenhouse gases increases.
The storage capacity of the atmosphere is controlled by the density of the atmosphere.
The density of the atmosphere is controlled by the high-pressure and low-pressure systems.
Mas handwavium.
Plank observed that for heat radiation to interact w stuff requires comparable dimensions.
Short-wave, high-energy X-rays & cosmic waves are comparable in size to molecules and tear them apart.
Longer lower energy UV waves displace electrons and cause fluorescence.
Visible lights waves are, well, visible.
LWIR waves are too long to interact at the molecular level.
Stand under an IR heater at HD garden check out.
IR waves heat stuff and not the air.
Yeah, like convection ovens?
Heating elements heat the air, air heats the stuff.
“LWIR waves are too long to interact at the molecular level.”
“Stand under an IR heater at HD garden check out.
IR waves heat stuff and not the air.”
CO2 is demonstrably a GHG and as it is present in the atmosphere – well wud yer know it? ….
There you go
“…CO2 is demonstrably a GHG..”
Links to that demonstration?
Err, it’s in my post.
Like the words in red!
I have read that 35% of direct solar IR warms the atmosphere directly. Is this wrong?
The Sun heats the ground, the ground heats the air.
Find a USCRN or SURFRAD location with lots of clear skies & very little albedo.
Compare the ground level solar W/m^2 to ToA.
If the atmosphere were absorbing energy the ground would have lower numbers than ToA.
Heating of particulates maybe or physical water drops.
Atmosphere absorbing IR? I don’t think so.
“Greenhouse gases trap 70% to 90% of this ground heat, which is the primary driver of atmospheric warming.”
No, they don’t “trap” anything.
At 0.04% they would be white hot dots.
0.016 C/y is hardly warming.
So, refute this.
Earth is cooler w atmos/water vapor/30% albedo not warmer.
Ubiquitous GHE balance graphics don’t + violate GAAP & LoT.
Kinetic heat transfer processes of contiguous atmos molecules render “extra” GHE energy from a BB surface impossible.
GHE = bogus & CAGW = scam.
If even one of these holds all the other GHE topics become pointless noise.
Is the grass on the ground warmer than the air above the grass?
Is the ocean warmer than the air above the ocean?
Gases are not Black bodies and do not emit based on temperature.
31 deg vs 30 deg:
(303/304.)**4 = 0.986
Not quite “black”.
You should probably account for that with 51 deg. too.
Great article.
What I see is that “downwelling” IR never exceeds “upwelling” IR over a 24 hour period. The reverse is true.
Therefore, “downwelling” IR is INCAPABLE OF HEATING the atmosphere (or, more to the point, the oceans, which is the primary “heat sink” with much more heat capacity than air).
ONLY THE SUN does that.
Oh, and the only thing that makes “downwelling” IR close to “upwelling” IR is MOISTURE. Clearly showing WATER VAPOR as the driver of the “greenhouse effect,” while showing CO2 to be inconsequential. And further the “greenhouse effect” doesn’t operate as they say it does (“trapping heat”) since the “total” IR “flow” is OUTWARD, not inward.
“Climate change” is clearly NOT driven by the 1/100th of a percent of CO2 added to the atmosphere. Nor by the “greenhouse effect” in totality.
Upwelling BB = Downwelling “back” + duplicate Net
Upwelling BB is not possible.
All of this is fantasy.
Engineers use warm body EM emissions regularly in thermal management designs for electronic (and other) components.
Engineering materials sciences has measured the characteristics, including thermal resistance/conductance, specific heat capacity, reflectivity (not albedo), and emissivities.
The ground can and does emit EM energy skyward.
The over simplifications you so rightly criticize fail to account for conservation of energy.
In stead of studying the nuances of a highly complex energy system, too often the effort is to over simplify it so it can be spoon fed to non-critical thinking beings.
A lot of spherical geometry is ignored.
The whole exercise over the past 50 years has been to prove CO2 is the control knob and IR EM energy is “heat” “trapped” by CO2. It has required hijacking and redefining terms like thermalization and albedo to align with the desired results. It required creative modelling to prove “vibration modes” applying Newtonian physics at the molecular level that is almost universally disapproved of.
Worst, is those fellows that agree the IPCC and company are wrong, continue to use their Trans-Reality Alarmist (TRA) lexicon and every time “greenhouse gas” is used, it gives unearned, unintentional credibility boosts to the TRAs.
Control the language, control the ideas.
“The ground can and does emit EM energy skyward.”
True, not as a BB but in concert with the kinetic processes.
Qground = conduction + convection + advection + latent + radiation = 100%
emissivity = radiation / 100%
Because of the significant (60% per TFK_bams09) non-radiative, i.e. kinetic, heat transfer processes of the contiguous participating atmospheric molecules the surface cannot upwell “extra” energy as a near Black Body.
EVIDENCE:
As demonstrated by experiment, the gold standard of classical science.
For the experimental write up see:
https://principia-scientific.org/debunking-the-greenhouse-gas-theory-with-a-boiling-water-pot/
Search: Bruges group “boiling water pot” Schroeder
The equation for radiative transfer is
Δu = u – u 0 = eσA [Thot ^4-Tcold^4]
The mosaic that makes up “the sky”…cloud bottoms, a bit of outer space showing through water vapor and CO2 is colder than the surface…..so yes, heat flow is generally “upwelling” and in keeping with the laws of thermo….but those downwelling photons from sky to surface….DO reduce the number of “upwelling” photons that can get to the huge -270K photon sink of outer space…so your view is sorta correct….downwelling can’t “heat” the surface…but it can reduce the rate at which the heat of yesterday’s sunlight can be released to outer space today….
Your equation is missing some terms.
Your abbreviated version is the work required to remove energy from a single area to change its temperature from Thot to Tcold.
It is not “net” energy.
‘The equation for radiative transfer is…’
Is applicable to ‘bodies’, not atmospheric gases.
It’s still makes the point….another deflection attempt to hide erroneous logic.
Your photon cartoons appear to be 100% efficient, in = out.
Not reality.
Moving electrons out of orbit takes a minimum amount of energy, i.e. the work function.
The out photon must be lower energy and longer wavelength.
It shortly dissipates like the diminishing sound of a rung bell.
It’s entropy, ya know.
“.. and yes, even the thing that a few people say has never been demonstrated, downward LWIR flux commonly known as the greenhouse effect ..”
Nonsense, if you measure enough, at many enough locations you’ll find whatever your narrative wants you to find.
When we’re talking about GLOBAL—anything, local, over short distance, under the “right” conditions—measurements showing some kind of magic—FINALLY! Doesn’t prove anything except dishonesty!
WUWT is starting to sound too alarmist (as in dishonest and misleading!).
There is no “back” downwelling without BB upwelling and there is no BB upwelling.
I got to Appendix A and walked away.
That presentation is rife with unstated assumptions and is, in fact laced with pseudo-science created to “prove” CO2 “traps heat” from IR.
I came back and reread. The instrumentation and data recorded are interesting, but raise a few question. Having reread Appendix A, my impulse to leave is high so I will not ask.
Except, where is the analysis of alternatives?
Where is the null hypothesis proposed and or tested?
Kevin,
You are getting close to understanding. I explain your misinterpretation of our statement below.
What we state is not that the spontaneous emission of radiation by an individual molecule in the lower atmosphere is not possible, it is that the transport of energy via radiation in the lower atmosphere is not possible.
Spontaneous emission that does not escape to space is not energy transport.
This must be considered on a line-by-line basis. Each spectral line has its own emission altitude. This occurs when the atmospheric density is sufficiently reduced that re-absorption of the radiation does not occur, AND the non-radiative deactivation (thermalization) rate is lower than the spontaneous emission rate which is derived from the Einstein A coefficient. This is where energy is actually transported to space, cooling the atmosphere.
That is why the discussion in the paper explains non-radiative excitation as well.
What you refer to as a “sea of photons” is what I have referred to in prior correspondence as the “equilibrium radiation field generated by the atmosphere”, LTE implied. “Photons” are a convenient bookkeeping tool in some circumstances, but they are not little packets of light energy that zoom past each other in opposite directions
Radiance can be measured in the atmosphere from any direction because the LTE field including some spontaneous emission has components in all directions. The vector radiative energy flow at a point is the integration of the vector radiance over a sphere surrounding that point. It always points in a single direction, upward from the surface in the case of the Earth’s atmosphere.
Once absorption and thermalization occur near the surface (a process that cools the surface) there is a continuous process of energy transformation in the lower atmosphere dominated by collisional excitation and de-excitation, with a radiation field that is in equilibrium with the kinetic energy.
This is not due to Kirchhoff’s law which assumes only radiation and emission and applies to condensed matter. It is explained by Einstein in his Quantum Theory of Radiation (1917). The radiation field aligns with Kirchhoff’s law because it is the field consistent with LTE.
Herman Harde (2013) demonstrated this in his paper and showed that deriving the radiance field using a collisional model based on Einstein 1917 results in the Schwarzschild RTE.
Harde recognized that these collision processes take place throughout the atmosphere up to the mesopause. That is why the CO2 Q-branch peak at 667/cm with its long radiative lifetime does not emit to space until it is an altitude of ~83 km as shown by van Wijngaarden and Happer in more than one of their papers.
Tom,
This is a good addendum to the “Missing Link” article. Btw, I have a print out from one of your notes elsewhere wherein you sparred with ‘Perplexity’ re. the difference between ‘radiance’ and energy transfer. I can’t seem to recall the source, so would be grateful if you could provide a link to it here.
Tom, that is a very convoluted way of stating that 25 micron IR doesn’t go far in the atmosphere at sea level, but will at 83Km, where there isn’t much atmosphere nor water vapor for the photons to strike, while neglecting other wavelengths that get all the way to outer space from surface through the atmospheric window, 8-14 microns. I am not a fan of the “emission altitude” methodology because of this negligent treatment of the atmospheric window. Much conceptual cherry picking can go on…
‘…while neglecting other wavelengths that get all the way to outer space from surface through the atmospheric window, 8-14 microns.’
They don’t. If you look at their article, it’s very clear that they’re addressing the treatment of LWIR that falls outside of the atmospheric window. This is the reason why I always ask people, who defend the canonical concept of ‘back radiation’, to provide details of what they include in the definition.
Shula and Ott https://youtu.be/nvakBfl4pNU?si=mJl5b7_feXSadY2G. At
14:40 their video states:
“The irreversibility of radiation absorption in air under convective conditions makes back radiation and thus the greenhouse effect impossible”
A few seconds later they refer to a graph clearly showing downwelling IR, which IS the back radiation.
This leaves me with the impression that they aren’t serious scientists. And sure enough, one is a Masters degree computer hard drive designer, and one is a pharmaceutical PH.D guy where all heat transfer is by shell and tube exchangers with zero by radiative transfer…. So they are much less qualified than they think and confused between HEAT, and EMR which isn’t heat until absorbed, like a microwave oven…
The quotation from Ott’s video is perfectly consistent with Shula’s comment, above. As for the graph, it’s not their graph, but one that was produced by someone who most likely presumes that your canonical understanding of ‘back radiation’ is correct.
Again, for the zillionth time, we are given absolutely no information about how much of the 300 – 400 W/m^2 of the so-called ‘back radiation’ that was displayed in the graph comes from within the atmospheric window, e.g., radiation scattered by clouds, versus how much of it is simply the radiance of GHG molecules in the immediate vicinity of the instrument.
(Maybe you don’t know either, but if that’s the case, you should lay off NS the next time he mentions that the 333 W/m^2 number in Trenberth’s EEB diagram is a meaningless number).
Finally, you should also lay off the ad hominem a bit. I believe Shula was working towards obtaining a PhD in physics, but decided he’d be better off working in technology. As for Ott, I believe he has a PhD in chemistry, which I presume means he knows something about spectroscopy and thermodynamics.
I worked with and employed several Ph.D’s over the years…intelligent men all…not always right about things outside of their field of study.
…and often wrong about things within their field of study.
I want people to conceptually understand “back radiation” so I won’t be laying off of NS and his misinformation mongering.
‘I want people to conceptually understand “back radiation”…’
How about defining it first? Again, how much of the so-called ‘back radiation’ that has supposedly been measured comes from within the atmospheric window, e.g., radiation from water droplets, ice particles and other forms of condensed matter, and how much of it is simply the radiance of GHG molecules in the immediate vicinity of the instrument?
Thank you Frank. Correct on both counts.
You can believe what you want, thinking you know everything about my acumen/expertise based on reading a social media profile or whatever. A “reverse appeal to authority” perhaps?
The real problem with this forum is people whose minds are locked like bank vaults and are unable to consider alternative perspectives.
I am slowly coming to accept that posting here is a waste of time. It is the world’s most viewed climate site, but also the most confused.
“…minds are locked…”, yes especially those who don’t “get” the so-called “back-radiation” and try to make it a very complex thermodynamics mistake.
It is not a thermodynamics mistake. It’s a lack of understanding by most of what radiometric instruments measure. There is no instrument in existence that can directly measure radiative energy flow in real time at a point in space.
I agree, it’s not a thermodynamics mistake. Not sure what you are getting at with the “point in space”…we measure at surfaces…
I think he means no one has invented a Poynting meter.
What is typically measured is radiance, the radiometric equivalent of luminance. You can think of it as the “apparent brightness”. The detectors we use are effectively “points” in space and we measure that vector quantity coming from a specific direction.
All detectors have a limited field of view. In order to calculate the vector radiative energy flow at a point, one must vectorially integrate the incoming vector radiance from all possible directions, as noted by Planck in 1908.
The mathematical form of this integration appears in at least one of van Wijngaarden and Happer’s papers, though it is not original to them. These forms assume a certain symmetry, and the integrals are broken into “upward” and “downward” components because the boundary conditions are different.
It is a mathematical convenience. There are not separate energy flows in opposite directions.
‘I am slowly coming to accept that posting here is a waste of time.’
That would be an unfortunate outcome. Consider that It wasn’t too long ago that ‘the science’ had us queuing up in food market parking lots, wiping down food containers with bleach solutions, etc. One would be hard pressed to find anyone defending that science today.
“The implied ground temperature is now 59C, far above the 2m air temperature of 39C.”
138.2 F & 102 F.
Not a problem.
We know the hood of a car can exceed 140 F while air temp is 80 or 90 F.
That’s why the difference between 2m “surface” and actual ground temperature is critical.
Sun heats ground, ground heats air.