Richard Willoughby
Summary
This article analyses long-term changes in tropical solar energy arising from orbital precession and their role in driving atmospheric moisture, poleward heat transport, and global temperature evolution. It indicates that increasing tropical solar exposure enhances convective energy throughput, amplifying total precipitable water (TPW), poleward heat export, and ocean heat retention outside the tropics.
The purpose of this analysis is to examine whether changes in tropical solar exposure are consistent with observed changes in atmospheric moisture and heat redistribution.
This analysis does not indicate any trend in global solar forcing, but rather, examines how changes in the timing and geographic distribution of tropical solar energy affect the operation of the convective climate system.
Precession of Perihelion
The current precession cycle that defines the Holocene epoch resulted in perihelion first re-aligning with the December solstice in 1143AD with zenith solar declination at 23.55S. Perihelion regularly aligned with the December solstice till 1345 when zenith declination was 23.52S. Accordingly, 1255 was selected as the base year for this analysis because it was close to the middle of the period as well the December solstice and perihelion being concurrent. Zenith declination was 23.53S in that year with intensity of 1409.2W/m².
The daily average solar intensity was calculated over the period from 1200 to 1500 to produce a cumulative anomaly relative to 1255. Chart 1 shows the result.

The 2nd order trend line indicates that 1255 is indeed very close to the bottom of the solar energy available over the tropics in the present precession cycle. It is important to observe from the chart that 1255 is closely aligned with reversal of the available solar energy in the tropics. However, the varying thermal response of elements in the climate system and changing solar intensity preclude any state of thermal equilibrium at any point in time. So 1255 simply represents the most likely year that the trend in tropical solar energy reached an inflection. In 1255 the Equator was the furthest it will be from the Sun in this precession cycle when the Sun is directly over the Equator. The Sun-Earth distance at both March and September equinoxes were almost the same. For the next 5,000 years, the Sun-Earth distance at the March equinox will reduce till perihelion is concurrent with the March equinox during the 7th millennium.
Base Case Top of Atmosphere Solar Intensity and Solar Energy
The calculation of average daily solar intensity is based on orbital data from NASA/JPL. The calculation provides the daily average top of the atmosphere (ToA) solar electro-magnetic radiation (EMR) available to heat Earth’s atmosphere and surface. Not all EMR is thermalised. Some is reflected but this analysis is based entirely on what solar EMR is available at the top of the atmosphere. Image 1 provides a pictorial display of the available average daily solar EMR across the tropics from 30S to 30N. The image is a 60X365 color coded matrix.

The solar intensity ranges from 207W/m² up to 497W/m². The boundaries between the warmer and cooler zones are shown at 425W/m² as this has been observed as the ToA intensity required to produce convective overshoot that marks the transition to cyclic convective instability that gives rise to deep convection and resulting monsoon.
The Present Era
By 2024, perihelion was some 12 days later than the December solstice when zenith declination had reduced to 22.89S. This small change in timing of perihelion and declination at perihelion has a noticeable change on the distribution of solar intensity and the overall available energy as shown in Image 2.

The daily average solar intensity in 2024 ranged from 208W/m² to 497W/m². The changes compared with 1255 are easier to observe by looking at the differences per Image 3.

The top panel color codes the daily difference in solar intensity across the tropics. The greatest increase is at 30N in April and the greatest decrease is also at 30N but in October. The annual energy available has increased by almost 4 ZJ across the tropics based on these calculations, with approximately half of this change attributable to orbital precession, reducing obliquity and reducing eccentricity.
The lower panel of Image 3 displays the zones that are now above 425W/m² but were not in 1255 and those now below 425W/m² but were in 1255. The total annual area above 425W/m² has increased by 0.3%. The timing has changed noticeably as shown in the image. In 1255, there were two distinct period of monsoon with delays between hemispheric transition. In 2024, the Southern Hemisphere (SH) monsoon is still active when the Northern Hemisphere (NH) monsoon is commencing. This is most noticeable in the Indian Ocean and western Pacific by increasing ocean surface area reaching 30C in April with comparatively much lower area reaching 30C in October.
Note: The 425 W/m² threshold was derived empirically from ocean moored buoy observations by comparing sustained daily-average ToA solar input with the onset of persistent deep convection and associated SST behaviour near 30°C. The moored buoy at 15N 90W in the Bay of Bengal provides the best observing platform for cyclic deep convection due to this region sustaining above 425W/m² for typically 157 days in the present era. Globally, 425W/m² is observed as an inflection point in ocean surface temperature where the temperature peaks. ToA solar intensity above that level is associated with declining surface temperature per Chart 1A.

Chart 2 gives insight into why the NH is experiencing similar solar energy to the SH despite higher peak solar intensity and higher maximum daily average in the SH. In 1255 the Sun zenith transitioned to the NH on day 80 then transitioned to the SH on day 267. So the Sun zenith was over the NH for 187 days and the SH for only 179 days.

Chart 3 shows how the solar intensity has changed at 30S and 30N from 1255 to 2024.

The NH is undergoing much larger changes in solar intensity than the SH. There is a significant increase in March and April solar intensity but a significant reduction in September and October. NH overall has a slight increase in average. The SH has almost identical increase in average sunlight but it is more evenly spread through the autumn and winter months and a small reduction in October – November sunlight.
Increased Sunlight & Atmospheric Water
There have been global satellite measurements of total water column since the late 1980s. Chart 4 provides the yearly difference in total precipitable water (TPW) over oceans for 2024 using 1990 as the base.

The increase of 2.3mm over half the area of the globe would require 1.4 ZJ for evaporation. Chart 5 shows the cumulative difference in solar energy input taking 1990 as the reference year rather than 1255.

As shown, the cumulative tropical solar energy above the 1990 level is 28 ZJ. That is 20 times more than the latent heat that is required to increase the atmospheric water by 2.3mm. However, there are many factors that limit the uptake of the available energy and consequent increase in TPW; including:
- Regions that experience monsoon reject available solar EMR by producing reflective cloud. Little to no solar EMR above 425W/m² even enters the lower troposphere over open oceans due to reflection from high altitude cloud.
- Taking a base year as a reference should not presume that the system is in energy equilibrium in that year. It is obvious that energy equilibrium can never be the situation on Earth due to the continually varying orbit and changing solar activity in combination with vast array of thermal response and thermal lag of all the elements that form the climate system.
- Getting moisture into the atmosphere in the tropics requires much more energy than the latent heat. Increasing the TPW requires additional sensible heat for atmospheric expansion beyond the latent heat of evaporation, increasing the total energy requirement well beyond the latent heat for a given TPW change.
- Once the moisture is in the atmosphere it increases absorption of solar EMR and long wave radiation so sensible heat increases to maintain or even reduce relative humidity and the higher energy atmospheric column can then transport more heat poleward. Moisture increase in the tropics also causes moisture increase at higher latitudes that reduces heat loss from the oceans in the mid latitude due to precipitation supressing evaporation.
The increasing robustness of transition from SH monsoon to NH monsoon is particularly noticeable in the increasing trend in area of Ocean surface reaching 30C in April and then the increased monsoon activity that follows in July. July is the month of greatest tropical moisture increase and is most apparent just north of the Equator per Chart 6 where the increase in TPW is 9 mm in July 2024 wrt July 1990.

This highlights that the climate response is controlled by how energy is processed within the convective system, rather than just the absolute magnitude of solar input alone.
Precession in the Future
The two following Images 4 and 5 are previews of the changing solar intensity and annual energy available over the tropics early in the next millennium and the 10th millennium when zenith at perihelion will be well north of the Equator.

In 3065, perihelion solar intensity will be 1408.2W/m² and occur over 19.88S. The solar intensity at 30N in March will be 10.4W/m² above 1255 and 5W/m² above current level. Solar intensity at 30N in September will be 10W/m² below the level in 1255. The available solar energy over the tropics will be 6.8 ZJ above the 1255 level. The SH has lower solar intensity in summer and higher in winter, but the atmospheric moisture will still be increasing due to the increase in tropical solar energy.

The zenith at perihelion moves north of the Equator in the 7th millennium and the zenith will be over 16.12N at perihelion in 9038. By then there will be noticeable changes in the monsoon with it increasing in both time and extent in the NH. The largest change in solar intensity will then be at 30S; down by 27.8W/m² relative to 1255. It is interesting that the available solar energy will continue to increase due to the eccentricity of the orbit reducing as well as obliquity reducing. The zenith solar intensity at perihelion will be down to 1400.2W/m².
By 9038, the extremes in solar intensity will be greater in the NH than the SH but still well short of what is currently experienced in the SH.
Overall, orbital evolution continues to cause upward trend in tropical energy availability through increase in total energy and changes in seasonal distribution, rather than large increases in peak intensity or total energy.
Discussion
Tropical solar energy is a key climate variable – The climate system is driven by the tropical energy surplus. Net solar input is greatest over low-latitude oceans, and this excess energy drives atmospheric and oceanic heat transport toward higher latitudes. The relevant climate solar forcing is therefore not global mean radiation, but the area and duration of tropical ocean exposed to solar flux sufficient to trigger persistent cyclic deep convection that powers the circulation system. The analysis shows that this tropical solar exposure has increased since perihelion and the December solstice were aligned in 1255, which is used here as the baseline. This represents a small direct increase in available tropical solar energy and more significant changes in spatial and seasonal exposure while global mean flux only changes in line with solar activity.
Convective threshold and SST regulation – Observations from ocean moored buoys indicate that sustained tropical convection develops when daily-average ToA solar flux exceeds ~425 W/m² for sufficient time for surface temperatures to reach ~30 °C. Once this threshold is maintained, evaporation accelerates, deep convection initiates, and atmospheric moisture increases. At this stage, further energy input does not produce unconstrained SST rise. Instead, convective regulation dominates.
This regulation is associated with convective overshoot once surface temperatures exceed ~30 °C, leading to the formation and persistence of micron-scale ice particles in the upper troposphere, increasing shortwave reflection. Together with enhanced evaporation and latent heat export, this acts as a strong regulatory process limiting further SST increase while maintaining high energy throughput. Deep convective overshooting injects moist air into the very cold upper troposphere, where rapid freezing produces large numbers of micron sized ice crystals that are detrained into cirrus anvils and above-anvil plumes, forming persistent high-altitude ice clouds. Cyclic deep convection operates below the onset of convective overshoot, which is often observed when regional deep convection is initiated causing daily average outgoing long wave radiation to drop as low as 130W/m² and daily average reflected short wave to increase by ~200W/m². The net effect is a reduction in short wave radiation reaching the surface so the surface cools.
Increased TPW as the primary amplification response – The first-order response to increased tropical solar energy is increased evaporation and total precipitable water (TPW), rather than SST. Rising TPW increases energy throughput in the convective system by enhancing latent heat transport and contributing to cloud-radiative processes. The consequence is most apparent in July, as shown in Chart 6. Increasing TPW is therefore a direct indicator of increasing tropical energy processing, rather than simply a by-product of temperature change.

Heat export and ocean heat retention – The tropics act as a heat source region rather than the primary heat storage region. Once energy enters the convective regime, heat is exported via atmospheric circulation, with latent heat released at higher latitudes. Ocean heat retention consequently increases preferentially outside the tropical source region.
This is consistent with the pattern observed in Chart 7, which shows enhanced ocean heat retention in the latitudes of the Ferrel cells during the ARGO era. These regions represent zones of moisture convergence, condensation, and reduced ocean convective heat rejection, meaning heat can be more effectively retained within the ocean system.

Increased precipitation associated with elevated TPW contributes to this process by enhancing near-surface freshening and stratification. This promotes strengthening of upper-ocean barrier layers, which can suppress vertical mixing and reduce heat exchange between the surface mixed layer and the thermocline. The result is a tendency toward increased heat retention in mid-latitude regions, even while the tropics remain strongly regulated by atmospheric deep convection.
Further Studies – The developing asymmetry of monsoon transitions based on observation of solar intensity above 425W/m² and increasing area of ocean above 30C in April give rise to questions yet to be answered conclusively that are consistent with the shifting monsoon.
Observations over the Indo‑Pacific warm pool show that the SH→NH transition is generally coherent, with convection expanding northward from the warm pool into the developing Asian monsoon. The reverse NH→SH transition is markedly less stable, with convection shifting between hemispheres, observed double‑ITCZ states, and rapid changes in the dominant convective centre. This asymmetry reflects a stable buildup phase in the NH versus an unstable decay phase, as competing convection from the Indian Ocean, western Pacific, and Atlantic warm pool reorganises the Walker circulation. Because this occurs across the core El Nino-Southern Oscillation (ENSO), the unstable NH→SH transition provides a natural mechanism for perturbing trade winds and convection, potentially contributing to Pacific oscillation variability.
Conclusions
Common Wisdom – The prevailing view within the scientific community is that total solar forcing is approximately constant and that tropical insolation changes are primarily redistributive rather than amplifying. However, this framing underestimates the importance of both long-term changes in available solar EMR and non-linear behaviour in tropical convection. Even modest changes in tropical solar exposure can alter evaporation, total precipitable water (TPW), atmospheric absorption of short wave and long wave, cloud-mediated shortwave reflection, and poleward heat transport. The critical variable is therefore not global mean available solar EMR, but the extent and persistence of tropical regions operating within the convective regime.
The Warming Trend – The observed warming is not uniquely a recent phenomenon but is consistent with a longer-term evolution linked to changes in tropical energy availability. Long climatological records and proxy evidence show multidecadal and centennial trends extending well prior to the modern era, while satellite observations show a sustained upward trend with substantial variability, rather than a response dominated by recent acceleration.
This behaviour is consistent with a system responding to gradual changes in tropical solar exposure and increasing convective energy throughput. As tropical regions more frequently exceed the convective threshold, additional solar input is not expressed as unrestricted surface warming, but is redistributed through enhanced evaporation, increased atmospheric moisture, increased short wave and long wave atmospheric absorption, cloud-mediated shortwave rejection, and poleward heat transport.
The resulting response is structured warming in which energy is redistributed and retained outside the tropical source region. Variability is superimposed through solar variability and internal circulation dynamics, rather than representing a purely recent or step-change forcing. With this insight, the modern temperature record is best interpreted as the current phase of a longer-term response to evolving tropical solar energy and its amplification through moisture transport and convective heat export.
Physically Consistent – These observations provide a physically consistent explanation for the observed separation between tropical energy input and mid‑latitude heat retention. They reinforce the role of the tropics as the primary control region of the climate system and highlight the importance of convective regulation and moisture-driven heat transport in shaping global climate evolution.
Data Sources and Methods
All datasets are publicly available through NASA, NOAA, and international observing system portals, ensuring reproducibility. The author acknowledges the contribution of the USA Government and the supported scientific community in producing the data and making it publicly available.
Orbital and Solar Geometry – Orbital parameters and Earth–Sun geometry were taken directly from the NASA Jet Propulsion Laboratory (JPL) ephemeris system (NASA JPL, 2025). The JPL Horizons database provides high-precision time-dependent values for heliocentric Sun-Earth distance and solar declination and Sun velocity vectors. All data used had a time increment of one day.
Solar Irradiance and Solar Activity – Solar irradiance variability was inferred from the square of the Sun orbital velocity variation from its average with a 2.4 year phase shift and validated against SORCE project TSI measurements. TSI measurements indicate variability range on solar-cycle timescales of approximately 0.2%, which is noticeable over decadal periods but less significant over millennial trends.
Computation of Daily Mean Insolation – Daily-mean solar radiation at the top of the atmosphere (ToA) was calculated using established solar-geometry relations (Berger, 1978; Hartmann, 1994). The instantaneous solar flux is expressed as:

where is the solar constant, is the instantaneous Earth–Sun distance, and is the solar zenith angle (Hartmann, 1994).
The zenith angle is given by:

where is latitude, is solar declination, and is the hour angle (Hartmann, 1994).
Daily-average insolation is obtained by integrating the instantaneous flux over the daylight period defined by the sunrise and sunset hour angles. The formulation follows the analytical solution presented by Berger (1978), which provides a complete framework for calculating daily insolation as a function of orbital parameters and latitude.
Tropical Solar Energy Calculation – Daily-average ToA solar intensity was calculated for each day of the year across the latitude band 30°S–30°N at 1-degree intervals. The resulting dataset is a latitude–time matrix of daily ToA solar radiation. Annual energy was obtained by integrating the daily flux over the area at each latitude for each year with all years taken as 365 days to avoid the step introduced by an extra day every 4 years. The start day of the year is not always January 1st. Rather it is the nearest whole day based on a year having 365.2422 days. This reduces annual variation that results from using 3 X 365 day years and 1 X 366 day year. (A problem observed when integrating the CERES ToA monthly sunlight data over a year)
Validation Against Satellite Observations – The calculated ToA solar radiation fields were validated against satellite observations from the NASA CERES (Clouds and the Earth’s Radiant Energy System) dataset (Loeb et al., 2021). CERES provides globally observed shortwave and longwave radiation fluxes at the top of the atmosphere.
Comparison of calculated and observed fields confirms that the calculation reproduces the spatial distribution and seasonal variability of incoming solar radiation within expected uncertainty bounds, supporting the validity of the applied methodology.
Atmospheric Moisture (Total Precipitable Water) – Total precipitable water (TPW) data were obtained from satellite-based microwave radiometer datasets (Wentz et al., 2007; RSS, 2022). These datasets combine measurements from SSM/I, SSMIS, AMSR‑E, AMSR‑2, and WindSat instruments to produce a consistent global record of oceanic atmospheric moisture from 1988 to present.
TPW represents the vertically integrated atmospheric water column and serves as the primary diagnostic of moisture response to changes in tropical solar energy.
Ocean Heat Content – Ocean heat content (OHC) data were obtained from NOAA Climate Data Records and Argo float observations (Levitus et al., 2012; Johnson et al., 2015).
The Argo program provides a global array of profiling floats measuring temperature and salinity throughout the upper 2000 m of the ocean, enabling high-resolution estimates of ocean heat retention and distribution. These datasets were analysed to identify latitudinal variations in ocean heat retention.
References with Active Links
Orbital and Solar Geometry
- NASA Jet Propulsion Laboratory (JPL). Horizons System Ephemeris Database.
Access Horizons System
Solar Radiation and Insolation Theory
- Berger, A. L. (1978). Long-term variations of daily insolation and Quaternary climatic changes. Journal of the Atmospheric Sciences, 35, 2362–2367.
View Berger (1978) paper - NASA GISS (2020). Solar radiation calculation methods (ModelE).
View NASA GISS insolation documentation - Hartmann, D. L. (1994). Global Physical Climatology. Academic Press.
(Foundational reference; no direct link provided in source results) - Rose, B. E. J. (University at Albany). Insolation and solar geometry notes.
View insolation calculation notes
Solar Irradiance
- NASA Earth Science Division. Solar Irradiance Science (TSI datasets).
View solar irradiance overview
Radiation Budget (Satellite Observations)
- NASA CERES (Clouds and the Earth’s Radiant Energy System).
Access CERES data and products - CERES EBAF Dataset (TOA Radiation Climate Data Record).
View CERES EBAF dataset description
Atmospheric Moisture (Total Precipitable Water)
- Remote Sensing Systems (RSS). Microwave Total Precipitable Water Dataset.
Access RSS TPW dataset - NASA Earthdata (GHRC DAAC). Merged Microwave TPW Dataset.
View NASA TPW dataset description - NOAA NCEI. SSM/I–SSMIS Hydrological Products.
View SSMI/SSMIS dataset overview
Ocean Heat Content
- NOAA NCEI. Global Ocean Heat Content Climate Data Record.
Access NOAA OHC dataset - Argo Program (Global Ocean Observing System).
Access Argo data portal
Supporting Climate Data Resources
- NOAA Climate Data Records (CDR).
Explore NOAA CDR datasets - UCAR Climate Data Guide. Ocean datasets overview.
View ocean climate dataset guide
Hemispheric Monsoon Transition (Observations)
- Wang, B. & Ding, Q. (2008). Global Monsoon: Dominant mode of annual variation in the tropics.
→ View Global Monsoon paper - Gu, G., Adler, R. & Sobel, A. (2005). The Eastern Pacific ITCZ during the Boreal Spring.
→ View Journal of Atmospheric Sciences paper - Satiadi, D. et al. (2023). Study of ITCZ movement and cross‑equatorial behaviour.
→ View ITCZ movement study - NOAA. Intertropical Convergence Zone (ITCZ) overview.
→ View NOAA ITCZ description - NASA GPM. Observed precipitation structure of the ITCZ.
→ View NASA ITCZ observations
Tropical Moored Buoy Observations
- McPhaden, M. J. et al. (2023). Global Tropical Moored Buoy Array overview.
→ View Oceanography Society paper - NOAA. Global Tropical Moored Buoy Array (TAO/TRITON, PIRATA, RAMA).
→ View NOAA buoy system overview - NCAR Climate Data Guide. Tropical Moored Buoy System.
→ View buoy array description - NOAA NDBC. Tropical Atmosphere Ocean (TAO) buoy array.
→ View TAO data portal
Convective Overshoot & Ice Particles
- Lee, K.-O. et al. (2019). Convective hydration in the tropical tropopause layer.
→ View ACP TTL observations paper - Heymsfield, A. et al. (2005). Homogeneous ice nucleation in deep convection.
→ View JAS microphysics paper
The Author
Richard Willoughby is a retired electrical engineer having worked in the Australian mining and mineral processing industry for 30 years with roles in large scale operations, corporate R&D and mine development. A further ten years was spent in the global insurance industry as an engineering risk consultant where he developed an enduring interest in natural catastrophes and changing climate.
“This behaviour is consistent with a system responding to gradual changes in tropical solar exposure and increasing convective energy throughput.”
You don’t show that. There are virtually no time series at all. But it is very implausible. We have experienced very rapid warming since 1970. The perihelion cycle you speak of has a period of 21000 years. The time scales just can’t match. If present warming (2-3 C/century) is natural in this way and will persist for 5000 years or so, it will get very warm indeed.
You indicate gradual warming since 1200, and suggest modern warming is part of that. What about that Little Ice Age?
Just over 0.2 degrees since 1958 (=1996/7) and probably statistically insignificant warming since the 30s/40s. Given we are still in a current peak, probably nothing much at all. Certainly nothing like 1000 years ago. Wake up and stop seeing what’s not there.
So rapid, eh?
It cannot persist because it is regulated to 30C. All that happens is more surface reaches 30C. You will see that state over part of the Mediterranean this month. And there will be flooding around the Med again this year. As something closer to a monsoon kicks in.
The increasing convective activity across the tropics drives more water into the atmosphere and then more precipitation follows. The land in the NH cools faster in September and October due to lower sunshine and that results in heavier snowfall.
Greenland is already gaining altitude above 2300m.
I put much more store in small but persistent changes to sunshine over the tropics driving climate change than minute changes in CO2.
Anyone with a scientific outlook would want to really unpack what I have presented because, once veridied, it means all the CO2 demonising is misplaced.
Ah! The thermometer-readers are a it again! RW tries to examine the complexities of energy variation and transport over multiple centuries, and NS complains that it doesn’t comport with his silly GAT calculation for the last half century. It doesn’t occur to him that his beloved GAT might not measure anything of interest.
Nick’s GAT is a figment of the imagination of certain Climate Alarmists.
Nick ignores the written temperature record that shows it was just as warm in the 1880’s and 1930’s, as it is today.
Nick is not alone: All Climate Alarmists ignore the written record because it does not fit their “hotter and hotter and hotter” narrative, and some skeptics ignore the written record, too. Why, I don’t know. Stupidity may be involved.
How can one call themselves a climate scientist/expert while ignoring the only real temperature data available, the written, historic, regional temperature records?
Ignore the real data, and makeup false data. That is the state of current-day climate science.
No climate crisis without fake data.
‘Ignore the real data, and makeup false data.’
Yes, with emphasis on the latter. I’d have more respect for the ‘GAT’ crowd if it wasn’t so obvious that all of their ‘adjustments’ have had the effect of cooling the past and warming the present.
That and, of course, the complete absence of evidence from the carbonate rock and ice core records that CO2 variability is the ‘control knob’ of the Earth’s temperature.
“experienced very rapid warming since 1970″
According to UAH, since 1979 we have experience 3 warming spike+ step El Ninos…
The energy for these comes from tropical ocean warming by the sun.
Apart from those, there is very little warming at all.
And of course urban and airport measured surface temperatures experienced warming..
World population has expanded rapidly in that period, especially urban areas.
And in many areas, weather sites have been corrupted, altered and manipulated as well.
As much as it pains me, I’m going to have to agree with Nick on this one.
If the oceans store energy during La Ninas and release it during El Ninos, then all that is happening is that a ramp function is being converted to a step function.
El Ninos do not create energy, they merely release the energy that was stored previously.
Do you have a working hypothesis as to why a step function would be more likely than a ramp function?
Could it be that a short pulse is carried forward in the average? You would expect that to be damped out at some point if it is just an artifact of averaging a time function – unless the pulses occur at a shorter interval than the averaging interval. Then the average would just keep stepping up over time.
It seems Gaia has a few tricks of her own dispite the cosmic wonders. There was a recent post about massive volcanic activities preceeding and during the Little Ice Age. Scientists suggested a hypothesis that volcanism was the major driving force of the global cooling …. Then we might consider the distribution of the wildflower Dryas octopetala. Maybe the late development of the Vashon Stade of Puget Sound glaciers from changed circulation patterns would be another. It’scomplicated — like the movie or the song, only more so.
This is just silly, John Cleese levels of silly.
The Earth has been around for 4.5 billion years. Animal life has been around for, what, 500 million, 800 million years? It hasn’t done anything close to that nonsense.
Hey, I got paid today! Boy, if that keeps up everu day for the next 5000 years or so, I’ll be richer than Rockefeller!
Grow up.
“You don’t show that. There are virtually no time series at all. But it is very implausible. We have experienced very rapid warming since 1970.”
We also experienced the same magnitude of warming in the 1880’s, and the 1930’s (see Phil Jones for this one).
We are not living in unprecedented times as you imply.
Nick, the Milankovitch hypothesis is, at best, incomplete. There are much faster natural cycles affecting climate. Many of those cycles repeat within a 3560-year interval. My evidence comes from multiple ice- and sediment-core datasets and also from solar activity reconstructions.
Nick, do you agree? Please note that I (and probably others) will take a lack of response as evidence that you do. If you don’t agree, please explain why. I’m truly interested.
This is from NGRIP.
This is a more heavily filtered reconstruction from GISP2, animated to make it easier to see what’s going on.
Junk science, at best. You have a long, unaccounted-for period of no correspondence after the depth of the Little Ice Age. How can you sell us such crap with a straight face?
No, Bob but it is data that conflicts with your own pet theory. You’re cherry picking one data point in one GISP2 reconstruction. Ice cores aren’t perfect.
I said that most cycles repeat in a 3560-year interval. Others only repeat in a 4627- or 7120-year intervals. These tend to be impulsive, not sinusoidal.
My pet theory? Whatever that is, it has nothing to do with my comment.
>>I simply expect you to notice and explain obvious outliers on your own.<<
Your mistake here is exactly the same kind of mistake as you made before with your other sunspot climate prediction plot, which also has a glaring gap at the end of the period that you overlooked while proclaiming it’s merits.
I think they call this ‘confirmation bias’.
It’s a shame, Bob. You’re the only one that came close to discovering that a long moving average of sunspot data correlated with temperature. Unfortunately for you, you didn’t understand what you were looking at.
The 99-year MA length is critical, and the length was also the key to understanding the involvement of the Jovian planets. We don’t know enough about the Sun, or even how it influences climate to explain this result, but the Jovian involvement is confirmed with the 3560-year result.
What gap are you talking about?
“You’re the only one that came close to discovering that a long moving average of sunspot data correlated with temperature.”
Came close? You can’t do much better than I did here years ago using the 109-year sunspot average, my SN-TSI model, and the 30-year sea surface temperature average to find the exact change over 120 years from 1890 to 2010.
Let’s see you do as well or better using TSI too.
“Unfortunately for you, you didn’t understand what you were looking at.”
You didn’t show that I didn’t understand what I was looking at.
“What gap are you talking about?”
You had a different graphic in the past, it was static.
Your new dynamic graphic has a big gap before 2025. There are earlier times of discrepancy as well. The old graphic had a gap after 2016.
All-in-all we are fundamentally talking about the same phenomenon, even though I found that the ocean holds 120 years of solar energy, not 99.
Why 109 years? What’s so special about that number?
It’s the number of years that best fits the 30-year HadSST3 average.
There is an 11-year lag. Adding the 11-year lag to 109 years = 120 yrs.
This is an average lag too. It is a longer lag when the ocean is colder and sunspots are lower, and vice versa.
This is why I don’t believe you understand what’s going on. You’ve optimized length in your model as a tunable parameter without understanding what the filter is doing to the sunspot data.
For example, one of four functions the filter performs is to attenuate the 11-year cycle. To do this it should be a multiple of 11-years in length. That said, the attenuation of the moving average filter doesn’t sufficiently attenuate the 11-year cycle, so the animation above has an additional 11-year notch filter convolved with the 99-year moving average, or rect filter.
The theoretically correct number based on Jovian orbits is 98.5 years, so 98-99 both work. 98+11=109. Your moving average is one 11-year cycle too long which diminishes accuracy for two of the other functions the filter performs.
Your filtering jibber-jabber is really of no interest to me at all.
I have no interest in Jovian orbits either. I could care less about whether my 109 year average fits your scheme or your animation.
I started here with a comment about your sketchy GISP2 graphic model but you diverted the whole discussion into your solar work which you then use to bash me, undeservedly.
The latest solar cycle’s influence which encompasses the 11-year lag period is very important to recent sea surface temperatures on top of what happened in the previous 109 years, making it possible to predict climate outcomes when combined with other information, something I have done successfully twice, during this and the last solar cycle.
My work is archived by LASP and the AGU – a predictive track record.
For me to sit here and see you tell me that ‘I don’t understand what’s going on’ is to me a sign of your sheer arrogance AND HUBRIS!
The fact is you are Mr. Johnny Come Lately on both solar and CO2.
4000 years of data is not enough to define a 3560 year cycle.
At a you need to have at least 2 cycles worth of data to even begin postulating that a cycle might exist. Especially when you don’t have a mechanism to drive that cycle.
By the time you have 5 to 10 cycles worth of data, you reach the point where you can legitimately say that there is a statistically significant chance that your cycle is real and not just an artifact of the data.
The animation shows 10,000-years of data, which is about the limits of the current inter-glacial period (Holocene).
Your point might be valid if I was trying to detect a single 3560-year sinusoid, I don’t believe there is one. The 3560-year interval contains a large number of faster, harmonically related cycles, the amplitudes and phases of which will be location dependent due to various heat-transport mechanisms. These faster cycles beat against each other, often resulting in rapid temperature changes.
I am yet to resolve the exact mechanism of solar activity but it is strongly associated with the tidal forces on the Sun spin.
The Sun spin is primarily pumped by the tiny influence of Mercury. The Sun spin approaches the 3rd harmonic of Mercury’s orbit. There is a small torque from the combination of the near resonant gravitational force of Mercury effectively applied to the displacement of the centre of mass of the Sun from its average due to the changing velocity of the Sun caused by the interplay of the larger planets. The Sun plasma is spinning around a core that is being accelerated and decelerated over the course of a solar cycle so the distribution of the Sum mass is not constant. Oblation probably plays a role but it is not required to get the change is centre of mass.
The solar activity is associated with turbulence due to differential tidal torque of layers of the Sun. The turbulence absorbs some of the tidal energy so prevents the spin from ever reaching synchronisation with Mercury. What I have found is that the Sun spin system has a lot of inertia and slow response because the tidal force associated with Mercury is very small. Therefore it has its own inherent response time of the order of 100 years. I am yet to quantify the spin system losses and close that loop.
However there are also many periodic cycles associated with the orbit of the larger planets that change the Sun velocity and just these provide a reasonable proxy for solar activity based on the range of solar activity being a function of the square of the difference in velocity of the Sun wrt to its average velocity.
I have plotted that result for a number of past and future cycles per attached. As you can see, this simple model produces SC26 as a big one. This model relies on nothing more than the JPL Sun vector data and a constant phase shift of 2.4 years.
From the perspective of important climate trends, the solar activity is in the category of noise. But it is primarily responsible for the increase in solar availability this century that will continue into the 2030s based on SC26 being on the big side.
This article concentrates on what is driving the underlying climate trend. And an important change occurred in the 13th century that is gradually having an impact that will result in tropical atmospheric moisture increasing for millennia.
Hi Richard,
Have you read my paper? I don’t discount the influence of the inner planets on sunspot cycles, but have observed that the Jovian planets have the greatest influence.
I don’t worry much about the sunspot cycle amplitude. I consider that to be one of Nature’s greatest head fakes.
I don’t know if the Jovian planets modulate solar activity, or they’re just a proxy for solar-internal resonances. I suspect it’s more of the later.
So we agree on the Sun being the main factor. Although I bring in Earth’s relationship as driving the long-term trend. I have not looked for the underlying cycles in my determination of solar activity using the Sun velocity method but that is easy enough to do.
The acceleration and deceleration of the Sun CoM each solar cycle is a consequence of the major planets while the spin is a consequence of Mercury in combination with the changing velocity. And it is during the acceleration and deceleration of the CoM that results in solar activity. That is the reason for the phase shift which I have just set at 2.4 years rather than getting into that detail for each cycle.
I can download say 10,000 years of JPL Sun vector data. Use that with the Velocity method to determine solar activity and then decompose the frequency components of the result. It will have something like a 19 year cycle dominating but there will certainly be longer cycles. Frequency analysis is a more robust method than curve fitting by observation.
I take the perspective that any climate change hypothesis that does not reproduce glaciation and de-glaciation is not very useful. So my focus is on long term trends and precession of perihelion is the dominant driver there.
My forecast for SC26 means that the entire CERES era to about 2040 will be an uptrend. So that is already part of relatively long cycle that is primarily solar activity driven with a very small underlying precession trend over the 40 years.
That’s an odd perspective. That said, in the paper I mention two different periods for the Jose cycle. What’s not mentioned is that the beat between these two cycles is ~41kyr. (9*4627). Over longer periods, the orbits should not be considered as constant due to the continual exchange of angular momentum.
Earth’s orbit is a pawn in the same resonant solar system and is influenced by the orbits of the Jovian planets. It’s going to be difficult on those time scales to separate long-term solar cycles from Milankovitch cycles. Here’s a 5-cycle harmonic model I’ve created. Precession isn’t a factor, but a 74kyr cycle is. How do we explain this? On shorter time scales the dominant cycles are approximately 100k, 70k and 41k.
I don’t know how the Jovian orbits are involved, only that they are. Tying this into Earth’s orbit requires significant positive feedback. The Sun is both a huge mechanical structure and a source of energy. Why wouldn’t it have resonant modes and variable output?
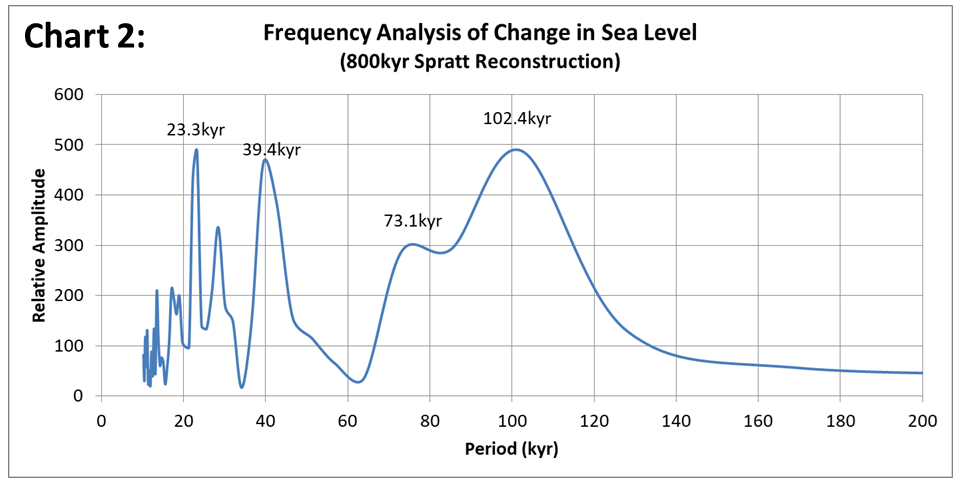
I have previously shown how strongly the precession cycle exhibits in the change of sea level over the past 800,000 years.
 ?quality=75&ssl=1
Precession of perihelion is the key driver because it is the shorter cycle. Obliquity exhibits strongly as well, The longer peaks are more likely multiples of precession rather than eccentricity.
Possibly, but the 5th sub-harmonic of 4627 is 23,135.
IMCEE Insola gives last solar minimum at 15N on June solstice as 1000 years ago. The minimum before that was 22,400 years ago. So time difference of 21,400 years for the last precession cycle. 3rd harmonic is 7133 years and 6th harmonic is 3566 years.
It would not surprise me to see harmonics of the precession cycle in climate data at specific locations due to two hemispheres with different exposure to solar intensity during a cycle in combination with the distribution of land and water across the hemispheres.
I did the Fourier transform of my calculated solar activity and its longest period peak is 166 years. Largest peak occurs at 9.9 years. I know TSI and Sunspot activity are displaced in time. But my Velocity Method as TSI proxy is simplistic in the time domain. The large spinning mass of the sun responding to the resonant pumping of Mercury has a long lag time. But of the order of hundreds of years not millenia. Your 3560 year time shift is most likely the 6th harmonic of precession. Precession of perihelion is the most significant climate driver in the 10E6 year domain down to century scale.
Rick: “It would not surprise me to see harmonics of the precession cycle in climate data…”
And it doesn’t surprise me to find Jovian-related periodicities in Earth’s orbital parameters ,and in solar-activity reconstructions. Obviously we can’t ignore variations in solar activity.
I’m sure you’re aware that 166 is very close to Neptune’s 165-year orbit, and that 9.9 years is the second harmonic of the 19.86-year Jupiter-Saturn Conjunction (6.6 years is the third).
As an aside, the top panel offers one interesting clue; Earth’s temperature spectrum has notches at the orbits of Saturn and Jupiter (also Schwabe).
There’s too much evidence that Uranus and Neptune are somehow involved, but it’s obvious they’re too far away to directly influence the Sun so that leaves two other possibilities. First, there could be a cascade of influence, e.g. Neptune<->Uranus<->Saturn<->Jupiter. Second, the planets have little influence, and the orbits are simply a proxy for solar-internal resonances. With the Sun being 99.87% of the solar-system mass, I’m leaning towards the second possibility.
Solar-internal resonances would help explain something that Scaffeta discovered — the spectral structure of the Sun’s motion, including both orbits and conjunctions, clusters around harmonics of the Jose frequency (e.g. N/178.8), plotted here with red-dashed lines. The first two lines are near Neptune and Uranus.
Since we already know of a number of climate cycles that operate on decadal and centennial ranges, as well as postulated cycles at a millennial scale, pointing to a change over a few decades says nothing regarding long term trends.
Nick,
What is implausible here?
Does Ric have wrong measurements, wrong calculations, missing co-factors, what?
I do not see any made up stuff. This is about derivation of a meaningful conclusion from available data, which is what mathematicians like you do all day long as a tool of trade.
An apology would be nice.
Geoff S
“Observations from ocean moored buoys indicate that sustained tropical convection develops when daily-average ToA solar flux exceeds ~425 W/m² for sufficient time for surface temperatures to reach ~30 °C. Once this threshold is maintained, evaporation accelerates, deep convection initiates, and atmospheric moisture increases. At this stage, further energy input does not produce unconstrained SST rise. Instead, convective regulation dominates.
This regulation is associated with convective overshoot once surface temperatures exceed ~30 °C, leading to the formation and persistence of micron-scale ice particles in the upper troposphere, increasing shortwave reflection. Together with enhanced evaporation and latent heat export, this acts as a strong regulatory process limiting further SST increase while maintaining high energy throughput…”
425 W/m^2 upwelling.
100% imaginary.
Instrumentation hallucinations.
Indeed.
The word is not mentioned at all in the article. I do not get what you mean by it.
Very interesting all around, RickWill.
You are making a notable contribution through this work.
Thank you.
Ties in your observations on the significance of convection/advection in the climate system. Slight increase in power of convection is likely to change the climate.
In the paper, I have an error in the increase in area of the tropical region reaching above 425W/m^2. I wrote 0.3% when it is actually 1.1% for 2024. It varies due to solar activity but the long term trend is increasing area.
“Solar irradiance variability was inferred from the square of the Sun orbital velocity variation from its average with a 2.4 year phase shift and validated against SORCE project TSI measurements.”
If this cannot be precisely shown with equations and numbers then it can’t be believed.
All the data is readily available from links I provided. Anyone who wants to verify the validity can do it quite easily. The amplitude of the TSI change aligns well with the variation in Sun velocity wrt its average velocity but the quarter cycle phase shift of 2.4 years is an approximation of what is actually happening with the tidal torque applied to the Sun spin.
The variation in TSI is small with a range of 0.2%, However it is the main cause of rising solar availability across the tropics in the CERES era. CERES exhibits the solar cycles but yearly comparisons of energy run into the 3X365 and 1X366 problem.
Solar cycles produce considerable variation while precession of perihelion provides a strong long-term trend that is currently increasing tropical solar energy available to drive convection.
The difference between 23.55S and 23.53S works out to a just under 1.06 kilometers. I find it hard to believe that this is going to be enough to create any noticeable difference in anything.
The values you show are from 1143 and 1345 and did not do much. They were either side of the base year 1255 that was taken as the centre of the period when perihelion aligned with the December solstice.
Sun zenith at perihelion in 2024 was above 22.89S. That small change of 0.65 degrees from 1255 produced half of the 4 ZJ increase in annual tropical solar energy. The other half comes from 2024 being close to the peak of SC25.
Possibly the more important change is perihelion occurring 12 days later in 2024 than 1255. That means the transition from SH to NH monsoon is now continuous because the Equator now gets enough sunlight to sustain monsoon through April as Sun zenith moves north of the Equator.
Ric,
Some commenters do not understand that if correct, this is a numerical contribution to “Climate Change” that takes “CO2 control knob” to the dust bin of history.
(Disclosure: I have had some hours of one-on-one discussion with Richard Willoughby. Some of the fine detail is beyond me because I have not heard it before, so I am going to more and more references. Overall, I have no objections about what is more familiar.
I regard this article as one of the more important that I have read in 35 years of climate change study. Light note, engineers get numerical analysis and measurement better than most disciplines. Avoids bridges falling down. I almost finished a B.Eng but a car crash stopped that. Later I finished with a B.Sc and worked in Geology, another discipline at the leading edge of climate change reality. Both beat Arts degrees by a country mile.)
…….
Suggestion. Richard is seeking useful feedback from readers, not lengthy competing pet hypotheses. Readers might have to do more study to understand this article, like I did, to start to understand it.
Geoff S
iiiiii
Is the data shown in Chart 3 averaged over 24 hours?
Also, the end of the interglacial is nigh if the previous several glacial cycles can be an indicator. We don’t have 10 millennia to see the results of the changing insolation due to orbital mechanics. Have these calculations been run over the previous 500,000 years to see how the glacials and interglacials line up with insolation?
It is the difference of 24 hour averages of sunlight at the particular latitudes over an annual cycle. The late March increase of almost 5W/m^2 is the increase in daily average sunlight at 30N from 1255 to 2024. It is likely to bring growing seasons forward over recent centuries.
Re-glaciation is likely to be apparent by next millennium. Expect to see permafrost expanding downslope on northern slopes bordering the Arctic ocean. So far, Greenland is gaining altitude on the plateau above 2300m. That will get lower as snowfall accelerates.
I have looked closely at sea level change over 800,000 years and it exhibits a strong precession signal.
 ?quality=75&ssl=1
I have been able to get good correlation with glacial cycles using the differences in July sunlight at 15N and October sunlight at 50N. The model relies on a land carrying limit for ice to slow down the water cycle. Excessive calving initiates the melt not more sunlight. Ice exists above 5000m in the tropics so melt is impervious to sunlight.
If you want to be ahead of the rush, buy some land in north Africa. Maybe not for you but for your great grand kids.