From NOT A LOT OF PEOPLE KNOW THAT
By Paul Homewood

Excellent work by Ray Sanders, who has up to date photos of the weather station at Kew, which have been posted at Tallbloke:


Kew, according to the Met Office, is a Class 2 site:

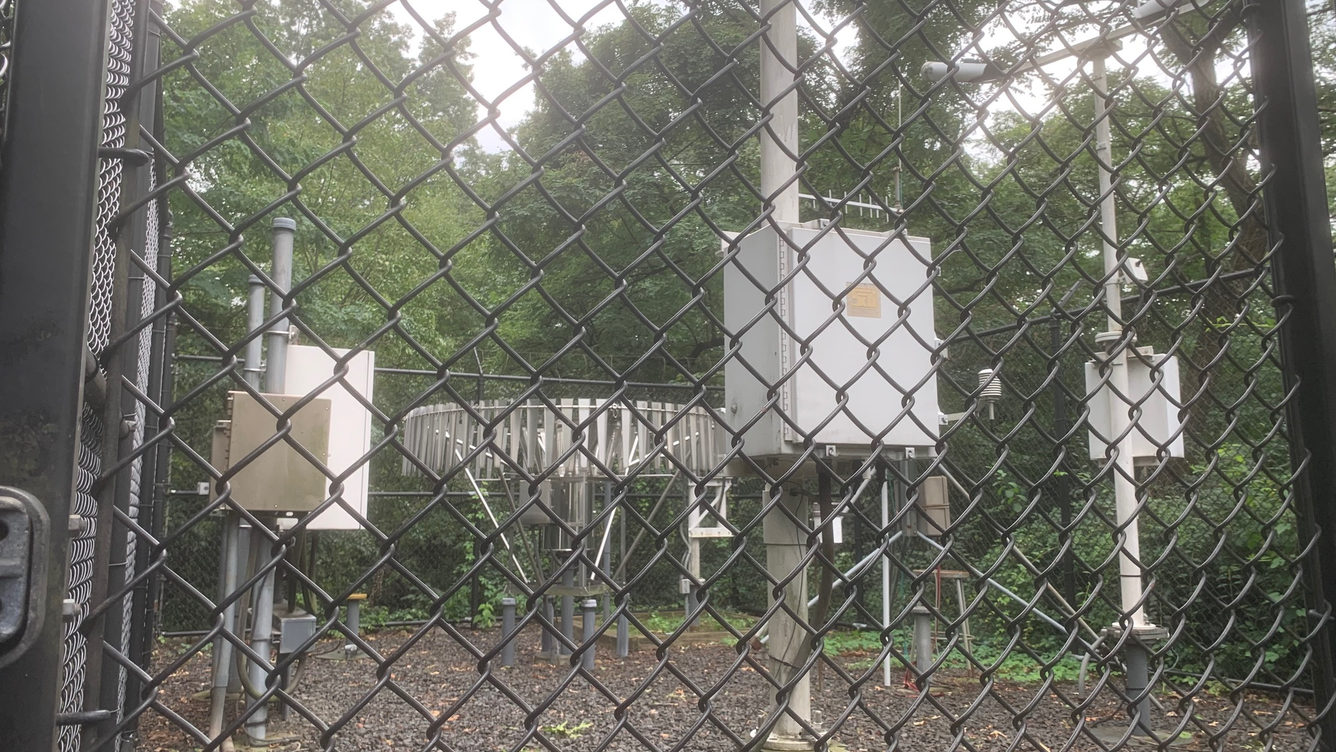
The photo, taken this month by a contact of Ray’s, clearly shows Kew is most definitely NOT Class 2.
For a start, the it must be covered in low vegetation, less than 10cm. That long grass is about 1m tall. Even Class 3 must have vegetation of less than 25cm, which means Kew is at best a Class 4.
Secondly, the Stevenson screen is just inches away from that wooden fence. Again, this conflict with the Class 2 rule about “open space”. This rule is particularly significant, because fencing creates a sun trap effect, reducing air circulation.
Class 4 sites have uncertainty of up to 2C, meaning that the temperature of 35.1C at Kew could be as low as 33.1C statistically:

According to the Met Office, the next five highest temperatures after Kew that day were all junk stations. Heathrow is technically Class 3, which is absurd, and the other four are all Class 4 and 5s:

I get my forecasts from independent people, but the Met Office “official” warning notice appears…so much for independence in Totalitarian Britain…
Thank you for not bolding.
The UK is in a unique ‘climate’ position: It has not accepted the IPCC ruling on RCP8.5 and all Met Office climate reporting to the CCC is based on just that. A quick search of the MO website for RCP8.5 yields this (and similar)result
RCP8.5 Search results (222)
UKCP18-Key-results.xlsx
Ad nauseam.
There is no acceptance or even acknowledgement of their UN masters’ new edict. In fact, the entire mainstream media has taken the BBC approach; as they have omitted to mention it, it didn’t happen and 97% (sic) of the public are unaware of it. Narrative saved, for now.
The MO is rather fortunate, not only does it have a wealth of junk sites to choose from, it also has over 100 entirely imaginary stations.
UKCP18 – Key result? It’s junk.
Trebles all round.
The government shows no signs of accepting a supreme court decision (sex is biological), which I would argue is a far more serious worry than the Met Office ignoring a UN body. If we won’t abide by the rule of actual law, why would we pay attention to mere opinion, albeit the opinion of the IPCC?
When you give up on the rule of law you have a bigger problem than a bit of warm weather.
Story tip: Hey bud, can I pay you to take my heavily subsidised renewable electricity?
The cackhanded pursuit of Net Zero by Ed Miliband and his predecessors has left Britain having to pay France and other countries to take excess power off our hands for a significant portion of the year.
Daily Sceptic
Where’s the diversity I hear people ask, don’t worry, Belgium, Holland, Ireland and Norway also benefit
Plus Norway has the North sea all to itself now.
And Norway is looking at expanding its oil and gas, significantly.
Norway approves 70 new exploration areas and three gasfields – El-Balad.com
Got to keep adding to that Sovereign Wealth Fund and keep the people happy!
Those smart Norwegians are benefitting on both ends economically, energy cost savings AND long term investments. Well played.
Its been handed to them…. a real own goal.
It was handed to the English as well, alas…
“Cackhanded”? Is that anything like crackheaded?
Awkward, clumsy etc
Then crackheaded would be more apt–delusional, obsessive, destructive, self-serving.
Scotland should split from the UK and seize control of the North Sea oil and gas fields. They could then sell petrol, diesel and nat. gas to Britain, Wales, N. Ireland, the EU countries, and get really rich like Norway.
Aren’t you forgetting the Scottish mentality?
I live in BC and not familiar with that. Clue me in. Is the spirit of William Wallace still alive or has it gone dormant? The Scots should form a raiding party, capture Mad Ed, and exile him to the Shetland Islands and thus save the UK from collapse.
The explorer Simon Fraser came to BC in the early 1800’s. There is mighty river and and a university named after him. I worked in the Simon Fraser chemistry department doing research for over 30 years
I wouldn’t wish that on the Shetland Islands.
So the evidence any person can walk up and document shows Met Office is intentionally falsifying it’s data. Wish I could post a picture, then y’all could see my shocked face.
As corrupt as the government that runs them.
I said the Kew weather station was fake on the Independent newspaper comments. The lefties went mad. So thick it’s hilarious. They said I was making it up.
They didn’t ban you? I’ve been banned by most: the Grauniad, the BBC, even Skeptical Science etc.
The interesting thing is GB News, Breitbart etc are really no better, although they may claim to walk towards the fire, they play the Ofcom game.
I was mentioned in SkS files as a known denier for my BBC comments.
I wore it as a badge of honour
I didn’t last more than a day there. They are really uptight.
The Met Office is supposed to be a professional organisation. We pay for this appallingly bad work!
Their “profession” is supporting whatever position the government is taking this week.
Yet another example of the TOTALLY ABYSMAL state and maintenance of Met-Office sites…
.. even, or maybe “especially”, ones that they consider “important” !!
Why does the Met-Office even exist if it can’t do its one main job properly !
ps….. waiting for our resident Met-Office shill to appear to say this is totally perfect. !
Junk sites, junk data….. but its all they have.
And of course, those metal boxes attached to the legs of the Stevenson screen won’t get warm and add heat to the screen… I mean… WT* !!!
What a totally FARCICAL situation. !!
“Class 4 sites have uncertainty of up to 2C, meaning that the temperature of 35.1C at Kew could be as low as 33.1C statistically:”
That’s not what that means, the temperature uncertainty referred to is the sites ability to represent the surrounding area, in the case of Kew that is almost certainly an underestimate of its surroundings, i.e. on that occasion 37ºC.
It represents 33.1C as 35.1C, that discrepancy seems obvious…
With all those sources of heat nearby, the station is actually cooler than it could have been?
Have you ever stopped to listen to yourself?
The fencing alone causes more than just air flow blockage. It’s faded and has lost a significant amount of its reflectivity – meaning it gets HOT in the sun which then impacts the air around the station.
Same for the vegetation. It’s not just too tall, it’s not the same color as the surrounding vegetation – some of it actually appears to be bare ground. All of this impacts the microclimate. Bare ground will heat the air under the station and convection will introduce this into the intake of the station – i..e it’s going to look warmer than it actually is.
I can’t tell from the perspective of the image but is that station actually six feet above the ground? Another impact on the microclimate.
And the 2C uncertainty? That’s a typical uncertainty for the station ALONE. The microclimate adds to this. The actual measurement uncertainty, based on the image, is probably at least twice that and asymmetric at that! It’s probably more like -1C/+4C.
What it all really means is that the entire system is unsuitable for the purpose to which it is being applied.
The official reason for the class 4 classification says exactly the opposite in that it says it reads high:
“Proximity to Microclimatic Obstructions:”
The distances to surrounding buildings and trees is more than 30m and so meets WMO standards for Class 2. Temporary festival structures would of course compromise data at that time if they were within 30m.
“The Urban Heat Island (UHI) Buffer: ”
While the Kew Gardens reading will be within the class 2 range for the gardens themselves it will almost certainly be an underestimate of the surrounding urban area.
“Modern Sensor Resolution:”
The comparison with LiG thermometers is true of all modern automatic stations.
The fence is a heat sink and a source of heat. It is an obstruction and impeds air flow.
“The fence is a heat sink and a source of heat. It is an obstruction and impeds air flow.”
And the Stevenson screen is above it and will be exposed to any wind in the park.
So you think all wind is at 6′ height and up? An obstruction below the 6′ height will cause turbulence and affect what is seen at the screen. That fence *is* part of the micro-climate of the station and it *will* affect the readings of the station. It simply can’t be accounted for through initial lab calibration of the station and its sensor.
On a warm day, this site is so bad that it could easily give measurements that are much warmer than the surrounding area, those boxes on the legs of the screen would heat up the whole screen as would the totally unmaintained aspect of the site..
….. and the surrounding are is also in the middle of the London heat dome.
It is almost as though they are trying to create fake high temperatures.
Your assertion is beyond doubt to me. I will shortly be posting quite a revelation review of a new Met office weather station installed in March 2026 (within the last 4 months). It is located in a walled kitchen garden deliberately intended to artificially warm the area and create a micro climate. Furthermore there are issues of the instruments facing south and novel unexplained alterations to reading protocols which inevitably show warming where none exists. I am awaiting some official responses but it really is quite outrageous what they are doing. The sole reason for installing this site was (allegedly) because the gardener (I kid you not and have this directly from the person involved) simply asked the Met Office if they could have one! So much for scientific credibility. This is not accidental nor inadvertant – this is deliberate gerrymandering. The Met Office has been captured.
The microclimate probably introduces an asymmetrical uncertainty. It’s highly unlikely that the station will ever give temperatures less than the actual environment. The uncertainty interval is probably more like -1C/+4C or even +5C!
“….. and the surrounding are is also in the middle of the London heat dome.”
Exactly which is the area that the site is measuring the temperatures for! Of course it will be lower than in the surrounding residential area.
Sorry,, but your understanding of Met Office sites is near zero.
Because of the lack of maintenance, their surroundings, and urban effects etc, they are absolutely certain to measure very much on the high side..
Measurements are HIGHLY SKEWED to over-reporting the real temperature..
Looking at Kew, it would not surprise me if it actually measured some 5C more than even the surrounding park on a hot day.
Sorry, I missed this message from you. I just replied to you upthread that the measurment uncertainty for this station could actually be +5C (no negative) because of the microclimate. Good to see someone agree with me.
No Phil that is a slight misinterpretation. The temperature recorded at the Platinum resistance thermometer will be exactly correct. The issue is that it is only recording a tiny micro climate that does not represent the wider area by up to +/-2 °C. An analogy would be an oven set to 200°C – a thermometer inside (the thermostat) will record 200 °C but that would not represent the temperature of the kitchen it is in which may be only 20°C. The screen at Kew represents the oven and is not recording the temperature of the wider environment. It is of course completely wrong and in this case I would suggest Kew has deteriorated to Class 5 with an area misrepresentation as high as +/- 5 °C
Ray, In the case of Kew, I think we can leave out the “-” bit..
The error is almost certainly well on the “+”side.
Don’t forget that the ±2°C is in addition to the fundamental uncertainty of the measuring station itself. The station itself has uncertainty items like, the screen, the fence, the metal boxes, internal electronics, repeatability, reproducibility, etc.
In the U.S., NOAA shows ASOS stations with a ±1°C reproducibility uncertainty alone. CRN stations have a ±0.3°C reproducibility uncertainty. The uncertainty of the PRT device is only part of the total station uncertainty.
How would you assess this station?
 ?ve=1&tl=1
No that’s a terrible comparison, it would be more like the temperature in my oven when it’s switched off not representing the temperature of my kitchen!
I did that experiment today, inside the oven was ~1ºC cooler than my kitchen.
An explanation of what the heck you are talking about would be nice. I figured it out, but some of us just don’t have the basic knowledge you assume we have.
Paul,
Conditions for measuring, digitising and recording might be different enough in England versus my Australia for this tip off to not mean anything – but the tip is, compare the original handwritten temperature data sources with what is adopted today as the basic historic record from which most projections of future climates are made.
Geoff S.
A question.
What is that rectangular thing on the ground near the screen? The close up seems to show a wooden frame covered by chicken wire. Does it have a legitimate purpose?
It covers the soil temperature measuring instruments.
No, the unkempt grass does that.
Soil temperature measuring instruments are typically below the surface. Why would you want to cover them with a wire screen?
To protect the sensors from being trod on or other damage during maintenance.
“during maintenance.”
Now that is just funny !!
Yeah, that place has obviously seen a lot of maintenance!
If the sensors are underground how do you walk on them? What stops anyone from just stepping onto the wire mesh? If you want to protect the wiring going to the sensors why not just use conduit?
The sensors are probes inserted into the ground to the required depth with the electronic connection to the station above the ground. The connection can be clearly seen in the photograph.
You said: “To protect the sensors”, not to protect the connection to the sensors.
That connection should be protected with conduit, not with a covering screen! The screen does nothing to prevent someone from stepping on the connection. It does nothing to prevent the environment from impacting the micro-voltage readings from the probe.
One more problem with the overall station setup. It *increases* the measurement uncertainty of the station.
How much power is dissipated in those equipment boxes?
Has anyone touched a metal box in the sun on a hot day..
…they really get very hot, almost enough to burn your fingers.
Looks like three boxes are mounted to the support frame.
I largest one looks like might be plastic. The smaller ones could be metal.
But is it normal to hang anything on the support for a Stevenson screen?
I doubt it but I’m no expert.
(As I demonstrate here more often than I’d like. 😎 )
Each one is mounted on a large metal plate.
The area under the screen should be open…
They should not be there.
Kew also houses its thermometers in a naturally ventilated Stevenson screen. That alone, puts a ±0.5 C systematic uncertainty on every single daily mean.
Worse than that, they only use 60 second averaging of 4 instant readouts every 15 seconds for a one minute time stamp and not even a rolling average. 1440 individual readings per day and any single on can be classed as the max regardless of those either side of it. I explained it all in detail here for the lay reader.
https://tallbloke.wordpress.com/2026/04/26/stevenson-screens-the-aesthetic-and-moral-codes-of-the-suburban-domestic-garden-an-explanatory-report/
I assume you meant mid-range value and not the actual mean?
No just the crude arithmetic mean The Met Office uses very basic means. https://tallbloke.wordpress.com/2025/07/23/the-reification-of-averages-part-one-how-the-met-office-manipulates-measurements/
That is the mid-range value.