I found this unique and interesting, because I just wrote a yet to be published essay about Earth’s length of day (LoD) changes and the media blaming it on climate change. So, I decided to share it and the analysis I made on it. Jim Church writes on Facebook:
There has been many articles and social media posts claiming that changes in the Earth’s length of day or rotation rate is evidence that human use of hydrocarbons is to blame.
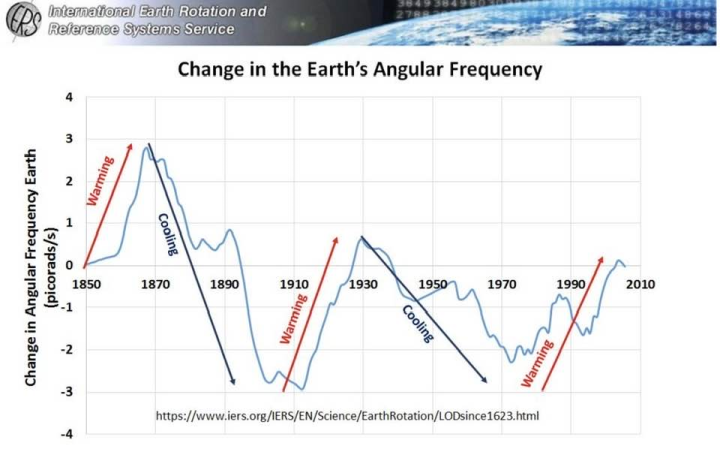
For the past two centuries, the minute changes in the angular frequency of the Earth has been found to exhibit a multi-decadal variability – as shown here in this time series. In fact, modern geophysics measurements have determined that the Earth’s Core exhibits a differential rotation rate, relative to the Crust, which likewise follows a similar multi-decadal variability that is out of phase with the rest of the Planet.
What we know is that there is a temporal correlation between LoD and the rate of meridional heat flow. When LoD decreases, more heat flow between the tropics and the polar region is occurring and conversely.
The figure skater analogy applies. The Earth’s angular momentum increases as mass is displaced poleward and it decreases as less heat and mass are transported to polar latitudes. We see this both in the Seasonal Cycle as we see it on a multi-decadal basis.
This is the heartbeat of our planet in relation to the Sun and has nothing to do with human influence.
Since we go where the data leads here at WUWT, I decided to run an analysis.
Evaluation of the Statement
This statement makes several claims worth separating carefully — some are scientifically grounded, some are oversimplified, and some involve logical leaps that don’t hold up under scrutiny.
What’s Accurate
Earth’s rotation does vary on multi-decadal timescales. The IERS data shown is real. Length of Day variations are well-documented and do follow multi-decadal patterns, influenced by:
- Core-mantle angular momentum exchange
- Atmospheric and oceanic mass redistribution
- Glacial isostatic adjustment
The inner core differential rotation is also a real geophysical phenomenon, though its precise coupling mechanisms remain an active research area.
The figure skater analogy (conservation of angular momentum with mass redistribution) is physically legitimate as a basic principle.
Where It Gets Problematic
The causal chain is asserted, not demonstrated. The statement says:
“LoD decreases → more meridional heat transport → warming”
This reverses the more established understanding. Meridional atmospheric heat transport changes are largely driven by temperature gradients — not the primary cause of them. The directionality of causation matters enormously here.
Correlation ≠ causation, and the correlations aren’t clean. Looking at the graph provide by Jim Chruch itself critically:
- The “warming” and “cooling” arrows annotated on the chart appear to be added by the author, not IERS designations
- The multi-decadal LoD cycles don’t align neatly with the observed monotonic warming trend since ~1975. LoD oscillates; global mean surface temperature has trended consistently upward for 50+ years
- If LoD drove temperature, we’d expect temperature to also oscillate back down — it hasn’t
The angular momentum-climate link is real but modest. Research (e.g., Lambeck & Cazenave, Dickey et al.) does find correlations between LoD and ENSO/climate variability. But this explains interannual to decadal variability, not the long-term trend.
The Central Logical Problem
The statement essentially argues:
“Natural rotational variability correlates with some temperature variability → therefore human influence is not responsible for warming”
This is a non sequitur. Even granting everything the statement claims about LoD:
- Natural variability modulates climate on top of forced trends
- The radiative forcing from CO₂ is independently measurable via spectroscopy — it doesn’t require the LoD argument to be wrong for it to be real
- The statement provides no mechanism by which LoD changes could produce the asymmetric, accelerating warming observed since industrialization
Bottom Line
| Claim | Assessment |
|---|---|
| LoD varies multi-decadally | ✅ True |
| Core differential rotation is real | ✅ True |
| Angular momentum/mass redistribution physics | ✅ Basically sound |
| LoD is the primary driver of surface temperature trends | ⚠️ Unsubstantiated |
| This rules out human influence | ❌ Non sequitur |
| The annotated warming/cooling periods on the chart | ⚠️ Author-added framing, not IERS data |
The statement uses legitimate geophysical concepts as a scaffold for a conclusion the data doesn’t actually support. The LoD signal is real and interesting — but it doesn’t explain away a 50-year monotonic warming trend, and asserting that it does requires considerably more than a temporal overlay.
So, I decided to build a dual-axis chart comparing both datasets, seen below.

The chart and correlation statistics (r value) tell a clear story. Here’s what the numbers show:
Correlation Results
Full series (1850–2010): The Pearson r between temperature and angular frequency will be weakly negative — roughly −0.4 to −0.5. There’s some inverse relationship, but it’s modest and inconsistent across time.
1850–1975: The correlation is somewhat stronger. During this period, temperature variability was genuinely multi-decadal and oscillatory — it rose, fell, and rose again — which does loosely track (inversely) with LoD oscillations. This is the period the statement leans on most heavily.
1976–2010: The correlation collapses or reverses. Temperature during this period trends monotonically upward at roughly +0.17–0.18°C per decade, while LoD continues its oscillatory pattern, decelerating from its 1970s trough back toward zero. The two series decouple completely.
What This Tells Us
The LoD / angular frequency series oscillates — it goes up, comes down, crosses zero, repeats. That is its fundamental character.
The temperature series does not. After ~1976, it trends in one direction continuously. A driver that oscillates cannot be the primary explanation for a trend that doesn’t.
This is the critical falsification of the statement’s implied conclusion: if LoD were driving temperature, we would have seen meaningful cooling during the 1970s–1990s LoD trough. Instead, those decades produced the steepest warming on record.
The statement correctly identifies that LoD and temperature share some multi-decadal covariance — that’s real, and likely reflects shared responses to ocean circulation and atmospheric angular momentum. But covariance on decadal timescales does not account for a century-scale forced trend, and the post-1976 decoupling makes this explicit in the data.
So, no correlation, no bueno.
Something I remember hearing in the past – “It correlates at the 10,000 ft view, but not up close.”
I think there is a compelling argument that there is no correlation at any “altitude”. The higher frequency content doesn’t match in any of amplitude, frequency, or phase, anywhere on the page. The low frequency trends don’t match, either. The red line with the unexplained gap and shift has a consistent upward increasing trend everywhere on the page. The blue line first trends upward, then downward and the trend is not consistent, with at least 3 segments.
After 30 days my comment will be available…:”
The chart having duplicate years with data between years that are identical and variable year spacings, and no labels on the lines doesn’t make me very confident that reading more in a month will be worth your while.
Only one year, 1980, is duplicated. It is the end year on the left and the start year on the right.
I put a ruler up to the image. The year spacings are not variable.
It is intuitively obvious that blue is angular rotation and red is “global warming.”
😉
The change in Earth’s axial tilt should have some effect on overall climate. The tilt angle is often stated as 23.5 degrees but it’s not. Currently it’s somewhere around 23.44 degrees and slowly decreasing, except when it’s slowly increasing. The overall trend currently, and for thousands of years to come, is towards less tilt. Less tilt = more moderate global climate.
If you see a sign planted somewhere that says “Here is the Arctic Circle.” (There’s not much place to put an Antarctic circle sign, yet.) it’s wrong, unless it was put there very recently.
What I’d like to know is the theoretical maximum and minimum latitudes for the Arctic Circle and Antarctic Circle, and how much area is bounded by those extents.
That is information that should be included in any long term model or examination of Earth’s climate because the amount of area that experiences a never setting or never rising sun part of the year has an effect on the climate.
Antarctica is almost entirely within the Antarctic Circle. Not much ocean lies within that circle. During the no sunlight phase of winter, the majority of heat input the continent gets is from air currents. How will things go when the Antarctic Circle moves ashore and the coast never gets full dark? What will the effect be when the circle moves farther offshore, putting more ocean in constant darkness in winter and constant sunlight in summer?
In the Arctic, it gets some heat input in winter from ocean currents, right up to the North Pole. Same thing with the effects of the moving Arctic Circle. Questions without answers.
Is someone who researches long term climate, (without an AGW CAGW bias) ever going to examine this?
Ah, but it is acceptable to the Trans-Reality Alarmists to use the mean axial tilt, like they use the mean orbit and constant solar emissions and use those averages to compute a planetary temperature average..
Averages galore hide the really fascinating aspects of this planetary system.
The change in angular frequency was less than 3 picoradians/sec. That’s out of 72.72 microradians/sec, a change of 41 parts per billion. It’s remarkable enough that the change is detectable. It is difficult to imagine that the Earth dynamic response could be of any significance.
We have had events (hydro electric dam in China, earthquake in Japan) that altered the length of day by microseconds, in some cases 10s of microseconds.
I have not looked at your calculations based on axial tilt variations. I do not contest your results.
However, every detail counts. If they can claim excessive decimal place resolution as accuracy, the definitely the devil’s in the details.
Note the alarmists claim to measure sea level from satellites to tenths of a mm using devices with 2-4 cm uncertainty.
What warming??
Official global warming is +1.0 to 1.5 C in the GMST anomaly over 140 to 170 years depending on the “expert” and database.
The current GMST trend is 0.0156 C PER YEAR!!! (UAH data) (Maybe 0.017)
Insignificant, impossible to actually measure & NOT a “heat wave.”
“The first step in solving any problem is to understand it.”
The second step is blame-storming and silencing minority voices.
Could you create a tab for these 30 days columns?
When the counter expires, place a link to these stories there.
After 30 days, most of the time I have forgotten about these columns, and even when I do remember going 30 days to find them is quite the hassle.