Richard Willoughby
Summary
This article examines Earth’s position in relationship to the Sun as well as solar activity in high spatial and temporal detail across the globe to better understand how the Sun influences weather and climate change. Daily sunlight data across latitudes is compared with observed trends to give insight into why the climate changes.
Poleward advection of heat from the Equator is covered in detail and used to understand why more ocean heat is being retained in the high condensing zones of both hemispheres.
A simple matrix of Earth’s climate zones and annual seasons is shown to provide a coherent basis for comparing seasonal solar changes from period to period and even year-to-year to understand climate trends and seasonal weather shifts.
Introduction
Earth’s orbit around the barycentre of the solar system and the Sun’s movement relative to the barycentre causes a continually evolving geometric relationship between Earth and Sun. The geometry of the relationship can be reduced to two variables at any point in time – the distance between their respective centres and the declination of Earth’s equatorial plane to the line between Earth and Sun. These two variables can be used to calculate the solar electro-magnetic radiation (EMR) reaching the top of Earth’s atmosphere (ToA) and its zenith angle at any latitude on Earth for any specified time.
Distance Earth to Sun
NASA JPL provides daily declination and distance data through the Horizons portal. Chart 1 shows how the daily distance between Earth and Sun has changed relative to the corresponding day in 1920 for the period 1980 to 2030.

The step every 4 years is a result of the calendar reset on leap years. The change in distance influences the intensity of the sunlight reaching Earth according to the inverse of the distance squared. Chart 2 displays how the ToA zenith sunlight changes relative to the corresponding day in 1920 solely due to the changing distance. The solar constant used for this chart is 1361W/m².

The gradual daily change in solar intensity over the 50 year interval shown in Chart 2 is primarily due to the varying orbit of the Sun while larger and longer term changes are due to the precession of Earth’s orbit around the barycentre of the solar system. Perihelion occurred on 3rd January 2026 at 147099917km. Aphelion will occur on 6th July 2026 at 152087757km.
Declination of Earth Equatorial Plane relative to Line to Sun
Earth’s axis is tilted relative to its orbital plane causing an observer on Earth to see the Sun daily zenith angle change over a yearly cycle. An observer on the Equator sees the Sun directly overhead on March equinox and September equinox. The maximum northern tilt of the axis toward the Sun occurs on the June solstice while the maximum southern tilt toward the Sun occurs on the December equinox.
Jupiter’s movement around the solar system is in an orbital plane that is not completely aligned with Earth’s orbital plane. The consequence of this is that both the Sun and Earth move north and south relative to Earth’s average orbital plane. This out of plane variation in orbit results in slight variation of solar zenith declination to Earth’s surface to a greater degree than just the axis tilt relative to the line of the Sun in an annual cycle. Chart 3 shows the variation in daily declination angle from 1980 to 2030 relative to 1920.

Positive value of declination means the peak solar intensity is further north than 1920 for that day of the year and negative value means further south.
Solar Constant
The power output of the Sun is relatively stable but not quite constant. The power output has some similarity to the frequency of sunspots and sunspots have been used in the past as a proxy for the cyclic change in solar constant. However a satellite based monitoring program was establish in 2003 and operated to 2019 to provide actual data outside Earth’s atmosphere that was then corrected for Sun-Earth distance to arrive at a measured, distance corrected value for the solar constant. Chart 4 includes the measured data as well as calculated values from correlation with the Solar magnetic field. This solar constant data series is known as SATIRE-S.

There is no gold standard for the prediction of solar activity but there is good correlation between solar activity and the variation in the velocity of the Sun relative to its average velocity. This is the basis for estimating the constant during SC26 that is forecast to peak in 2037 with slightly higher intensity than SC25.
Trends in Solar Intensity across Latitudes
Knowing the Sun-Earth distance, the declination and the solar constant on a daily basis provides sufficient data to hindcast and forecast the average ToA solar intensity for any latitude for any day. Chart 5 provides an example of the trend in maximum daily average solar intensity at 10N.

Chart 5 is the highest daily average ToA solar intensity for every year at 10N from 1920 to 2040. In 2025, the peak occurred on 18th April. There is an upward trend of 0.63W/m²/century. 10N is the latitude with the largest upward trend in maximum daily solar intensity.
Chart 6 shows solar intensity at 80S for day 295 of each year, which is the latitude and day with the greatest upward trend for daily average solar intensity due to its high sensitivity to changes in declination.

The warming trend of 6.42W/m²/century is the highest for any specific day of the year and any latitude, which happens to be day 295; usually 22nd October.
Chart 7 shows the trend in maximum and minimum solar intensity across the latitudes.

The data exhibited in Chart 7 lacks the hemispherical symmetry that is commonly expected of solar/orbit driven changes. All latitudes have upward trend in minimum solar intensity apart from the polar regions, where the minimum is always zero. All but the latitudes south of 45S have an upward trend with 10N the highest and well above 10S. If anyone was looking for a cooling surface temperature trend then the best place would be to look south of 45S per Chart 8.

Chart 8 shows the cooling trend in the Southern Ocean of 1.04C per century; which is consistent with the declining maximum solar intensity.
Chart 9 shows the day of the year for each hemisphere across the latitudes with the highest positive and negative trends. Both polar regions have higher trends than the tropics with near symmetrical up and down trends in the hemispheres but not quite symmetrical between the hemispheres. The southern hemisphere polar regions have larger up and down trend than the northern hemisphere.

Trends Driving Changes in Poleward Advection
Heat advection from the tropics to the poles is a significant factor responsible for observed weather, climate and climate change. The seasonal variation in sunlight is the primary driver of the poleward advection of tropical heat. Advection is the result of heat being accumulated in the tropical zones of each hemisphere being transported poleward to cooler temperature and polar zones of each hemisphere. In this example, peak solar intensity at 10N and 10S are taken as representative of tropical heat uptake and minimum solar intensity at 40N and 40S to be representative of the lowest temperature in the temperature zones that creates the thermal imbalance driving advection. The following three charts, 10, 11 and 12 display the trends in both hemispheres for the maximum solar intensity at 10N and 10S; the minimum solar intensity at 40N and 40S and the difference for both hemispheres.


Aspects of these charts that are worth noting are:
- All trends are up.
- The maximum solar intensity at 10S is almost 20W/m² higher than 10N.
- The minimum solar intensity at 40N is approximately 10W/m² higher than at 40S.
- The difference in the SH is 30W/m² higher than the difference in the NH.
- The difference in the NH is trending up almost 3 times faster than the trend in difference in the SH.
Given the baseline differences and trends, it is reasonable to expect that advection in the SH would be higher than the NH and both increasing. The increasing ocean heat content predominantly in the temperate zones of both hemispheres is consistent with these changes in solar intensity per Chart 13.

The temperate zones over the oceans are net condensation zones. The increasing precipitation caused by the increasing heat advection is deepening the thermocline and reducing heat loss from the oceans in these regions.
Surface Temperature Response
The surface temperature across hemispheres and specific locations are highly correlated over any annual cycle; allowing for thermal lag. Chart 14 provides the thermal response to monthly solar intensity for the respective hemispheres.

Once lagged, the temperature is well correlated with the solar intensity. However the NH is cooler season-for-season and has a higher response to lower range in solar intensity than the SH. The NH temperature response would be 1.6 times the response of the SH for the same range in solar intensity.
Daily temperature readings are also well correlated to daily solar intensity for any selected location as Chart 15 shows for Low Head in northern Tasmania.

Low Head is at latitude 40S and it is noted that the correlation is not as good in the tropics and polar zones because these latitudes often experience surface temperature controlling processes due to water phase changes that reduce the linearity with solar intensity.
Forecasting Weather & Climate
Being able to hindcast and forecast daily sunlight and trends from past to well into the future provides a sound basis for understanding weather changes from year-to-year and longer term trends. For example, boreal winter 2025/26 was bound to have above trend snowfall because the NH had above trend solar intensity from March equinox to July solstice but below trend sunlight from September equinox to December solstice per Chart 16.

Compared to 1920, the range in solar intensity from the March equinox to September equinox at 50N increased by 12W/m² – essentially a higher sunlight than average summer followed by a lower sunlight than average winter.
From Earth’s perspective, the exposure to solar radiation can be classified into six latitudinal zones and four annual phases. For the purpose of comparison here, the Zones are:
- Northern Hemisphere: Arctic 60N to 90N, Temperate 30N to 60N, Tropical 0N to 30N
- Southern Hemisphere: Antarctic 60S to 90S, Temperate 30S to 90S, Tropical 0S to 30S
The annual phases are taken from December Solstice to March Equinox to June Solstice to September Equinox to December Solstice. The zones and phases can be visualised as a six by four matrix or a six by five matric to include the last phase of the previous year as in Matrix 1.

The values for heating and cooling are area averaged across all latitudes for the respective hemispheres. The value for advection in each hemisphere is the difference between the heating season and following cooling season. Hence the reason for the preceding year SH Heating value being included in the matrix. The NH Advection of 4.35W/m² was above trend. Monsoon days is the number of days above 425W/m² on an area average basis for the tropical zone. Oceans reach their sustainable limit of 30C at and above that solar intensity. Freezing days are based on days 220W/m² and below on an area average basis for the polar regions. Surface level ice and snow are observed below this solar intensity.
The larger increase in monsoon days in the NH is consistent with the higher upward trend in peak solar intensity at 10N compared with 10S. However the SH has a higher number of days in monsoon due to the higher solar intensity in the SH.
Matrix 2 provides the changes for 2026 relative to 2025.

Advection in the NH in 2026 will be lower than in 2025. However advection in the SH will be higher than 2025 as it follows the higher SH Heating in 2025. NH will have slightly milder summer compared to 2025 but noted that it is still above the 1980 to 2010 average by 0.81W/m².
Discussion
Determining the daily ToA solar intensity anywhere over Earth can be derived from three variables – distance, declination and solar constant. All three can be determined for present, past and future with sufficient precision to be useful for understanding seasonal weather and climate trends. Observed climate trends are well correlated to seasonal and temporal changes in solar intensity. Changes in weather from year-to-year are also readily related to the year-to-year changes in solar intensity.
Increasing global ocean heat retention is the most concrete evidence that Earth is in a warming trend. Changes in seasonal solar intensity and corresponding increase in poleward advection in both hemispheres readily explain this warming trend. Increasing poleward advection also explains the increasing snowfall across the NH with 2025/26 winter predicted to have above trend snowfall per Image 1 as an example of heavy snow. Year 2033 will rival 2025 for NH Heating and NH Advection and year 2037 will have higher NH Heating and higher NH Advection than 2025.

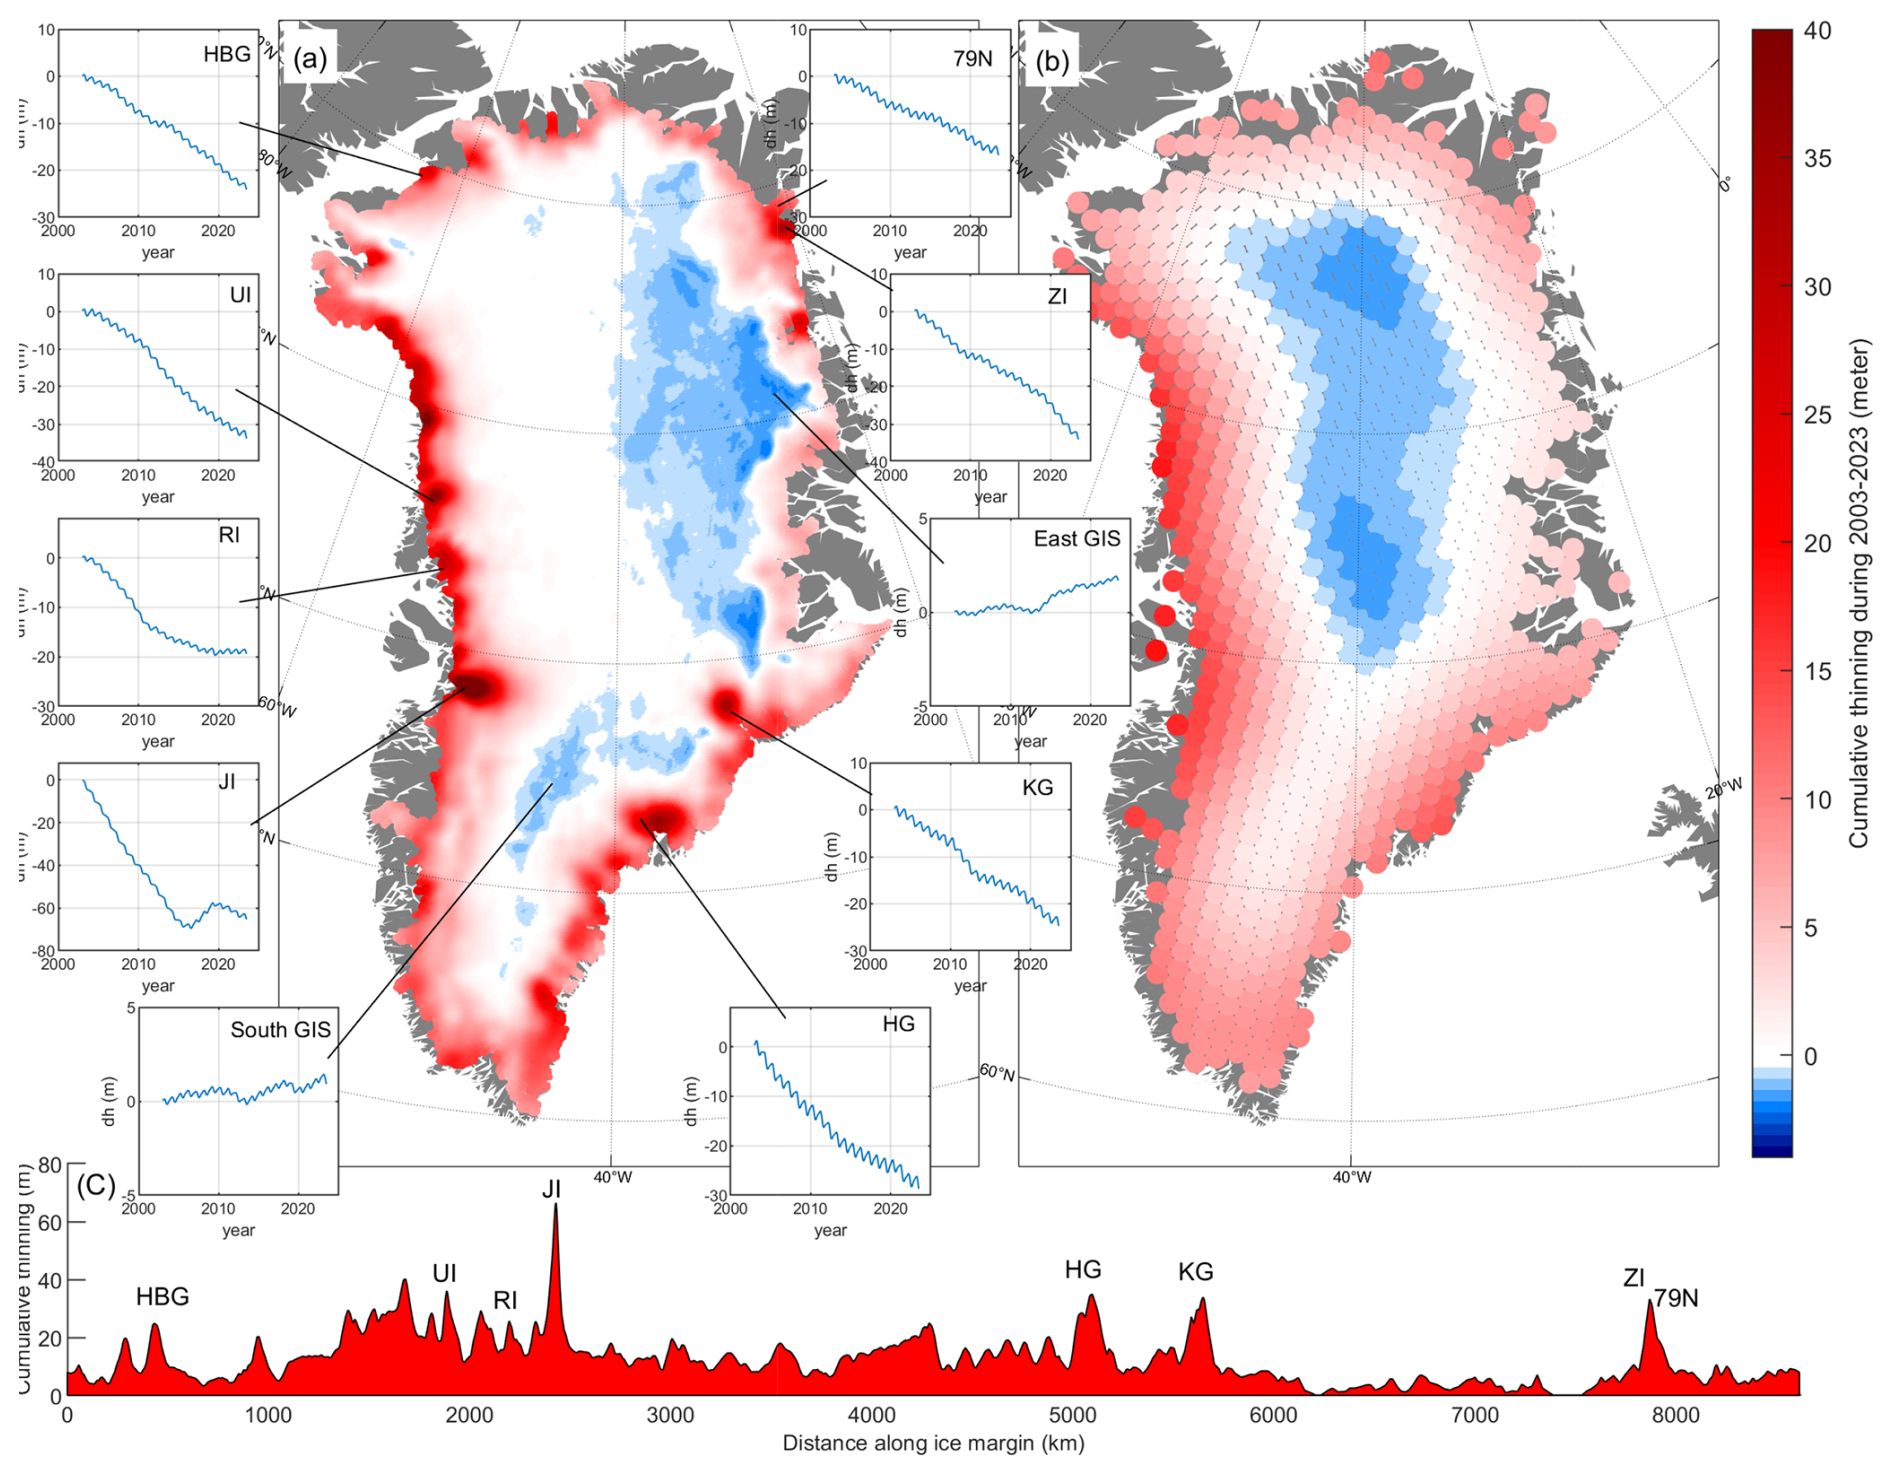
The NH has increasing maximum solar intensity across all latitudes and poleward advection will continue to increase with the difference in area average NH Heating and NH Cooling increasing by 5.1W/m² by 2500 over 1980 level. By then, advection in the SH will be reducing from present level; down by 0.2W/m² on 1980. By the year 3000, NH advection will be 7.4W/m² above 1980 level while SH will be 3.7W/m² below 1980 level. Rising maximum solar intensity in the NH will continue to cause increasing global average temperature even when the maximum intensity across the SH is declining. This is due to the higher thermal response of the NH compared with the SH. The NH will only cool again once the ice starts advancing south. So far only Greenland is showing ice gains at altitude consistent with eventual re-glaciation of the NH. The central plateau has gained up to 2m this century.
Some observed weather phenomena such as the El Nino/La Nina phases of the Tropical Pacific may be better associated with subtle shifts in sunlight than generally considered. Chart 17 is an example of exploring this possibility by looking at how convective cells compete across the Tropical North Pacific to cause reversal of trade winds in certain years. The chart shows the difference in solar intensity at 20N 19 days before the September equinox and 10N 4 days before the equinox compared with the Nino34 index in December.

If the correlation has predictive value then the next El Nino phase will be established by December 2026.
Conclusion
Rapid human development has occurred during the current interglacial period of the northern hemisphere. The SH has largely remained glaciated south of 60S. Historical evidence indicates NH interglacials persist for around 12,000 years, which is half the period of Earth’s orbital precession as shown in Chart 18. Interglacials of the NH terminate when the peak solar intensity in the NH is increasing because liberating water from the ocean and depositing snow on land is an energy intensive process; requiring some 1400kWh per tonne of ice on land. So the oceans need to be warm to produce the atmospheric moisture.

The current interglacial has persisted for 9,000 years since sea level was within 20m of the present level. The peak solar intensity in the NH has been increasing since 1700. Careful examination of the historical evidence shows that temperature increases and sea level rises within 1000 years of the eventual rapid decline in sea level. All the current climate trends are consistent with approaching re-glaciation of the NH within the current millennium. Accumulation of ice at altitude in high latitudes is an early indicator for the eventual ice accumulation down slope and at lower latitudes. Greenland’s largest and most productive glacier, Jacobshavn, has advanced and thickened over the past decade.
Energy security and hour-to-hour reliability of energy supplies will be vital for survival of human populations north of 40N living through an era of progressively harsher winters in coming decades and centuries. The boreal winter of 2025/26 had above trend advection that caused record daily and monthly snowfall in numerous locations. The same conditions of higher than trend summer solar intensity followed by lower than trend winter solar intensity will not be repeated till 2033/34 and will be eclipsed in 2037/38.
The widely held belief that reducing carbon combustion will create perfect weather is a modern cargo cult perpetrated on poorly educated, gullible populations where they fail to examine and understand the evidence.
.
The Author
Richard Willoughby is a retired electrical engineer having worked in the Australian mining and mineral processing industry for 30 years with roles in large scale operations, corporate R&D and mine development. A further ten years was spent in the global insurance industry as an engineering risk consultant where he developed an enduring interest in natural catastrophes and changing climate.
“Some observed weather phenomena such as the El Nino/La Nina phases of the Tropical Pacific may be better associated with subtle shifts in sunlight than generally considered.”
Informative work that says changing sunlight changes the climate. Who knew?
Your chart 17 implies sunlight intensity is a leading cause of El Niño, including the recent one where too many skeptics have fallen into believing misinformation like the Hunga-Tonga eruption caused it.
Well done Rick.
“Your chart 17 implies sunlight intensity is a leading cause of El Niño, including the recent one where too many skeptics have fallen into believing misinformation like the Hunga-Tonga eruption caused it.”
Who has said that? All anyone has suggested is that HT and El Niño combined led to the recent anomalous temperature spike.
Someone with your name said this yesterday:
“It was an HT eruption-powered El Niño spike, and is now fading.”
An HT eruption-powered El Nino spike is an El Nino spike the HT added to.
How did HT stratospheric water vapor heat the ocean to ‘add to’ the El Niño?
If it could do that then what prevented the record tropospheric water vapor from 2024 from warming the ocean even more into 2025, when it cooled?
By what mechanism did the HT eruption actually power the El Niño?
By now I realize no one is going to answer that in any credible way.
Let’s try this one more time…
There was a sudden, significant spike in the temperatures reported by UAH.
The spike arrived with El Niño. El Niño is a known cause for such spikes.
The effect of the HT eruption added an additional warming influence at the same time, therefore increasing the magnitude and duration of the spike.
No one has said that the spike was all singlehandedly caused by the eruption.
No one has said that the eruption caused a warm ENSO episode.
Some have tried to suggest that the eruption had little or no impact on global temperatures. The evidence strongly disagrees with that suggestion.
Do you disagree with any of that?
Anyone that think the HT eruption didn’t add significant amounts of energy to the ocean in the west Tropical Pacific, is ignoring reality and physics. !
This would have fed into the energy released at the El Nino event.
It is also likely that the increased Stratospheric moisture content slowed cooling somewhat as well.
Hence a super-charged El Nino starting earlier in the year than 1998 and 2016 events, about the same peak as the 1998 El Nino from starting point, and a broader cool down period.
“Anyone that think the HT eruption didn’t add significant amounts of energy to the ocean in the west Tropical Pacific, is ignoring reality and physics. !”
You keep asserting this without providing direct evidence.
Show us that you are right with some data, otherwise there simply is no ‘reality to ignore‘. Where’s the beef?
Don’t minimize that people have made strong claims about HT.
“The evidence strongly disagrees with that suggestion.”
Again, what evidence? What evidence is there that HT added more warming and how did it happen?
Look at the 12 month average change plots for HadSST4 and UAH LT.
Can anyone identify where HT made any noticeable impact at all?
The El Niño was going to happen anyway without HT, as it had before.
“Again, what evidence? What evidence is there that HT added more warming and how did it happen?”
The speed and magnitude of the temperature spike was as dramatic, if not more so, than the 1997-98 El Niño, even thought the MEI for the most recent event was nowhere close to 1997-98. As for how it happened (and why the effects have lingered for longer) is a stratospheric H2O pulse. Water vapor lingers in the stratosphere longer, as it doesn’t precipitate out as it does in the troposphere. Sounds like you are holding on to the “HT stratosphere water vapor was no big deal” theory. Hey, I personally don’t really have a dog in that fight. It would just mean that the climate is even less sensitive to atmospheric forcings than we suspected, and it would probably mean that the bright-sun-Venusian-moist-greenhouse predicted for almost a billion years from now is probably even less likely. It also somewhat helps satisfy the “faint young sun” paradox, which I think is related more to the slowing of Earth’s rotation on its axis, but that’s a different story.
You have still not answered the question as to why the HT WV was a big deal in the first place with regard to the temperature change, a change that originated in the ocean, followed by the troposphere.
The null hypothesis is it didn’t have an effect. As I said before no one has put forth a credible mechanism backed with evidence for how that stratospheric WV warmed the ocean, no matter how long it lingered.
Are you also indirectly implying the water vapor that was already present in the stratosphere before HT was also warming the ocean? If so, how?
The obvious mechanism is absorption of outgoing IR by the increased water vapor in the stratosphere, roughly half of which would be re-emitted towards the surface. While there is no agreement on the numerical value of the climate sensitivity for a doubling of greenhouse gases, it is pretty firmly established that the GWP of H20 is more powerful than an equivalent weight of CO2.
Evaporation of water is an endothermic phase change; the extra thermal energy is carried aloft where some of the thermal energy is shared with the surrounding gases through collisions; more IR is emitted when the water vapor ascends to an elevation that allows it to condense, which is an exothermic phase change. Basically, what I’m describing is a delay-line that reduces the rate of loss of thermal energy from Earth. We also don’t know how much heat energy was injected into the stratosphere and upper-troposphere by the solid and liquid ejecta.
That’s a lot of explanation without addressing the question I asked.
The back radiation argument doesn’t cut it. Are you saying back radiation from the lower stratosphere WV can warm the ocean at depth?
The world ocean SST is 6°C warmer than world T2m, and the tropical ocean SST is 1.7°C warmer than tropical T2m, so how does the colder atmosphere warm the warmer ocean, especially at depth?
How can CO2 or stratospheric water vapor warm the ocean?
That is the question no one answers here.
Why is it so hard to understand sunshine warms the ocean at depth?
The question you asked is quoted immediately above.
To suggest that I was claiming that “back radiation from the lower stratosphere WV can warm the ocean at depth” indicates a problem with reading comprehension. To put it more simply, reducing the rate of cooling can result in a net increase in the temperature of the mixed layer above the thermocline. The back radiation will increase the temperature of terrestrial cover and the air over the ocean surface, and the temperature of the rainfall, particularly over the tropics. It is a problem of the net result of several feedback loops that include mixing rates and cooling rates. You seem to be implying that the only way that the measured temperatures of the troposphere can increase is by exogenous input of more thermal energy. The same net effect can be achieved by less cooling whereby the equilibrium is disturbed and the future temperatures are warmer than anticipated, based on past cooling rates. Your model of SSTs and atmospheric temperatures, which don’t take into account sampling biases, particularly the impact of humidity on air temperatures, and the differences in the Specific Heat Capacity of air and water, demonstrate a model that is too simplistic to be useful.
A regression value of 28% is not compelling but OK for the few hours I spent on it.
The Tropical Pacific phases are considered so important to seasonal weather globally that it is something I would like to grasp better.
On the other hand, the observed changes in weather that are associated with the Pacific phases may be better understood by focusing on changing sunlight. Southern Australia currently heading for a very warm summer, which is better explained by the high heating season of late 2025 than the Pacific phase.
Please see my answer to Clyde below regarding significance.
You mean that it is not CO2?
I think that you are reading too much into the hypothetical causality. An R^2 value of 28% says that only 28% of the variance in the El Nino Index is predicted or explained by the Solar Intensity. One can almost double that by flipping a coin to predict the El Nino Index.
That is really not the point Clyde.
There were December Niño34 spikes 10 consecutive times coinciding 10 times with an ASR increase between 20N and 10N.
This was one more instance (ten) than the nine times the eastern tropics flipped from negative to positive anomalies and back again in sync with solar cycle minima to maxima to minima, prior to cycle #25 (see below). This finding was only limited by the span of available ocean data.
The odds against that happening nine times in a row w/o solar cycle influences are 1.6(10^19):1, ie, impossible.
The odds of Niño34 spiking without an increase in ASR from 10N to 20N are actually higher than that over ten instances. Therefore it was impossible for Niño34 to spike those ten times without the regular ASR increases in 20N over 10N.
The p-value for both those circumstances is very small and very significant. That is how you turn a low R^2 into rock solid science.
In my case I tested this relationship at the onset of solar cycle #25 successfully, ie, it happened again. The eastern tropics warmed again from the SC#25 minimum to the maximum, like it had before during previous solar cycles, confirming the test.
I’m reminded of the remark that “once one sees a redwood, they have seen them all.” It seems that you are saying that all El Ninos are the same, when obviously some are stronger than others. In particular, not only was the 2024 peak stronger than typical as measured by the range of the pre-El Nino base-to-peak, but also the width of this event is anomalous. It appears to me that there were two different mechanisms at work, that were coincidentally consecutive or co-existing.
OK, I can accept that the 28% R^2 is statistically significant with respect to being temporally related. But, that doesn’t mean that the magnitude is directly related. I think that it is expected that the correlation will be reduced for a particular variable, if there is another variable that is also influencing the behavior.
WoW! A detailed look at not only the earth, but at the solar system also. Thank you very much for providing this information.
Climate science has been deficient in analyzing climate change because they try to discern changes based upon averages of temperature driven by CO2 and trends based on those averages. Doing so only results in circular logic and confirmation biases.
The sun and orbital mechanics in the solar system provides the heat to warm the earth. Those must be adequately analyzed before proceeding further. Those scientists who rely on a flat earth, multiplying by the albedo, and dividing by 4 are simpletons who refuse to use trigonometry and calculus to do a proper analysis and determination of how the sun/earth changes are the starting point, not CO2.
“simpletons who refuse to use trigonometry and calculus to do a proper analysis and determination of how the sun/earth changes are the starting point, not CO2.”
Fools who believe in simplistic TOA calculations that assume the imbalance is due to CO2 while ignoring the complex internal dynamics and measured increases in solar radiation reaching the surface can only be explained by idiocy or fraud.
Do you believe the Earth receives 552 W.m-2 from the Sun at TOA? Do you believe the total energy delivered to the Earth in one year is 552 W.m-2 * 510e12 m2 * 31.56e6 s = 8.9e24 joules?
So says the guy who doesn’t know how to use trigonometry and calculus to calculate how much energy the Earth receives from the Sun.
The reduction in clouds during the modern warm period has dramatically increased the amount of solar radiation reaching the surface and heating the oceans to depth. It’s scientific fraud to pretend the solar contribution to warming is negligible.
I broadly agree with this.
But the solar heating of oceans would not cause the observed decadal changes in ocean heat content. The only way the oceans retain more heat at depth is to depress the thermocline. More precipitation in the region of the Ferrel Cells will do that. That is caused by more atmospheric heat advection from the tropics.
How is that? If there is more light penetrating the water column, why wouldn’t the temperature of the water increase?
“But the solar heating of oceans would not cause the observed decadal changes in ocean heat content. The only way the oceans retain more heat at depth is to depress the thermocline.”
The ocean takes predictable decadal warming steps from ASR during lower albedo states related to La Niña conditions occurring just prior to and during high solar cycle irradiance, which allows for warming the ocean at depth, where some of the ASR is retained as higher OHC after the solar cycle maximum.
Global warming is just a long series of such steps.
“The only way the oceans retain more heat at depth is to depress the thermocline”
You have causation backwards. Solar radiation directly changes the thermocline. So does wind.
Wish I had time . But , I’m noting it in my https://cosy.com/DailyBlog.html as reference .
Jennifer Marohasy has made some interesting comments on the cycle of the moon relative the ecliptic .One thought that occurred to me is that if the Earth were not tilted , both poles would likely be permanently frozen with calculable consequences .
One analysis I’ve yet to see is the annual 4.5c variation from peri- to aphelion in our orbit’s radiative gray body temperature of ~ 278.6k .
The JPL Horizons data that this analysis is based on will have the moon caused nutation of Earth’s axis. It shows up in the declionation.
Thank you RickWill. Very interesting.
“Earth’s orbit around the barycentre of the solar system and the Sun’s movement relative to the barycentre causes a continually evolving geometric relationship between Earth and Sun.”
“There is no gold standard for the prediction of solar activity but there is good correlation between solar activity and the variation in the velocity of the Sun relative to its average velocity.”
Question: The “velocity of the Sun” – is it a varying tangential velocity in an orbit around the barycentre, or is it a rate of change of distance from the Sun to the barycentre?
The Sun’s orbit is quite erratic. The average velocity is around 11m/s, the peak velocity about 14m/s and minimum 7m/s. The JPL determined orbit does not always encircle the barycentre. The JPL orbit velocity determination gives quite good relationship with solar activity.
The plasma at the surface of the sun has to accelerate and decelerate as it rotates at about 2000m/s around the centre of mass. The solar activity appears to have some momentum component in addition to just the velocity variation of the centre of mass.
Thank you.
I have a problem when people start using orbital energy to make a planet or sun do something, (eg WORK has been done on it).
If work is being done to a planet or even the Sun, then something is losing energy. If the work is sufficient to stir up solar flares, etc, etc, then where is the energy coming from?
If from the orbits of the planets, then they must be losing energy. Is there orbit decaying. This should be easily verified, Tycho had some great numbers covering the planets relative the stars. Some energy loss should be visible by now.
So let’s see the changes. Work doesn’t happen for free.
The velocity of the rotating surface would spin up higher than we observe if it was not dissipative. So the fact that the velocity is constrained means there is some gravitational energy being lost. There is a lot of gravitational energy in the solar system. Surface eddies may well be like opening the door to hotter places below the the surface. So the 1W/m^2 or so extra that Earth experiences is still mostly nuclear energy but made accessible by a dissipative precess run off gravitational energy.
I expect the surface velocity is constrained by the pressure wave velocity of the plasma. That would be related to the density.
I believe that much higher velocities occur in the more dense regions of the Sun.
As a celestial body, the Sun is quite different to the other bodies in the solar system its velocity has a speed range up to twice its slowest velocity. So it is being muscled about by the big planets quite a lot.
I have set up a dynamic model of the Solar system starting with Sun-Jupiter and adding planets. With just Jupiter, Sun orbit is close to circular. Add Saturn and the starting conditions need to be reset to keep stable orbit. Likewise with Uranus. Adding Neptune, the Sun stays in stable obit but it is quite different and needs initial conditions reset to get the orbit looking something like the the JPL path. Venus has more effect than Earth but the orbit does not change a lot.
I’m being a little bit silly here but what I read in your statement sounds a lot like a perpetual motion machine. Let’s build generators and just wait for them to spin up higher and then tap that energy.
I’m fairly sure that momentum, (circular in this case), is conserved and like all energy systems, no change will occur unless an external force is applied. And of course. If an external force is applied…… where is the energy coming from?
If the planets are providing it, then their orbits should decay. We’re 4.5B years in and they are still going around, sure they’ve moved but they are not stuck on the suns disk or thrown out of the system.
With regard to the Sun being muscled about by the big planets, would you care to enlighten me on how an orbit of around 12 years can affect the spin rate on the Sun which spins around in about 25 days at the equator and 36 days at the poles. Does Jupitor some how PUSH harder in the middle than the top/bottom?
Note I used the word PUSH because it is spinning faster than Jupiter.
“Jacobshavn, has advanced and thickened”
Isn’t this link out of date? This was a very temporary re-advance (over just a few years) of the glacier but has since resumed its retreat. The temporary slow down of the retreat is dwarfed by the overall retreat, which has accelerated again in recent years. Whatever the main points that the article might present, this particular point is past it’s sell by date. No imminent cooling of the Northern Hemisphere.
That is what the article states. There will be a lot more summer heating before snowfall gets to the level where it is accumulating on more high ground other than Greenland.
The Jacobshavn glacier advance in 2024 was slower than previous decades:
https://phys.org/news/2025-07-tracking-ice-satellite-reveal-glaciers.html
There’s not an equinox in December, there’s a solstice.
Thanks for picking that up. I will correct the original but unable to change this post.
So very many things wrong with the above article, one hardly knows where to begin commenting.
One example, these statements:
“Heat advection from the tropics to the poles is a significant factor responsible for observed weather, climate and climate change. The seasonal variation in sunlight is the primary driver of the poleward advection of tropical heat.”
Since advection is the horizontal transport of atmospheric properties, that above assertion ignores the presence of the large scale atmospheric circulation cells: the Hadley cell, the Ferrel cell, and the Polar cell that are present in both the NH and the SH (see attached figure). These major circulation cells with their vertical circulation components combine with Earth’s rotation (i.e., “Coriolis force”) to produce prevailing surface winds and high altitude jet streams that vary in direction and amplitude by latitude, yet DO NOT provide a uniform transport of heat from the tropics to the poles. Instead, these atmospheric circulation cells provide the means of transferring most of the heat in the atmosphere from the tropics to deep space (radiation) BEFORE that tropical air eventually reaches the polar regions in both hemispheres.
Notably, these major atmospheric circulation cells exist independent of the amount of sunlight falling on Earth year-to-year.
And need I also mention that climate is defined as weather averaged over a specific geographical area of Earth for 30 or more years, not seasonally?
And there is this:
The maximum distance of the Sun’s center-of-mass from the solar system’s center-of-mass (i.e., “barycenter”) is approximately 2.2 times the radius of the Sun, which translates to about 1.5 million kilometers or 0.01 Astronomical Units (AU), varying with the positions of the planets, especially Jupiter. With the Earth having an average distance from the Sun (not the SS barycenter) of about 150 million km, the solar insolation variation associated with that distance-to-barycenter difference would be about ((150 +/- 1.5)/150)^2 = +/- 2%, thus not any significant driver of climate (in comparison, the annual variation in solar insolation of Earth TOA just attributed Earth’s slightly elliptical orbit about the Sun/ SS barycenter cycle is more than three times higher, at about 7%).
There would no circulation if there was no sunlight. The surface water would all be ice. There may be pockets of geothermal heated water.
The article makes the wild assumption that the readers of this site understand that advection is the result of horizontal pressure gradients generated by atmospheric cells. In fact it even mentions the competition across the tropical north Pacific that reverses the trade winds.
The sum is not quite right because you need to look at what happens day-to-day as I have rather than deal in averages. The distance difference is not averaged out every year because the Sun’s orbit is a lot longer than a year. Even your 2% of the sunlight is a lot more real radiative energy than what is speculated from an increase in CO2 from 285ppm to 430ppm. And trends caused by the changing solar and Sun relationship are significant.
Not sure what you are getting at with this comment. It strikes me as the fellow with his feet in the oven and head in the fridge as being cosy on average. The article primarily points out that the NH is facing warmer summers and harsher winters for a long time to come. If you average that out over 30 years you could conclude that the climate is unchanged.
“There would no circulation if there was no sunlight. The surface water would all be ice. There may be pockets of geothermal heated water.”
Is there really any scientific reason to debate that sunlight falling on Earth might go to zero in any given year following the previous one (re: my phrasing “amount of sunlight falling on Earth year-to-year“)? Then too, assuming an instantaneous cutoff in sunlight, do you have an estimate for the number of centuries (millennia?) required for Earth’s oceans to freeze over, considering their mass, the heat capacity of water, and the fact the atmosphere currently provides a fairly good radiation barrier to LWIR off the surfaces of Earth’s oceans going directly to deep space?
“that above assertion ignores the presence of the large scale atmospheric circulation cells:”
You missed my points that (a) the the Hadley cell, the Ferrel cell, and the Polar cell transport surface air (starting near the equator) vertically to high latitude where such air is cooled by direct thermal radiation to deep space, and (b) that the prevailing surface winds underneath the Hadley cells move in a general north-to-south direction in the NH and in a south-to-north direction in the SH, those being opposite to the assertion that advection moves heat (in air) from the tropics to the poles.
“The sum is not quite right because you need to look at what happens day-to-day as I have rather than deal in averages.”
Well, it is you that introduced the subject of climate variations being associated with movements of the Sun about the solar system barycenter with respect to Earth, the limits of which are determined to first order by conjunctions of Jupiter and Saturn.
“In fact, conjunctions between Jupiter and Saturn happen every 19.6 years. Because of the angle at which Jupiter (1.3º) and Saturn (2.5º) both orbit the sun, when they meet up every 19.6 years they will be at varying distances from each other, anywhere from 4º or less.”
— source: https://www.komu.com/weather/the-great-conjunction-planets-visibly-double-up-for-first-time-in-nearly-800-years/article_e1e83f90-39c1-11eb-97da-97372de76aa1.html
So, I’m having trouble understanding day-to-day “happenings” against an asserted fundamental average period of 19.6 years.
“And trends caused by the changing solar and Sun relationship are significant.”
Indeed they are, but I would recommend looking first to inherent variations in solar output (the principal periodicities of the 11-year (Schwabe), 22-year (Hale), 33-year (Bruckner), and 80–100-year (Gleissberg) cycles . . . none of which are close to having a 19.6 year period, and then to more long term variations attributed to Milankovitch cycles.
“If you average that out over 30 years you could conclude that the climate is unchanged.”
I repeat from my previous post: climate is defined as weather averaged over a specific geographical area of Earth for 30 or more years, not seasonally. Thank you.
You have a simplistic view with this. Do what I have done and and take a close look at the movement of the Sun; including its north south motion.
There is a lot more to the solar system than just the Sun, Saturn and Jupiter. Both Uranus and Neptune have significant influence on the Sun’s position. And Venus has significant influence on the Sun velocity.
All the cycles you listed are related to the Sun and Earth’s relationship with it. They are all encompassed in the three variables I have looked at for each day – distance, declination and solar constant.
What do you think causes all the cycles you have listed? The Sun’s orbit is highly erratic – big arcs, tight arcs, lobes – all over the place. The orbit does not always encompass the barycentre.
So you accept that colder winters and warmer summers would NOT be considered climate change by your definition?
IPCCs definition of Climate Change is only what humans cause. I know the climate has always changed and always will and the current observed changes are consistent with changers in the temporal and latitudinal changers in sunlight reaching Earth.
Well, given that you know that, my simplistic view (!) is that there then is little value in pointing out:
1) “. . .the Solar System is chaotic in the technical sense defined by mathematical chaos theory, and that chaotic behavior degrades even the most precise long-term numerical or analytic models for the orbital motion in the Solar System, so they cannot be valid beyond more than a few tens of millions of years into the past or future . . .“
— source: https://en.wikipedia.org/wiki/Stability_of_the_Solar_System
So much for your assertion that the Sun’s orbit is highly erratic – big arcs, tight arcs, lobes – all over the place . . . well, for at least the next ten million or so years.
2) Dansgaard–Oeschger events (decadal-long but otherwise intermittent episodes of multi-°C climate fluctuations, 25 of which occurred in the last glacial period on Earth) cannot be not explained by variations/resonances in Earth-Sun distance, obliquity of the ecliptic, and solar constant.
“Some scientists say that the events occur quasi-periodically with a recurrence time being a multiple of 1,470 years . . . The little ice age around 400 to 200 years ago has been interpreted by some as the cold part of a D-O cycle.”
(ref: https://en.wikipedia.org/wiki/Dansgaard–Oeschger_event )
Editorial note : Apologies in advance. Everyone has their own “pet peeves”, this happens to be one of mine.
It is actually the UNFCCC that defines the usage “climate change (CC) = anthropogenic climate change (ACC), and only ACC”.
Each of the AR6 assessment reports has an identical “Glossary” annex. The following is copied from the WG-1’s “Annex VII : Glossary” entry for the term “Climate change”, on page 2222 :
Note that within the main bodies of the AR6 reports the term “climate change” is usually followed by descriptions of anthropogenic factors. Any “natural variability” is either discounted (WG-1, “The Physical Science Basis”) or completely ignored (WG-2, “Adaptation”, and WG-3, “Mitigation”).
This gives readers the impression that the IPCC uses the “CC = ACC, and only ACC” version, but they can always point to the “Glossary” definition and claim to be more “neutral / not pre-judging the issue” than their parent UNFCCC organisation.
Hmmmm . . .
1) Here, in descending order, is the ranking of the relative gravitational pulls exerted on the Sun with the planets being at their respective perihelion distances (strongest pull) as normalized to Earth’s pull being assigned a value of 1:
Jupiter = 12.5
Venus = 1.53
Saturn = 1.13
Earth = 1
Mercury = 0.56
Mars = 0.05
Uranus = 0.04
Neptune = 0.02.
Thus, one might question the term “significant” when applied to Uranus and Neptune gravitationally affecting the Sun in comparison to Jupiter.
2) Since change in velocity is just acceleration (gravitational pull) integrated over time, and change in position is just velocity integrated over time, every planet contributes to the Sun’s instantaneous position and velocity relative to the solar system barycenter.
The fact that you list the value of the force without the period of rotation indicates you do not understand the meaning of integration.
Velocity is the vector integration of force and position is the vector integration of velocity. So the long periods of the large, distant planets gravitational force in a given arc has more impact on the velocity and position of the Sun than the short period of the inner planets. For example, the net movement of the Sun caused by Venus is close to zero every 265 days. By contrast Uranus has a component of force in one direction lasting 30.000days. And Sun’s position is the double integral of the force vector and time.
I have done the dynamic modelling to assess the JPL starting points and looked at the influence of each planet separately so I know the relative influence.
1) Numerical integration can be performed over any user-chosen interval of time, even for cyclic functions.
2) I ordered gravitational pulls (attraction) based on accelerations at the point of perihelion for each planet’s orbit, not on integrated forces.
That’s it, I’m done here.
Ooops . . . I just noted in a reread of my January 26, 2026 2:50 pm reply above that I accidentally used the wrong word in the fourth paragraph of that post, as corrected here:
“You missed my points that (a) the the Hadley cell, the Ferrel cell, and the Polar cell transport surface air (starting near the equator) vertically to high
latitudealtitude where such air is cooled by . . . ““is cooled by direct thermal radiation to deep space,”
Thermal radiation requires kinetic interaction of molecules. Space has no such molecules and therefore thermal radiation to space is nonsense.
I realize the so call climate scientists have bastardized definitions employing social/common context drive definitions, ignoring precise scientific definitions.
Simply not true as regards the term “kinetic interaction” and “molecules”. A single helium atom at a temperature above absolute zero will emit thermal radiation without any physical interaction with another atom or molecule. The timing and rate of such thermal radiation is governed by statistical quantum mechanics.
“Thermal radiation is electromagnetic radiation emitted by the thermal motion of particles in matter. All matter with a temperature greater than absolute zero emits thermal radiation.”
(source: https://en.wikipedia.org/wiki/Thermal_radiation )
Now, you were saying something about “ignoring precise scientific definitions”?
Finally, you seem to be hopelessly confused by the phrase “radiation to deep space”.
A far too common misconception. The principle you cite refers to “condensed matter” only.
I understand you will disagree. That will persist until you rectify your ignorance.
The explanation in this link can provide an antidote for you.
https://www.perplexity.ai/search/a7b25f20-dbdf-4295-8ffb-ce52407a2557#0
You are right to the extent that the word “temperature” does not have meaning for a single isolated atom. Instead, I should have referred to a single helium atom at an energy level above its ground state being able to emit radiation without any physical interaction with another atom or molecule.
BTW, your link doesn’t work on my computer . . . I guess it needs an antidote.
And how does a helium atom get elevated above its ground state?
If you cannot figure out how to open that link, I don’t know that you can be helped. That would mean you cannot access Perplexity AI.
here is the text:
The Probability of Spontaneous Thermal Radiation Emission from an Isolated Helium Atom
The question contains a subtle but fundamental conceptual problem that requires careful unpacking. The answer depends critically on what is meant by “thermal radiation” in the context of a single, isolated atom.
Ground State Stability and Energy Conservation
An isolated helium atom in its ground state (1s² configuration—the lowest possible energy configuration) cannot spontaneously emit radiation of any kind, including thermal radiation. This follows directly from energy conservation and the quantum mechanical structure of atomic states. The ground state is defined as the stationary state of lowest energy in a quantum system. Crucially, energy eigenstates are stationary states—they do not evolve in time if the system is isolated. A transition from the ground state to a lower energy state is impossible because no lower state exists.[wikipedia +1]
Spontaneous emission, as a quantum process, is well-defined for excited atoms making transitions to lower-lying states. However, the ground state has zero probability of spontaneous decay because energy conservation forbids a transition to a nonexistent lower state. The existence of a decay rate (the Einstein A coefficient) is contingent on an available lower state to which decay can occur. For a ground state atom, this decay rate is precisely zero.[arxiv +3]
The Conceptual Problem: Single Atoms and Thermal Radiation
The more fundamental issue is categorical rather than merely quantitative. Thermal radiation, by definition, is not a property of isolated individual atoms.
Thermal radiation is electromagnetic radiation emitted by matter due to its temperature, described by Planck’s law and the Stefan-Boltzmann law, both of which explicitly depend on the absolute temperature T of the emitting object. Temperature itself is a statistical concept—a macroscopic property that characterizes the average kinetic energy and energy distribution of a large ensemble of particles in thermal equilibrium. A single, isolated atom has no temperature. It is not in thermal equilibrium with any bath; it is an isolated quantum system with discrete energy levels.[lco +4]
Thermal radiation arises from the random thermal motions of charged particles in matter, which collectively produce an ensemble of photons with a continuous spectrum characterized by the temperature. The Boltzmann distribution gives the probability that a system in contact with a heat reservoir at temperature T will occupy a given energy state; this presupposes an ensemble of systems and a defined temperature. None of these conditions apply to a single, isolated helium atom.[wikipedia +2]
Helium’s Metastable States: A Clarification
Helium has metastable excited states. For instance, the 2³S₁ state is the longest-lived neutral atomic state known, with a lifetime of approximately 7,800 seconds. If an isolated helium atom were somehow excited to this state, it would eventually undergo spontaneous emission and decay to the ground state with a calculable, non-zero probability per unit time. However, this is spontaneous emission from an excited state, not thermal radiation from a ground state atom.[link.aps +1]
Quantitative Answer
The probability that an isolated helium atom in its ground state will spontaneously emit thermal radiation is exactly zero. This is true for two independent reasons:
1. Quantum mechanics: The ground state is an energy eigenstate with no lower state available; decay is forbidden by energy conservation.
2. Thermodynamic definition: Thermal radiation is an ensemble property requiring a defined temperature; it is logically inapplicable to a single, isolated atom.
The question appears to conflate spontaneous emission (a real quantum process for excited states) with thermal radiation (an ensemble property dependent on temperature). These are distinct physical phenomena, and their conflation obscures the underlying physics.
This is commonly reflected by changes in the the energy levels of electrons in the various distinct orbital “clouds” (i.e., s, p, d, f . . . orbitals) that can store energy above the “ground state” (lowest possible energy energy state) of an uncharged atom, as correctly stated by the Perplexity AI you quoted.
I freely admitted, in correcting my previous post, that there could be no spontaneous radiation from a single helium in its ground state, as well as admitting that I incorrectly used the word “temperature” instead of the phrase “excess energy” (there, I said it again). But I never actually referred to my hypothetical, radiating single helium atom being in its ground state (instead implying that it had excess energy from being previously warmed nearer Earth’s surface).
There are many means by which electrons in orbitals can be raised above the atom’s ground state . . . perhaps Perplexity didn’t have time to mention this (/sarc) . . .
(here is Google’s AI response FWIW)
“An atom’s electrons can be boosted to higher energy orbitals—a process known as excitation—through several distinct physical mechanisms that provide exactly enough energy for a “quantum leap” without reaching the threshold for ionization.
The primary processes include:
Photoexcitation (Absorption): An electron absorbs a single photon of electromagnetic radiation. For this to occur without ionization, the photon’s energy must exactly match the difference between the current orbital and a higher, still-bound energy level.
Collisional Excitation: High-speed particles, such as other atoms or free electrons, strike the atom and transfer a portion of their kinetic energy to its bound electrons. This is the process that drives the glow in neon signs and auroras. {TYS: note neon, like helium, is a monatomic}
Thermal Excitation: In high-temperature environments, frequent high-energy collisions between atoms provide the necessary energy to maintain a population of electrons in higher orbitals.
Electric Field Acceleration: Electrons can be “pushed” into higher energy states by strong electric fields, such as those inside a Light Emitting Diode (LED) or a discharge tube, which accelerates the electrons enough to jump orbitals.
Raman Scattering: An inelastic collision where an incoming photon transfers only a fraction of its energy to the atom, exciting an electron to a higher orbital while the photon continues on with a lower frequency.
Multi-Photon Absorption: In rare high-intensity scenarios (like laser pulses), an electron can absorb two or more lower-energy photons simultaneously to reach a higher state that a single photon could not reach.”
Thank you for asking your question.
As Sparta told you;
“Thermal radiation” is what occurs when an object absorbs or emits EM waves. The EM energy when absorbed causes a thermal temperature change, and likewise, emissions of EM energy causes a thermal temperature change. Energy can also be transferred via collisions which is another type of ‘thermal” transmission.
The emission to space is not “thermal radiation”, it is simply EM wave radiation. It will go on forever until encountering an object that absorbs it.
There are three things that can occur when EM interacts with a body. Absorption, reflection, or transmission. Would you call a reflection “thermal radiation”? Would you call transmission through a body ‘thermal radiation”. Visible light can start a fire using a magnifying glass. Is that thermal radiation?
I already admitted my mistake is using the term “thermal radiation” instead of “radiation of excess energy” in reference to a single isolated helium atom being above its ground state (see many posts above).
Nevertheless, at the top of the troposphere and even higher altitudes, where most of the atmosphere’s broadband EM radiation of thermal energy occurs, the atmosphere is still considered be a continuum regime (per his previous comment, Tom Shula apparently would prefer I call it a “condensed matter” state) with constant molecular and atomic collisions occurring, and thus considered to have a sensible temperature.
No, the point you miss is that gases are not condensed matter. Apparently you have no formal physics training to understand this.
Apparently you missed (or ignored) this:
“The name ‘condensed matter physics’ emphasized the commonality of scientific problems encountered by physicists working on solids, liquids, plasmas, and other complex matter . . . Irish chemist Thomas Andrews studied the phase transition from a liquid to a gas and coined the term critical point to describe the condition where a gas and a liquid were indistinguishable as phases . . .Ultracold atom trapping in optical lattices is an experimental tool commonly used in condensed matter physics, and in atomic, molecular, and optical physics. The method involves using optical lasers to form an interference pattern, which acts as a lattice, in which ions or atoms can be placed at very low temperatures“
(source: https://en.wikipedia.org/wiki/Condensed_matter_physics , my bold emphasis added)
Richard,
You and I are much the same age. You have authored a technical article with several interactive variables and a plausible general conclusion. In contrast, my brain will need many hours/days of study of your article before I dare make a technical comment here. Might I suggest that other readers also do a lengthy study before commenting because off-the-cuff comments have a high probability of being wrong or missing the complete picture to arrive at the comment.
This article is one of the few physics based articles I have seen that seriously challenges the main current wisdom of the theory of CO2 as the dominant driver of climate change. I have been challenging this current wisdom since 1992, indicating that this article is rare and deserving of close study because there are enormous global economic consequences if Richard’s article grows into most likely correct status. (The CO2 driver theory has failed most of its predictions on reaching their use-by test date. It was always heavy with poor science and subjectivity.)
Congratulations, Rick. Geoff S
(Disclosure: Richard and I have had several hours of face-to-face discussions in the last 6 months. However, a written article is needed to illustrate the complexity of the derived patterns, some of which are new to me.)
Geoff, unfortunately, after about 3 days, very few people will read any articles here. If you don’t get your replies in early, then few people will ever see them.
Yes, three days is about the limit.
“Changes in seasonal solar intensity and corresponding increase in poleward advection in both hemispheres readily explain this warming trend. Increasing poleward advection also explains the increasing snowfall across the NH with 2025/26 winter predicted to have above trend snowfall per Image 1 as an example of heavy snow.”
Overall Rutgers NH snow cover anomalies were negative for the last several years, including 2025, although this doesn’t preclude heavier record snows in many areas producing positive anomalies.
Heavy record snows this winter in coastal Russia and Alaska were local severe snow events, related to the North Central Pacific subsurface SST being very warm.
Note below the NC Pacific subsurface SST was near the zero anomaly at the solar minimum then steadily warmed with depth, showing seasonal warming patterns, peaking at peak TSI, now declining.
This indicates both seasonal direct sunlight warming of 35°-50°N and poleward advection, and OHC accumulation between seasons were all related to the solar cycle, in addition to the orbital changes.
This article updates the previous work and includes the solar activity. Something you have been looking at for some time.
Including the solar activity brings the predictions closer to observations.
SC26 will have a slight higher peak than SC25.
Too early to say if 2025/26 will be above trend area overall but it is shaping up as an impressive year for snow overall. There will tend to be more rain in lower altitude early season. But high ground will get more. This boreal winter, the Himalayas had early record snow. Later in the the year we will see how Greenland ends up.
How could the IPCC ignore the solar and geometric varriables when many anomalies exceed the puny 2-4 w/m2 for ECS.
Consider: TOA insolation varies by a total of 7% just due the unavoidable difference between Earth’s aphelion and perihelion. Against the scientifically-measured solar insolation of about 1361 W/m^2, that is a natural annual variation is 95 W/m^2.
Beyond that, one can consider that about half of Earth’s total albedo is due to cloud coverage (ref: https://journals.ametsoc.org/view/journals/atsc/6/4/1520-0469_1949_006_0277_taotpe_2_0_co_2.pdf )
but yet scientists do not know even today if the net effect of varying clouds (monthly or even annually) is to create warming or cooling of Earth’s lower atmosphere and surface.
And yet some want to seriously debate about ECS in terms of a couple of watts per m^2???
Have to agree with all that and add that it is the latitudinal shift of that 95W/m^2 over short and long periods that defines seasons, weather and climate.
The Earth orbits the Sun, not the solar system barycentre. Is this just a wording issue in the way the sentence was formed.
If in doubt, consider that the Milky Way galaxy and the Andromeda galaxy are in orbit with each other, (a collision pending too). There must be a barycentre point between the two, Earth doesn’t orbit that barycentre, so why would it orbit the solar system barycentre?
Leap years affecting the distance of the Earth to the Sun? How is this possible. We have leap years to ensure that a calendar date appears in the same relative position, (Sun angle to the background stars), and doesn’t drift over the years. How can this possibly affect the distance to the Sun. Out of the blue, we could have have a two year leap every 8 years, surely then the distance would jump at 8 years and not 4.
I think the NASA data for the distance must surely be wrong on this aspect.
Can you clarify the above two points please.
I have checked the JPL derived orbit of the Sun and it is accurate as far as I am concerned. The Sun velocity correlates well with the solar activity.
The barycentre is the time average centre of mass of the solar system. The Sun does not always encircle the barycentre. I doubt you could distinguish if Earth predominantly orbits the Sun or the barycentre. Mars could well be closer to a moon of the Sun than a planet. Venus has a lot of influence on the Sun velocity and solar activity (the apparent spikes) but not much influence on its position. By contrast Neptune does not have much influence on the Sun velocity but it does influence the Sun position. The time of pull in a particular direction can be amore significant that that actual force.
Earth’s orbit of the Sun takes very close to 365.25 days. So if you start the year at the beginning of a day. it means you gain 0.25 days every year. The calendar gets corrected every 4 years. So doing the daily anomaly from year-to-year means that there is a difference of 0.25 days between years until the leap year reset. Tho up to 0.75 days difference can be significant particularly in high latitudes.
Earth also has a north-south component in its annual orbit due to Jupiter’s influence that might compound the change but I have not looked close enough to isolators that.
Rick,
The data you are quoting has a blip every four years. The calendar is a human construct. So why does the NASA data have a four year blip?
If we had an eight year corrective cycle, the blip would be eight years apart. Surely the effects of our notional calendar cannot affect the measurement.
Something is wrong with the data if it shows an effect associated with an arbitrary allocation of an extra day, (which could have landed in any year, imagine if my calendar had a leap year allocated 2 years after the norm). Would a NASA in my calendar have different data?
The NASA data does not have a 4 year blip. It comes about because I reset to a whole day each year while the orbit is gaining 0.25 days each year and the NASA data only realigns every 4 years..
When I determine the anomalous daily value I do it for day of the year not the date. So any day of the year after end of February will have a different date in a leap year compared with a non leap year.
To remove the step. I would need to set time step to 6 hours and that increases the data tremendously.
I have gone as low as 1 hour time step to study the dynamics of the surface but I get less than a Jupiter orbit with the download limit set by Horizons.
From the article. Your words I believe.
I’d still like to know WHY the distance to sun has a 4 year blip. Surely, no matter WHAT time interval you scan at, the distance from one day, (even if you jump an extra day every four years), is going to be very similar to the last and equally the next reading.
If a jump occurs due to leap years then the data is wrong or it’s time to check the sums.
Earth, just like the Sun, is gravitationally affected by the combined gravitational mass of the solar system. According to Newton’s law of gravitation, the center of gravitational attraction for any spatially distributed body (or system of discrete bodies) can be consider to be the “instantaneous” position (aka “point source”) that is the center-of mass of such (see https://en.wikipedia.org/wiki/Center_of_mass ). Because over 99.8% of the Solar system’s mass is contained in the Sun, it is common to think that the Earth “orbits the Sun”, but in reality the Earth “orbits the Sun” only because the Sun is itself in a much, much smaller orbit about the barycenter of the solar system. Note that the solar system barycenter is not “fixed” in inertial space, but is varying in position in response to the movement of the Sun and all the surrounding planets. Sometimes the barycenter of the solar system is inside the photosphere of the Sun . . . sometimes it is outside of it.
To suggest that we are orbiting an average point has several problems. Consider a two sun system. One is 10 light years away from the other. The barycentre of that combination is 5 light years away. Yet the planets that orbit one of the suns would trace out a path that shows up as a singular orbit around the closest sun. If it traced out an orbit around the barycentre, then that planet is due to be in an orbit that will take it between the two suns. It will be in deep dark space for a very, very long time.
Strangely we don’t observe this feature.
If you look at the gravity well concept, (see relativity sketches), you’ll notice that the depression of the large mass object is NOT at a balance point between two massive objects, it is instead centred ON the mass. The orbits follow a line around the massive object.
We may be pulled around slightly by other bodies but we are orbiting the Sun. Why do people say that we are orbiting a point in space where no mass exists?
“Yet the planets that orbit one of the suns would trace out a path that shows up as a singular orbit around the closest sun.”
In that one sentence you have defined the condition that ELIMINATES the possibility of a single planet orbiting the barycenter of a two-star system.
There is simply no physical requirement (in either Newtonian physics or under relativistic physics) that in a two body system either body must orbit a point where mass exists. For example, binary star systems almost always have each star orbiting a point in space far removed from each’s photosphere.
BTW, there are problems with renaming the center-of-mass of a body, or a system of separate bodies, as an “average point” . . . do you mean “average” in position, average in “time”, or average in “mass”, or some combination of all three?
Please tell me what Newton might have been implying about the forces of gravity between two bodies, M1 and M2, the last time I looked, the force calculated was established by magnitude, (see his equation), AND direction, being on a line pointing between the two. How can this result in an orbit around a third point, (unless that point is on the line between the two).
As I pointed out in several other comments. When it comes to anything of significance, we orbit the Sun, not the barycentre between our galaxy and another, etc, etc.
And the reference to average was there to allow for the combination of the masses, taking into consideration their mass multiplied by distance and calculating the point where the sum of all mass by distance calculations would result in a zero nett effect. eg It is not just a singular two body equation, it is multiple. Average seemed a fair word to use, but if you like I can write it out long hand for you.
“Please tell me what Newton might have been implying about the forces of gravity between two bodies, M1 and M2, the last time I looked, the force calculated was established by magnitude, (see his equation), AND direction, being on a line pointing between the two. How can this result in an orbit around a third point, (unless that point is on the line between the two).”
What you say about Newton’s famous formula for gravitational attraction is true . . . but you fail to understand that Newton never applied his theory of gravity to the determination of orbits of bodies in space vacuum, that came much later with Kepler.
It is Kepler laws of orbital mechanics that determine the exact paths of celestial bodies that orbit each other and that establish, for a system of two or more distinct objects, where the barycenter of their orbits is located.
If you want a very simple, current example of how a body in a multi-body system in space can be gravitationally-bound to orbit “just a void in space”, look to the subject of Lagrange points in the Sun-Earth-Moon system (ref: https://en.wikipedia.org/wiki/Lagrange_point ) and especially the situation where the James Webb Space Telescope is currently in a “halo orbit” about the L2 point.
Because that is more accurate than saying Earth orbits the Sun. The Sun is within Earth’s orbit but Earth’s orbit is influenced by a number of other bodies in the solar system.
If the Earth tracked around the same path each year, then its distance to the Sun would not change on any specific day of the year one year to the next. But the distance does change as I have shown.
We are in an elliptical orbit with precession of course the distance changes on a day to day basis, year to year.
Just so.
Eccentric elliptical orbit.
Over the eons, that orbit becomes more circular and again less.
“Eccentric elliptical orbit” . . . coming directly to you from the Department of Redundancy Department 🙂
This is an ideal example not real world. Put in other “depressions” for Jupiter and Saturn especially.
Remember, gravity and orbits are vectors. They are all additive. Also, remember the sun is dragging us thru space at ~450,000 mi/hr.
Say what?
A gravity vector is easily defined, but no so for an “orbits vector”.
True, one can assign a velocity vector for an orbiting body, but such is then continually varying in magnitude and direction for an elliptical orbit. However, in Keplerian orbital mechanics/dynamics it is most common to talk in terms of the (constant) angular momentum vector associated with body in an orbit around another object, but that vector is perpendicular to the orbital plane.
As to “they are all additive”, that is not true unless the vectors have the exact same units. For example, a gravitational vector in units of ft/sec^2 cannot be added to a velocity vector in units of ft/sec or to a angular momentum vector in units of kg-m^2/sec.
well.. let me correct the basic errors of the assay.
1 First the Sun-Earth distances change not so simple as the author presented, but have substantial variations over 2200 years – so called Hallstatt’s cycle.
Here are examples of variations of the Sun-Earth distances taken from the official ephemeris of the same nasa system or Paris-meudon observatory. https://solargsm.com/wp-content/uploads/2020/08/Appendix-1.pdf.
As a result the solar irradiance also changes over the two millennia like this one
https://solargsm.com/wp-content/uploads/2020/07/Appendix-2.pdf.
the effect if these variations on terrestrial temperature are discussed in the book chapter https://www.intechopen.com/chapters/75534. These variations cause the global warming observed from 1700 onwards.
currently though this global warming is interrupted by reduction of solar activity caused by grand solar minimum that in turns leads to a decrease of the terrestrial temperature and appearance of little ice age as it was during maunder minimum
.https://www.tandfonline.com/doi/full/10.1080/23328940.2020.1796243.
we see the evidences this year sll
over the world include snow blizzards in us, Canada, Siberia and Europe.
The JPL is the NASA group that produces the ephemeris.
You may have read the article as simplistic but it considers the daily insolation across latitudes caused by Earth’s relationship with the Sun and the solar activity of the Sun. You cannot get any more complex than that.
The rest is wrong. The Sun is just part the peak of SC25. The northern Hemisphere summer tied with 2024 for the hottest evah. The Southern Hemisphere is current warming up as expected because it had above trend sunlight during the heating phase. Parts of Australia are forecast to set close to or record temperatures this week.
Of coarse I don’t understand everything in this post but we have been told for decades (before CAGW became an issue) that there are many natural systems that influence what we on earth experience. That all of these natural systems must be taken into account before we claim CO2 as the cause of rising average global temperatures. Richards post addresses a few of them that in my mind eliminate CO2 as the control knob for earth’s climate. CAGW is a dead horse in my view.
Richard, I applaud you for the time and effort you obviously expended to obtain, process, and analyze the data to prepare this summary. Now that you have found the data sources, codified the necessary algorithms, and done the numerous comparisons to find the maximum and minimum latitudes and dates, your next update should be less time consuming.
I would therefore like to suggest that, for your update, you try to determine the uncertainty of the individual data points and trends that you have graphed so that we can assess the weaknesses of the available data and see where the research needs to be focused to improve the results.
Thank you for all the work you have done!
Clyde
You make an extremely salient observation and suggestion. This article is just where I am up to. I keep getting into rabbit holes that are not always productive.
I have made efforts to verify the JPL data and I have some niggling doubt about their initial positions for the Sun. I figure it is not easy to accurately locate the centre of mass of the Sun or its velocity to verify the JPL calculations. They are displayed with great precision but I do not know the error. I have altered the starting velocity and initial position of the Sun at any chosen point and still have the Sun in a stable orbit but I keep coming back to what JPL has produced.
I believe there is merit in competing groups undertaking solar system dynamic models but It requires substantial computing power to include all the celestial objects they have included. The other aspect is to be able to measure the position of the Sun and its velocity to high accuracy at any point in time. That could be used to correct for any modelling errors. JPL have made updates from time-to-time.
I have looked at very simple model of a small mass orbiting at the equator of the Sun but elastically connected as in a plasma soup and observed that its speed accelerates uncontrollably under the long periods of acceleration caused by Jupiter’s approach to Saturn. I therefore concluded that Sunspots are likely related to surface and deeper turbulence caused by the acceleration. Probably surface shearing as well due to the differential velocity across eddies. I may do an article on that aspect..
My solar constant prediction could easily be out by 1W/m^2 on a daily basis because I work on monthly averages rather than the daily swings. Monthly sunspots correlate best to monthly velocity difference from average velocity. I get best correlation with solar constant and velocity looking at Sun velocity daily but the data for this article was based on monthly averages.
I will continue to improve my understanding of the Sun and look for weather observations that are explained by solar changes.
versus
(your comment of January 26, 2026 4:08 pm)
By stable orbit I am referring to sequentual paths crossing previous tracks. An unstable orbit is when the Sun moves out of its orbit at ever accelerating pace.
OK . . . so you say . . . but what are your meanings of “highly erratic” and “all over the place”?
Excellent, Rick!
It’s pretty straightforward and simple to settle the dooming once and for all. Just measure the temperatures and if they’re up we’re doomed-
Post offices, police stations and airports claim Australia’s heat records
Let’s have a look at one of those State records-
The hottest day on record in NSW was January 11, 1939, when temperatures hit 50.1 degrees at Wilcannia Post Office.
That would be this old PO corner of Reid and Myers Streets by the river-
Wilcannia – Google Maps
Whereas now the weather station is now at Wilcannia Airport to the North off that big bitumised plane turnaround area by the looks-
https://maps.app.goo.gl/GEoiLuY9bGZu8C9u8
Now check the airport automatic 10 minute reported temperatures-
Oz Forecast – Wilcannia Airport Weather Station, NSW
From 14:30 to 14:50 the apparent temperature jumps up nearly 3 degrees in 10 mins and back down again in the next 10 which makes you wonder how any critter can handle it without being doomed.
This was a good discussion of solar dynamics.
What we need is a theory that explains the 2.0C cooling that took place from the 1930’s to the 1970’s, and the subsequent 2.0C warming from the 1980’s to the present day.
I haven’t seen that theory yet. Rick hinted previously that his theory might cover that but did not flesh it out enough to show me it would apply.
??? Puzzled….. Not one of those forecasts is anywhere near a record temperature.
And the Wilcannia temp in your bottom link below only reaches 47.7C at 14:40 (and 48C at 16:00)
This is well short of the 50.1C in 1939
Here in the Hunter, it was never anywhere near even being called “hot” day, only getting to 28C
Thanks so much for this fascinating presentation…lots to work through and a sobering conclusion. Keep up the good work…looking forward to the sequel! I don’t think I want to be around for the next Ice Age!
When the next period of glaciation returns, how soon will we have direct evidence that it is happening, evidence which cannot be denied or explained away?
For example, will another Glacial Lake Missoula form when a massive ice dam eventually blocks the Clark Fork River in northwestern Montana?
Will there be a repetition of the series of catastrophic floods which occurred whenever an ice dam broke and was then slowly replaced by a new one as the Cordilleran Ice Sheet moved south to once again block the river?
I’ve got a geology book published in 2001 entitled ‘Glacial Lake Missoula And Its Humongous Floods’ by the late Dr. David Alt, Professor Emeritus of Geology at the University of Montana.
In his book, Dr. Alt recounts the intense debates which had occurred in the academic geology community between the early 1920’s and the late 1950’s concerning the genesis of the channeled scablands of eastern Washington State.
The work of J. Harlan Bretz starting in the early 1920’s in proving the existence of these catastrophic floods was being strongly challenged by the Academic Powers That Be of the time. That debate continued into the late 1950’s long after it should have ended.
In his book from 2001, Dr. Alt notes that regardless of all the current talk of global warming, the return of another period of glaciation is all but certain, and that we will have thousands of years of warning to get prepared for it.
But a thousand years from now in the year 3026, when evidence of a return of glaciation cannot be denied, what will the professors who control academic discourse at the University of Montana be saying about the claims of catastrophic anthropogenic global warming which were being made in the decade of the 2020’s?
Will they be saying the same thing about AGW that U of M professors are saying today in the 2020’s, while ignoring the unmistakable evidence of previous ice ages — a series of Glacial Lake Missoula shorelines — sitting right up there on the hill directly behind their academic ivory tower?
And, more to the point, will those ivory tower professors still be ignoring the implications of that powerful evidence for the existence of natural climate variation?
To repurpose the Clinton campaign slogan…
It’s the sun, stupid!
It’s NOT the variability in the Sun itself, it IS the temporal variability in the solar energy absorbed by the Earth versus the amount radiated from Earth to deep space.
Let’s not rely on unscientific slogans, especially any repurposed from Bill Clinton. /sarc
A wonderful post, thank you.
Your chart 8. Sea surface temperature is primarily controlled by two main factors. The source of the current, and the temperature of the air that passes directly over.
During more active the convection periods in the equatorial region, the cooler the sea surface and 2 meter temperature south of 45S becomes. It has little to do with solar input. It is a function of atmospheric dynamics.
All of that cooling comes from Antarctica.
Regards
Martin
I’ve been following the changes in Jacobshavn glacier – what role do you think changing sunlight patterns play in its advancement? 🌞