By Charles Rotter and Anthony Watts
Weather and climate both operate through natural oscillations—recurring rises and falls that resemble overlapping sine waves rather than straight-line trends. Daily and seasonal weather patterns are the most familiar examples: temperatures warm and cool, storm tracks shift from north to south and then back, and atmospheric pressure systems migrate in predictable cycles. These regular patterns demonstrate that even the “short-term” atmosphere is inherently rhythmic, shaped by the Earth’s rotation (Coriolis force), tilt, and uneven solar heating.
On longer time scales, climate is driven by larger oscillatory systems such as El Niño/La Niña, the Pacific Decadal Oscillation (PDO), and the Atlantic Multidecadal Oscillation (AMO). Each of these produces alternating warm and cool phases with significant impacts on global weather—affecting rainfall, drought, hurricanes, and temperature anomalies. They don’t disappear just because climate discussions focus heavily on greenhouse gases; in fact, these cycles often dominate the year-to-year swings that get labeled as extreme or unprecedented.
Even broader climate variations, such as those tied to Milankovitch cycles, show that Earth’s long-term temperature history is a repeating rhythm of warm and cold epochs—ice ages and interglacials—arising from predictable orbital mechanics. Instrumental records reflect similar behavior: warming and cooling phases in the 19th, 20th, and 21st centuries align well with these natural oscillations. Yet models frequently struggle to capture the amplitude and timing of these cycles, leading to misattribution of short-term warming peaks to human-caused forcing.

Recognizing the cyclical nature of both weather and climate isn’t a denial of external influences—it’s an acknowledgment that natural variability is fundamental to how the system works. When such oscillations are ignored instead of acknowledging their significance, we end up with a skewed view of what drives changes in amplitude. The simple point is: yes there are oscillations in the climate system but
the climate system is not a simple oscillator.
A large number, perhaps the majority, of people, including many “climate scientists”, have a subconscious mental model of the climate. Without realizing it, they think about weather (and in the long term, climate) as if it were a giant oscillating mechanism, endlessly swinging above and below some ideal baseline. Every winter, when a deep Arctic blast reaches the mid-latitudes, that picture gets dragged out and surfaces in discourse. It is also usually coupled with the phrase “polar vortex.” The same claim appears on cue: the polar vortex is “swinging harder” because “extra energy” has been added to the system. The image people carry around is a planetary sine wave being pushed into larger and larger excursions, as if carbon dioxide driven heat were simply turning up the amplitude dial.

What keeps this idea alive is that very few people ever question the underlying cartoon. A sine wave feels authoritative. It looks analytical. It resembles the kind of sketch someone might make to explain “the climate,” so it slips into the discussion without challenge. And once climate is imagined as a wiggly line, any increase in energy must, in that mental model, stretch the wiggles vertically. The simplicity is exactly what makes the model appealing — and exactly what makes it misleading.
The climate system is not an oscillator. It has oscillatory components, but the whole system is a gradient-driven heat engine. It moves energy from where there is a lot of it (the tropics) to where there is very little (the poles). If more energy enters the system, the distribution of that energy doesn’t increase the amplitude of some hypothetical wave. Instead, the equator-to-pole gradient changes, because the poles warm more rapidly than the tropics. Meanwhile, tropical thunderstorms act like an atmospheric relief valve that limits how warm the equator can become. The system redistributes energy; it doesn’t behave like a spring someone tightens.
This misunderstanding is best handled visually. Most people think in pictures, not equations. So if we want to clear away the oscillator myth, a sequence of animations helps. The first shows the clean mental model people already carry. The second shows the popular misconception — the one invoked every time a deep freeze hits Buffalo. And the third shows a more honest cartoon representation of what happens when a heat-engine system warms unevenly across latitudes.
To begin, here’s the animation that matches what most people imagine when they think of the climate, a simple sine wave, calm and predictable, vibrating around a fixed baseline.
Animation 1: The Default Mental Model, A Stable Regular Oscillator
This is the picture most people carry around without ever articulating it. A tidy oscillation, always returning to the same average, with peaks and troughs equally spaced in time. You see a smooth world cycling gently between “a little warmer” and “a little colder.” Nothing here suggests that putting more energy into the system would move the baseline. The only available knob is amplitude.
Now we get to the belief that dominates public rhetoric. Whenever extreme cold shows up — not extreme warmth, which is predictable enough — we hear that the climate is now “whiplashing,” “swinging harder,” or “oscillating with greater amplitude.” The implication is that adding energy to the system somehow causes bigger deviations, both warm and cold, even though nobody ever explains why a system supposedly getting warmer overall would produce more extreme cold. The intuitive picture silently does the work.
To capture that misconception, here is Animation 2. It begins with the same amplitude as Animation 1, then grows dramatically as the cycle progresses. This is the cartoon model behind the claim that “climate change makes cold extremes more extreme,” which is trotted out with particular enthusiasm during winter.
Animation 2: The Misconception — Amplitude Growing With Added Energy
This is the internal movie millions of people play in their heads without realizing it. In this picture, the climate is a mechanical oscillator. Add energy, and the oscillations stretch vertically. The system doesn’t shift; it spasms. Cold extremes plunge lower; warm extremes shoot higher. This is the “climate whiplash” graphic in its purest form.
The contradiction becomes obvious the moment we compare it with the actual physical pattern associated with a warming world — specifically, polar amplification and tropical constraint. The tropics don’t warm as freely as the poles because once ocean surfaces reach the upper-20s Celsius, deep convection ramps up. The atmosphere begins exporting heat upward more aggressively, and the resulting anvils and cloud fields reflect more incoming sunlight. The same convective towers that remove moisture also transport energy away from the surface, limiting how far temperatures can rise. These feedbacks aren’t precise or fully quantified, but they do create a regime in which large, sustained increases in tropical sea-surface temperatures become increasingly difficult. Meanwhile, polar regions lack these stabilizing mechanisms entirely, which is why warming, when it occurs, tends to be concentrated at high latitudes.
A weaker gradient means the climate engine has less temperature contrast to work with, not more. And in gradient-driven systems, a weaker contrast typically yields a calmer system, not a more volatile one. The public rarely hears this because the oscillator myth is too convenient. It allows every cold event to be reclassified as “further evidence” of warming. The sine wave simply expands to absorb all contradictions.
To correct the picture, the third animation shows what a simplified warming world might look like in cartoon form. The baseline rises — most noticeably at the low end — and the amplitude narrows slightly. The upper bound rises a bit, but the lower bound rises much more. The whole wave shifts upward, because the system is warming, but the total vertical range (our cartoon version of the equator-to-pole spread) gets smaller.
This isn’t a forecast. It’s a conceptual picture that at least respects the idea of uneven warming across latitudes. It doesn’t claim the real world behaves like a sine wave; it simply avoids the mistake of treating energy input as amplitude growth.
Animation 3: Baseline Rising, Gradient Narrowing
Most readers will grasp the point immediately. The third picture strips away complexity and leaves only the structure of the argument: warming strengthens most at the bottom of the distribution, not the top, and the gradient shrinks. The oscillation does not stretch into a taller oscillation. The entire band narrows.
The contrast between Animation 2 and Animation 3 reveals something deeper than a physics correction. It exposes the rhetorical trick used to shoehorn all weather events into a single storyline. When warm extremes happen, they are said to validate the warming trend. When cold extremes happen, they are said to validate the “increasing amplitude” story.
Once readers appreciate that the oscillator metaphor itself is flawed, the winter rhetoric loses its mystique. A polar outbreak becomes a weather event, not a metaphysical expression of a stressed climate oscillator. And a warming world with strong polar amplification no longer magically produces more extreme cold while simultaneously claiming credit for eliminating it.
The goal of these animations is not to endorse any particular theory of climate behavior. The goal is to remove a seductive but incorrect mental model that quietly, yet powerfully, shapes public debate. The real climate system is complicated enough without adding imaginary springs and oscillators. At the very least, we can stop pretending that a planetary heat engine behaves like a plucked guitar string. And once that picture fades, a number of confident wintertime pronouncements fade with it.
Bookmark this post. Winter is upon us. You'll have plenty of use for it. And remember, spring is just around the corner!

IPCC AR Chapter 10 Executive Summary:
Temperature Extremes
It is very likely that heat waves will be more intense, more
frequent and longer lasting in a future warmer climate. Cold
episodes are projected to decrease significantly in a future warmer
climate. Almost everywhere, daily minimum temperatures are
projected to increase faster than daily maximum temperatures,
leading to a decrease in diurnal temperature range. Decreases
in frost days are projected to occur almost everywhere in
the middle and high latitudes, with a comparable increase in
growing season length.
The money quote:
Almost everywhere, daily minimum temperatures are projected
to increase faster than daily maximum temperatures, leading to
a decrease in diurnal temperature range.
Not a recipe for stronger storms
Like your pic of e^ix there at the bottom .
The cycle I have never seen a good analysis of is the precisely known annual 4.6c perihelion , coming January 3 , to aphelion in July variation in insolation . It appears largely subdued by the land-ocean asymmetry of the hemispheres . But change the seasons by π , and we get an ice age .
Almost but not quite. The current glacial episode is already in play. It started around 1700 when aphelion occurred simultaneously with the December solstice. From that time, the oceans in the Northern Hemisphere started warming. That produces more atmospheric moisture in the NH, which comes down as snow when the land cools. And the land in the NH started getting less winter sunlight from about 1700. Warmer oceans and cooler land creates more snowfall.
So there is already more snow. But the only place showing a sustained response is the Greenland plateau, which is gaining altitude. Ice grows on the peaks first before flowinging into the valleys and then just keeps building up until the land reaches it holding limit.
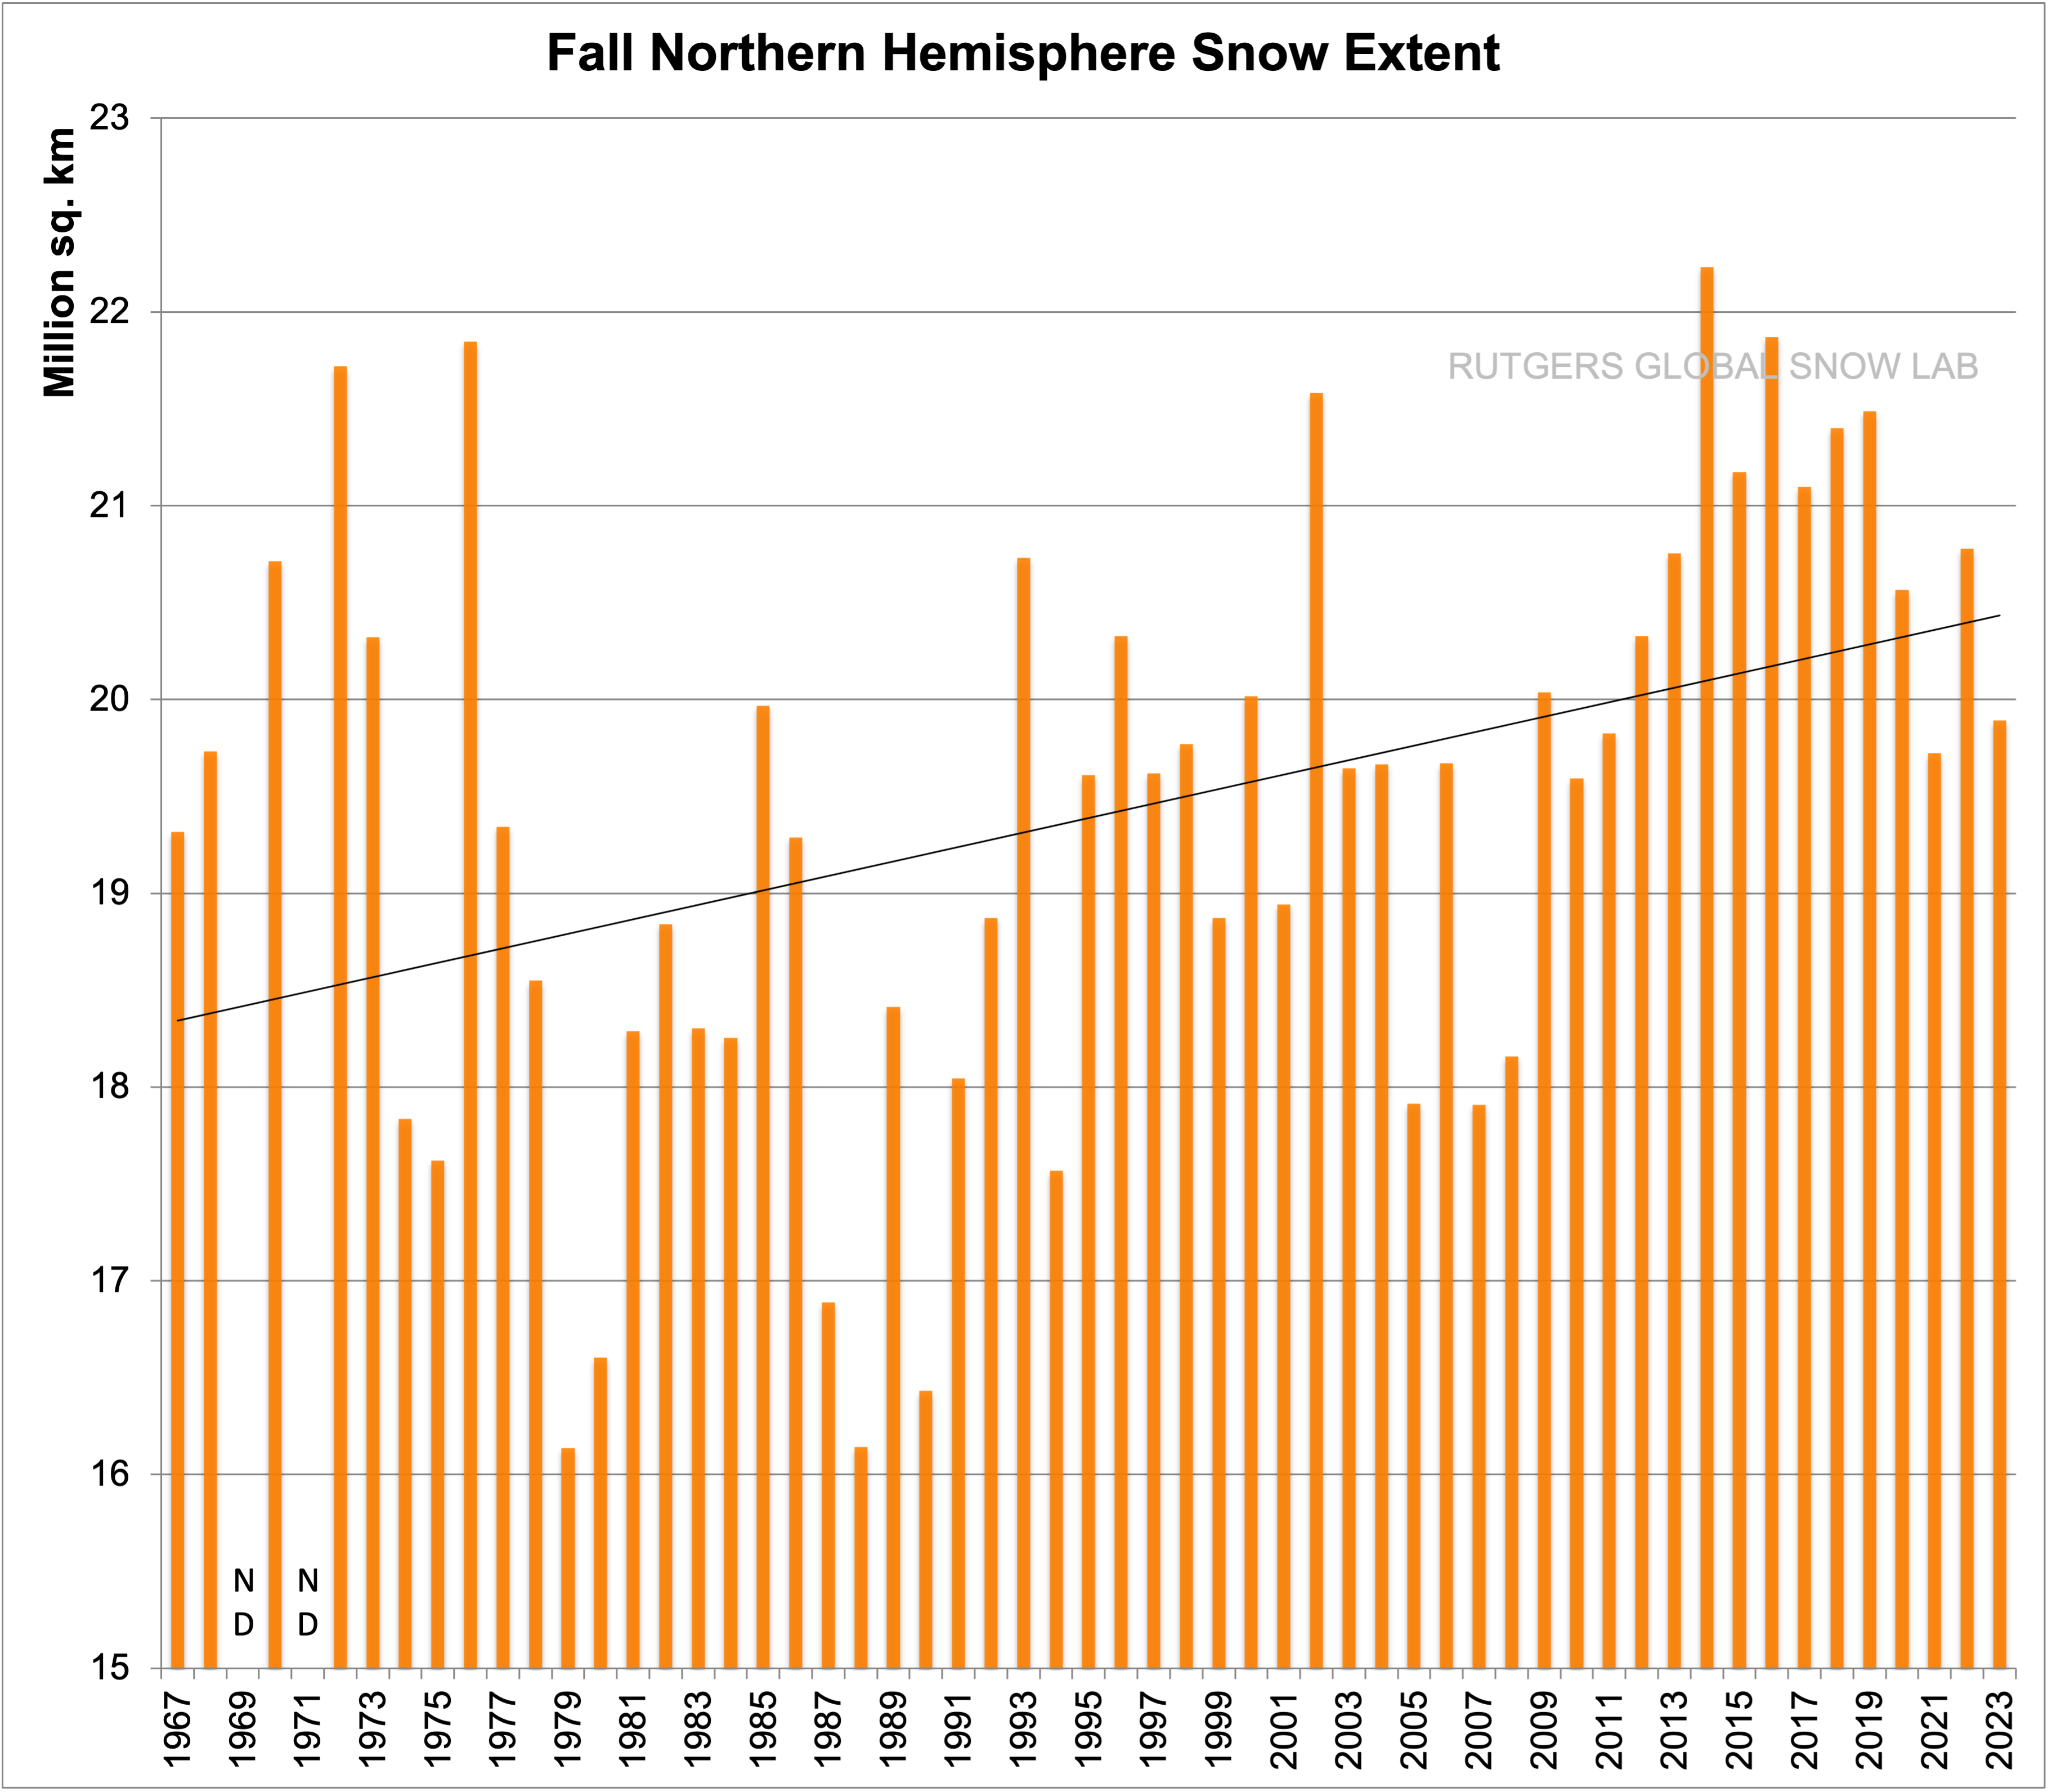
The early season snowfall has been trending up for a long time:
Snowfall records are a common feature of present times:
https://www.msn.com/en-us/weather/meteorology/states-that-reported-all-time-record-snowfall-in-december/ar-AA1S1cJa
New records will be a feature for at least the next 5,000 years but should slow down as the ice builds. Aphelion will be at the June solstice in 9,000 years and the ice will stabilise for about 12,000 years before building again. Ice accumulation follows the upswing in the solar intensity in the NH.
 ?quality=75&ssl=1
Greenland indeed shows steady increase in snow fall and decrease in summer snow melt. This plot shows the snow free area of Greenland between the snowline and the sea. That area is trending down at about 7,000 sq.km. a year. (Hope this works- first go at inserting a graphic!)
That’s roughly 7,000 sq. km. per year.
Not specifically mentioned in the above generally-excellent article, but of critical importance, are the key facts that:
1) Earth’s climate system has a preponderance of negative feedback mechanisms that work to maintain an pseudo-equilibrium against perturbations over time periods on the order of hundreds of years, in accordance with Le Chatelier’s principle,
2) Earth’s climate system has relatively large time delay constants and damping due to the massive heat capacity and massive CO2-dissolving/sequestering capacities of its oceans (71% of its total surface area), resulting in decoupling of potential feed-forward, reinforcing resonances , and
3) Earth’s climate system—in particular, its hydrologic cycle—involves enormous heat content that is tied up in the phase change enthalpies of water fusion (liquid water <–> ice) and water vaporization (liquid water <–> water vapor) that occur without a change in sensible temperature.
I don’t disagree with your statement, except for Le Chatelier’s principle. I had hoped to completely address Le Chatelier’s Principle in this essay from last Spring and explain why it makes no sense to apply it to mechanical systems or Earth’s climate. It has always pertained to chemical systems near equilibrium where the Gibbs Free energy, which drives chemical reactions, is a minimum. From this point all gradients of the Gibbs function, which behave like forces in the world of chemical reactions, point toward the minimum and are thus restorative (involve negative feedback).
There is nothing similar that I can identify at present in the mixed mechanical/thermodynamic system of weather and climate.
That this present essay avoids any use of an equilibrium principle and goes straight to the nub of the problem which is transport driven by gradients is exactly right.
From Pirates of the Carribean “…the Pirate’s Code is more of a Guideline…”
As is Le Chatelier’s principle….
Kevin, thanks for the comment and sharing your own observations.
In thinking further about Le Chatelier’s principle and your statement:
“There is nothing similar that I can identify at present in the mixed mechanical/thermodynamic system of weather and climate”,
I invite you consider the net-effect of the thermal inertia (mass and specific heat) of the world’s oceans. It does provide the opportunity for enormous negative feedback “gradients” to help maintain what is admittedly a relatively short term pseudo-equilibrium for Earth’s climate.
If the Earth’s atmosphere and thermally-coupled near-surface ocean waters get perturbed upward in temperature by some event (say, an upward variation in solar insolation during the period of an ~11 years sunspot cycle) then the ocean’s thermal inertia will tend to absorb (cool off) that uptick in incoming energy. Likewise, if there is energy perturbation to the downside (say, an multiyear increase in global cloud coverage/increase in albedo per Svensmark’s solar-wind-modulation-of-cosmic-rays theory for providing variable CCNs in Earth’s atmosphere), then the thermal inertial of the oceans will tend to warm up the atmosphere and near-surface ocean waters due to the resulting increased temperature gradient relative to lower surface waters (at least down to the depths of the thermoclines).
“Once readers appreciate that the oscillator metaphor itself is flawed, the winter rhetoric loses its mystique.” All metaphors are “a figure of speech.” Includes springs.
Speaking of “winter rhetoric” as compared to “summer rhetoric”, I find it highly amusing that none—I repeat my observation, NONE—of the national news TV media that I have watched over the last month or so has mentioned “climate change” as being responsible for the blasts of cold weather that have recently swept across the US mid-west and Eastern states.
In comparison, during last summer’s “heat waves” that swept across the very same regions, the phrase “climate change” was de rigueur!
ROTFL!
I do not watch the national news TV media so your observation is interesting.:)
Oh but have a big snow storm and the “climate” Boogeyman will be rolled out without the slightest blush on the cheeks of the “newscasters.”
Any chance they get they will.
Yesterday, on the national news in Holland the announcement of a warm spell was coupled w climate change. So what western Europa had. ( roughly) A period of standard westerleys Tmax 9 Tmin 5 followed by a cold north wind Tmax 3 Tmin -3, followed by a warm/southern wind driven spell of Tmax14 Tmin 8. And of course the latter was Climate Change.
Do they have to make it THAT obvious? Why don’t they just try harder to at least disguise the deception?
( don’t answer that)..
I have been saying this for years!
Its easy once a person grasps this to extend to other weather effects. SB Law requires that all warming be more pronounced at night time lows, high altitudes, high latitudes, and winter seasons. Everything else warms too, but the highs less, narrowing the band. Less temperature differential equals less pressure differential equals less wind… A warmer world can have no other outcome than to be a calmer world.
So far the ‘We dub ourselves The Legacy Press” hasn’t warned us about extreme mildness.
Very nice Charles and Anthony.This makes sense and needs wide distribution.
Thank you.
Story tip:
Federal judge strikes down Trump executive order blocking wind energy projects
https://www.foxbusiness.com/politics/federal-judge-strikes-down-trump-executive-order-blocking-wind-energy-projects
A lot of effort has been spent here analyzing oscillatoion and feedback. “More Energy in the System Means More Extreme Weather” – not necessarily true, but depends on what exactly “extreme weather” is. I don’t support the doom and theories but don’t give up the winning streak by going too far. Not sure how to comment, probably shouldn’t, but:
Temperature is an attempt to measure heat which is an attempt to measure energy in the form of moving atoms. If you add more energy to a system that does or does not oscillate, even if you add the energy to a system with strong negative feedback, the total energy of the system still increases. Increased energy does not have to mean more storms or bigger storms or more droughts or longer droughts.More energy can mean those things but it does not have to mean those things.
“Negative feedback is .. where a system’s output counteracts or reduces the initial change”
Negative feedback does not invert an effect or eliminate an effect. Negative feedback reduces an effect. I’m picking arbitrary big/small numbers to say the reduction could be 99.999% or 0.001%. THe effect still happens.
If you increase the amount of energy that gets into the system, then the system gains energy. It isn’t arguable. Its tempting to keep going on, but it would just be more of the same. No catastrophe is required, if I were controlling the Earth thermostat from my living room it would be a few degrees warmer.
No problem – thanks to Gavin Schmidt –
Breathe harder, crack a beer, release more CO2. Drink more beers, burp and fart copiously – I’m sure there will be some greenhouse gases the emissions somewhere. If it doesn’t make you warmer, blame the world-famous “climate scientists” Gavin Schmidt. He’s consuming oxygen and converting it to CO2. Some might call him a waste of perfectly useful oxygen, for all I know.
Good luck with warming the Earth.
“Temperature is an attempt to measure heat”
The problem is that “energy” (e.g. heat energy) is actually measured by enthalpy. Enthalpy is a function of multiple factors such as humidity, pressure, and specific heats. We’ve had the ability to at least attempt to characterize enthalpy of the biosphere since around 1980 (about 40-45 years) but climate science just absolutely refuses to do so – still maintaining models based on temperature instead of enthalpy.
Models with CO2 as the input, IR as the transfer function, and temperature as the output.
Bogus.
This is really well written. Dick Lindzen has been making this point for years.
I’ve been wanting to write this for 6 to 8 years, but making the animations was a barrier. Now we just ask AI to do it.
Hence the coriolis reference. I always think of Lindzen when i spot that word.
As Marcel Crok and I noted in our paper “Carbon Dioxide and a Warming Climate are not problems” extreme weather was much worse (both hot and cold) in the Little Ice Age than today. Cold leads to more extremes, warm leads to milder weather.
https://andymaypetrophysicist.com/wp-content/uploads/2024/05/Carbon-Dioxide-and-a-Warming-Climate-are-not-problems_Final_Submission_no_logo.pdf
I recall, in the 1970s, citing Hubert Lamb and Reid Bryson regarding milder weather in warm times. Of course, 55 years on, I no longer have notes and materials from the 1970s.
Yes another thing you’ll never hear about in the “media” is the recent Atlantic Ocean sediment study that showed MORE tropical cyclone activity during the Little Ice Age than today.
Observation TRUMPS theory, as I like to say.
And the dutch, british, french, spanish nations frequently reported atlantic storms which occurred in the LIA.
Armada anyone?
This is why the variance of colder temperatures is higher than warmer temperatures. When calculating the average value of cold and warm temperatures you should find a weighted mean, not a direct arithmetic mean. Yet climate science has seemingly *never* allowed for this in their “global average temperature, at least as far as I can tell.
What does the mean, or any mean signify?
It is a statistical quick handy thingie, It does not convey any real information about the subject. It should not be used outside of statistical analysis.
It is about as bad as the BMI. There is no such thing as a personal BMI because the inventor, mister Quetelet explicitally said: this is a Q%D statistical thingy to quickly compare groups. It has no value on a individual level.
BTW, BMI was coined by Ancel Keys another classical scientific conman. The damage done by him has cost millions of lives.
And that is my point. Dumb people, using dumb statistical arguments to prove a dumb point.
Use as tool you can handle. I have yet to meet a person who actually is able to truly use statistics. Such a person will usually refrain.
Great punchline.
I do hope it motivated you to spring into action.
With respect, no. Insolation and the atmospheric constituents determine how hot the equator can become, as Tyndall pointed out. Suffice to say the Equatorial regions do not have the highest surface temperatures, due to the presence of higher levels of water vapour. These may stimulate the formation of thunderstorms, of course, but thunderstorms are an effect, not a cause. Rather like blaming the CO2 emitted by a bonfire for the heat you feel. 100% correlation, but only the ignorant and gullible would believe that the heat is due to CO2.
Maybe, maybe not. The components of the “system” seem to act chaotically. In any case, as Yogi Berra said “It’s tough to make predictions, especially about the future.” Anyone who claims they can reliably predict future weather events better than smart 12 year old will no doubt go on to make a vast fortune. Not me, unfortunately.
Love the visual pun.
There is one simple question I ask of people who push the “More Energy in the System Means More Extreme Weather” fallacy….
Is the weather at the equator more extreme than the south pole?
The Antarctic temperatures are the tail that wags the penguins.
Spring is just around the corner!
that picture made me laugh thank you, here in the UK we need cheering up.
“The climate system is not an oscillator. It has oscillatory components, but the whole system is a gradient-driven heat engine.”
If we consider humans as just another natural phenomenon- then, even if we are impacting the climate some trivial amount, then we should be considered just another oscillatory component. But, what goes up also goes down eventually so our impact is most likely trivial compared to all those other oscillatory components.
Meanwhile, it feels like middle of winter here in Wokeachusetts- snow on the ground and very cold!
Brrr! Gonna be nearly 60 here in SLC for a couple of days.
LOOK AT THE VIDEO. The screen shot doesn’t really do it justice. Read the Y-axis. For context…doubling CO2 adds about 6 watts/sq.M to the energy of the column. You can decide for yourself how much extra turbulence 6 watts can cause.
Heat input to the surface causes convection, rising warm air, and equivalent falling cool air. Differences in warming rates cause falling air to slide sideways to where warm air has risen, causing advection, a fancy name for winds. Weather fronts develop. Coriolis forces marshall the weather patterns into very large rotational patterns. Etcetera. The kinetic energy of the atmosphere is sort of a storage battery of the suns heat input to the atmosphere, and varies significantly from place to place and from one altitude to another.
The summation of winds and convection energy at all levels is called “atmospheric column kinetic energy”.
https://youtu.be/hDurP-4gVrY?si=pJqWIBVj9YH1qwB1
Graphic courtesy David Dibbell and EBAF5
“You can decide for yourself how much extra turbulence 6 watts can cause.”
If the energy is uniformly distributed, I say zero added turbulence.
How many light bulbs does it take to change a climate?
This is an interesting essay.
If there is no increasing storage of heat (i.e. increasing temperature, or decreasing ice on the planet), then gradients transporting heat all have to terminate in radiative transport to space. That is the only means by which we transfer energy to and from our surrounding space. Some of this occurs locally (or regionally maybe is a better term). A figure in this publication shows that local transport vertically must occur — there is a maximum of net LWIR to space in low latitudes.
However, the regions exhibiting a net deficit of input solar radiation versus longwave must be obtaining heat by horizontal transport (sensible heat in air flow and ocean currents, and moisture transport) from lower latitudes. These deficit regions of the planet provide “slack” for want of a better term; slack for maintaining the climate within reasonable bounds in the presence of perturbations in energy imbalance.
So, a statement like this:
Fails to explain that polar amplification must occur if this slack at higher altitudes is to be used fully as a negative feedback. That is, radiative transport is enhanced by increasing temperature in the lower atmosphere. In this view polar amplification is a consequence not of positive feedback due to lack of stabilizing mechanisms in the climate system, but rather as negative feedback in the over all climate system at work.
Thanks for the linked article, Kevin. Quite good…thought it could have used a mention of the effect of the cosine of the angle of incident sunlight at those various latitudes…just sayin…
It was 13F yesterday morning.
It was 31F this morning.
Someone must have dumped a lot of CO2 in the atmosphere.
/sarc
Or is dyslexic.
What in nature doesn’t move in cycles?
Predator/prey populations? Cycles.
Even the Sun has cycles.
Where ever we are in a particular cycle, “This too shall pass.”.
Dumbbells in a washing machine:
https://www.youtube.com/watch?v=OBEtIlMmlwE
Any resemblance with contrarians in the Climateball arena may or may not be pure coincidence.
More importantly, as any meteorologist will explain, extreme weather is driven by large temperature, pressure, and moisture gradients. Just adding “energy” (heat) to the system doesn’t generate more extreme weather. Venus has a much hotter atmosphere and more “energy” in the climate system than Earth due to its closer proximity to the sun, but surface winds are milder than on Earth even though upper level winds are more violent. Violent storms, winds, and weather are caused by a large difference in temperature, pressure, and moisture over a relatively short distance. Uniformly increasing the temperature doesn’t increase the severity of storms, winds or weather. Increasing the temperature on the warm side of the gradient between two areas or decreasing it on the cold side creates a more violent storm. “Global” warming warms everything. It doesn’t magically and selectively increase temperature just on the warm side of the numerous randomly and chaotically forming temperature gradients all over Earth every day.
“If more energy enters the system, the distribution of that energy doesn’t increase the amplitude of some hypothetical wave. Instead, the equator-to-pole gradient changes, because the poles warm more rapidly than the tropics.”
If more energy enters the system, La Nina conditions increase, and the AMO shifts colder (which increases low cloud cover). The colder AMO and an increase in positive North Atlantic Oscillation conditions reduces poleward heat transport.
Rising CO2 forcing is modeled to increase positive NAO states, so they should really know that. Arctic amplification is bunkum, the AMO and Arctic warm during negative NAO regimes when the solar wind is weaker, which is at least during each centennial solar minimum.
The biggest mid latitude heat and cold waves are solar driven, so they are a cause and not a product of climate change.
https://docs.google.com/document/d/e/2PACX-1vQemMt_PNwwBKNOS7GSP7gbWDmcDBJ80UJzkqDIQ75_Sctjn89VoM5MIYHQWHkpn88cMQXkKjXznM-u/pub