The annual Arctic sea ice minimum has arrived once again, and as usual, it provides far less drama than the media headlines would suggest. According to the National Snow and Ice Data Center (NSIDC), Arctic sea ice extent bottomed out on September 10th, 2025, at 4.60 million square kilometers (1.78 million square miles).
That figure puts 2025 in a tie for 10th lowest in the satellite record, right alongside 2008 and 2010. But here’s the key point that gets lost in the breathless reporting:
- It’s been 13 years since the record low of 2012, and no new record has been set since.
- This year’s minimum is higher than the minimums of 2007, 2008, 2011, 2012, 2015, 2016, 2019, 2020, 2023, and 2024.
- And despite Al Gore’s infamous prediction of an “ice-free Arctic” by 2014, here we are with nearly 1.8 million square miles of ice still in place.
The ice, in other words, is still there — stubbornly refusing to cooperate with climate apocalypse narratives.
First, let’s look directly at NSIDC’s own words from their September 17th analysis:
“On September 10, Arctic sea ice likely reached its annual minimum extent of 4.60 million square kilometers (1.78 million square miles). The 2025 minimum shares the tenth lowest spot in the nearly 47-year satellite record with 2008 and 2010. While the last 19 years, from 2007 to 2025, are the lowest 19 sea ice extents in the satellite record, there has been no significant trend in September minimum extents over this time.”
That last line is crucial. While the long-term decline since 1979 is real, over the last two decades there has been no significant downward trend in September minimums. In other words: the so-called “death spiral” has been more like a wobble.
Here’s NSIDC’s own graph from Figure 1b, which tells the story clearly:

This year’s minimum of 4.60 million km² is:
- 1.21 million km² above the record low of 3.39 million km² set in 2012.
- 1.62 million km² below the 1981–2010 average, which NSIDC notes is about the size of Alaska.
- Reached on September 10, about four days earlier than the long-term median date of September 14.
Here’s the ranking table directly from NSIDC:

Notice carefully: 2012 still stands alone at the top (or bottom, depending on your perspective). Every year since then — including this year — has had more ice.
So much for the “runaway melt.”
The Gore Factor
No discussion of Arctic ice would be complete without revisiting one of the most infamous climate predictions ever made. In 2009, former Vice President Al Gore declared at COP15 that the Arctic could be “completely ice-free in the summer” as soon as 2014.
Well, here we are in 2025. Not only is the Arctic not ice-free, it has nearly 1.8 million square miles of ice still in place — larger than the entire landmass of India. Gore’s forecast has “missed” by an area bigger than Greenland and Alaska combined.
That’s not a rounding error. That’s a prediction failure of epic proportions. See more failures on our Failed Climate Prediction Timeline.
What the Satellite Record Really Shows
The satellite record, beginning in 1979, does indeed show an overall decline in September ice. According to NSIDC:
“The overall, downward trend in the minimum extent from 1979 to 2025 is 12.1 percent per decade relative to the 1981 to 2010 average. From the linear trend, the loss of sea ice is about 74,000 square kilometers (29,000 square miles) per year, equivalent to losing the state of South Dakota or the country of Austria annually.”
But again, they admit:
“This overall trend should be viewed with the caveat that there has been no significant downward trend in September minimum extents over the past two decades.”
That’s bureaucratic language for: “It’s flatlined since 2007.”
If climate models were right, we should have seen accelerating decline and likely another record low by now. Instead, the last 19 years have all occupied the same general band.
What About the Antarctic?
While this year’s Arctic minimum is being framed as “among the 10 lowest,” NSIDC also notes something rarely discussed in the media:
“In the Antarctic, sea ice extent has been tracking at the third lowest level in the satellite record for most of the growth season, but the maximum has not yet been reached.”
That matters because for decades, Antarctic sea ice was stable or even growing slightly — a fact that often irritated those wanting a clean, one-way narrative. Now it’s dipping, but NSIDC cautions that fluctuations are normal near the seasonal maximum.
In other words, variability is the rule, not the exception.
If one steps back from the year-to-year noise, a larger pattern emerges. The Arctic is not vanishing — it’s oscillating. Yes, the long-term baseline is lower than in the early 1980s. But the lack of a downward push since 2012 strongly suggests that natural variability plays a much larger role than climate models admit.
Solar cycles, ocean oscillations (such as the Atlantic Multidecadal Oscillation), and shifting wind patterns all play into the distribution and persistence of Arctic ice. Pretending this is purely about CO₂ levels is simplistic at best and misleading at worst.
The Arctic has been used as a poster child for climate alarm for nearly two decades. Predictions of an “ice-free summer” were leveraged to push policy, carbon taxes, and renewable mandates. Yet the reality on the ground — or in this case, on the ice — has not matched the rhetoric.
If a business executive’s forecast missed this badly, they’d be fired. If a TV weather forecaster got it wrong for 13 years straight, viewers would stop tuning in. But in climate science, failed predictions are simply ignored while the climate doom narrative rolls on.
Conclusion: Still Plenty of Ice
So, where does this leave us in 2025?
- The Arctic minimum this year was 4.60 million km².
- It ranks only 10th lowest, tied with two other years.
- No new record has been set for 13 years.
- There has been no significant downward trend for 20 years.
- Al Gore’s 2014 prediction is still off by nearly 2 million square miles.
In short: the Arctic is not disappearing. It remains icy, unpredictable, and inconvenient to those who wish to use it as a scare tactic.
As NSIDC itself admits, the flattening trend is still a subject of “active debate” among scientists. Perhaps it’s time for policymakers and journalists to debate it as well — instead of pretending the science is “settled.”
Author’s Note: As always, I encourage readers to view the NSIDC’s own analysis here and examine the figures and tables firsthand. The data tells a more interesting story than the headlines ever will.
So no decline for 13 years.
Hide the non-decline!
(h/t Michael Mann)
I suppose some low-intelligence individuals will accuse me of cherry-picking data…
That must be me. Don’t we have records back to the ’70s?
And since we do have older records, below is the Northern Hemisphere Sea Ice extent as depicted by all six IPCC Assessment reports. As always it’s instructive to notice how the supporting data is obviously “Corrected” to show a steeper decline. Especially note the difference between the 1995 SAR and the 2000 TAR. Besides that, it sure looks the AR6 rendition is an attempt to obscure the actual decline or lack of decline and instead provide us with alarming red and black colors.
Obviously we had no way of recording how much ice until we had men on the moon in 1969…although the British rushed to find the northwest passage in 1814 based on rumors that the Arctic ice was melting….
/s
Thanks, nice charts
Stupid Denier Ice!
I wonder what Martha Stewart has to say about it. On the rocks?
She’d probably say to go with 1200, not the 600.
More CC misinformation debunked but it won’t get the same press as it did initially with the scare stories.
And… with 1/3 of ALL huan emissions of CO2 released in the last 20 years !
https://joannenova.com.au/2025/08/600-billion-tons-of-carbon-emissions-and-arctic-sea-ice-has-stayed-the-same-for-20-years/
You know what they say: “It takes Huan to know Huan.”
At least a million Chinese are happy to hear it.
“Solar cycles, ocean oscillations (such as the Atlantic Multidecadal Oscillation), and shifting wind patterns all play into the distribution and persistence of Arctic ice.”
The Arctic sea ice is not unpredictable, as it depends on ocean warming and cooling, which in turn depends on accumulated absorbed solar radiation via the changing state of solar activity over time.
These graphics are from my recently updated poster for the just concluded Sun Climate Symposium held in Fairbanks last week. The Symposium was originally scheduled for the first week in April, so the sea ice trend charts posted here were up to date through 2024, and will be updated early 2026.
Since April, many people have published about the flatter Arctic sea ice trend since 2007, which is the same as my findings discovered by decomposing the monthly volume and extent trends into two different regimes, a higher loss regime followed by the flatter recent period.
I made three falsifiable predictions unrelated to CO2: NA OHC and the NC Pacific SST will decline from their recent solar induced peaks into the next solar minimum, positively affecting sea ice.
These predictions conform to my sun-ocean decadal warming/cooling threshold system.
“which in turn depends on accumulated absorbed solar radiation”
Don’t forget about geothermal heating from below. It is not an insignificant factor in ocean water temperatures
It is the ice preventing that heat to escape to space
The ASR computed from CERES EBAF TOA accounts for 85% of HadSST4 since 2000.
This leaves 15% left to be allocated to other attributions such as geothermal seamounts.
The data uncertainty could mask an even higher SST correlation to ASR than 0.85 too.
The recent prepublication NAS report summary claims ASR did not cause global warming.
“Overarching Conclusion: EPA’s 2009 finding that the human-caused emissions of
greenhouse gases threaten human health and welfare was accurate, has stood the test of
time, and is now reinforced by even stronger evidence. Today, many of EPA’s conclusions are further supported by longer observational records and multiple new lines of evidence. Moreover, research has uncovered additional risks that were not apparent in 2009.
This overarching conclusion is supported by the following five conclusions:
(1) Emissions of greenhouse gases from human activities are increasing the concentration of these gases in the atmosphere. Human activities, such as the extraction and burning of fossil fuels, cement and chemical production, deforestation, and agricultural activities, emit GHGs, which include carbon dioxide (CO2), methane (CH4), nitrous oxide (N2O), and fluorinated gases (F-gases), to the atmosphere. Total global GHG emissions continue to increase, even though U.S. emissions of CO2 have decreased slightly in recent years largely due to changes in energy production and consumption. Multiple lines of evidence show that GHG emissions from human activities are the primary driver of the observed long-term warming trend. No known natural drivers, such as incoming solar radiation or volcanic emissions, can explain observed changes.
(2) Improved observations confirm unequivocally that greenhouse gas emissions are
warming Earth’s surface and changing Earth’s climate. Longer records, improved and more robust observational networks, and analytical and methodological advances have strengthened detection of observed changes and their attribution to elevated GHGs. Trends observed include increases in hot extremes and extreme single-day precipitation events, declines in cold extremes, regional shifts in annual precipitation, warming of the Earth’s oceans, a decrease in ocean pH, rising sea levels, and an increase in wildfire severity.”
-my emphasis
The fact is ASR did cause global warming and CO2 did not. The NAS is wrong.
Skeptics can either get behind this message, or fiddle-duck around with the other 15%, which probably isn’t necessary anyway, as TSI and the CERES albedo can be used to account for the whole increase, according to Nikolov and Zeller’s paper, and from my application of the same data to the S-B equation.
Compared to the energy from sunlight, it is insignificant.
Charts seem to start in 1979, 46 years in the past, but make predictions for 65 years in the future. I can tell you know how to process the data and that you’ve spent a lot more time looking at it than I have, but I don’t think you can overcome a lack of reliable long-term data by being extra-smart and extra-careful.
Potential ‘ice-free’ years were extrapolated from ice trends that may change in the future.
The flatter trend was established during a lower solar period that may not be repeated soon, as it was during a Gleissberg minimum, so if solar activity is consistently high for 1-2 more cycles the sea ice may reach ‘ice-free’ sooner, possibly in the 2055-2065 range.
This contrasts with published papers that call for ‘ice-free’ likely anywhere from 2027-2050.
If irradiance is anywhere near as high as this cycle or higher as this projection indicates for the next several solar cycles, the Arctic ice would melt faster due to more ocean warming.
The author of this irradiance climate data record said solar cycle 24 was considered the low point of the Gleissberg cycle, and the next peak is around 2056, as shown. I expressed to her the unlikelihood of those future cycles being that much higher than the present cycle #25, which is shown above to be tied with the highest sunspot cycle #19.
“The Gleissberg cycle is a century-long solar activity cycle that modulates the amplitude of the 11-year sunspot cycle, causing solar activity to strengthen and weaken over approximately 80-120 years. Named after German astronomer Wolfgang Gleissberg, this cycle is not a single, precise periodicity but rather a complex variation characterized by a series of high-intensity solar cycles followed by a period of lower-intensity cycles. Recent research suggests the cycle is currently in a minimum phase, with a potential to ramp up activity in the coming decades, though some experts remain skeptical.”
The Internet backs up Bob, but Kevin doubts we know much about solar cycles before WW2.
. . . and quantifying what is only alluded to in the above article:
— for September 2012, NOAA’s Mauna Loa observatory reported the monthly-average atmospheric CO2 concentration level at 391.32 ppmv,
— for August 2025, the site reported a monthly-average atmospheric CO2 concentration of 425.48 ppmv
(ref: https://gml.noaa.gov/webdata/ccgg/trends/co2/co2_mm_mlo.txt )
That’s an increase of 8.7% in atmospheric CO2, by volume, since the record lowest Arctic sea ice extent 13 years ago!
Now, some of you AGW/CAGW alarmist out there may want to talk to me about the “CO2 control knob on GLOBAL warming” and/or the ECS from a doubling of atmospheric CO2 levels??? Bring it on.
But then again, maybe the area within of the Arctic Circle has received a special papal dispensation from experiencing the effects of “climate change”/”global warming”. /sarc
At NOAA’s GML, the concentration of CO2 is reported in ppmv for pure dry air comprised of N2, O2 and Ar at STP. For most people, a concentration of 425 ppmv seems like a lot of CO2 in the air. Actually there is very little CO2 in the air.
The mass of CO2 in one cubic meter of dry air at STP is given by:
Mass of CO2 = 425 ml/22.4ml CO2/mmole x 44 mg CO2/mmole = 835 mg
or 0.835 g
One cubic meter of pure dry air has a mass of 1.29 kg at STP and has
1,000,000 ml. Note that 1 ppmv = 1ml. However, air is never exactly at STP and contains usually contains substantial amounts of H2O.
In air at 70° F and with 70% RH, the concentration of H2O is 17,780 ppmv. One cubic meter of this air has mass of 1.20 kg and contains
14.3 g of H2O and 0.78 g of CO2. To the first approximation and all things being equal the amount of the greenhouse effect (GHE) for H2O is given by:
GHE=moles H2O/moles H2O+moles CO2=0.79/0.79+0.019=0.98 or 98%
The above basic temperature data and calculations shows that since 1988, the IPCC and the unscrupulous collaborating scientists have been perpetrating the greatest scientific fraud since the Piltdown Man. After the EPA rescinds the 2009 CO2 Endangerment Finding (EF), this fraud will come to an end and all the radical environmental NGO’s will go bust. However, the announcement of the recission of the EF is still many months away. In the mean time, we have to spread the word that there is too little CO2 in the air to cause global warming.
PS: Please send a copy of this comment to all your friends and enemies.
Climate Change believers are invariably innumerate. I once measured out 10m of adhesive tape to represent the composition of air and asked a friend and CC acolyte tto mark the proportion which was CO2. He was wildly out, and was staggered when I showed him the real value, namely 4.2 millimeters.
“The oral lethal dose for humans is estimated to be around 1-2 mg. Tetrodotoxin is a Select Agent Toxin. TTX is not regulated if the amount under the control of the principal investigator does not exceed, at any time, 500 mg.”
Your point stands, but for the sake of annoying contrarianism – It only takes a few mg of pufferfish venom to kill a 70,000 kg average man.
Harold,
GHE=moles H2O/moles H2O+moles CO2=0.79/0.79+0.019=0.98 or 98%
= 1 +0.019 = 1.019
Something is not correct with this equation. A term may be missing
Parentheses missing: =0.79/(0.79+0.019)=0.98 or 98%
My take away, in addition to it’s leveled out since 2007:
Annual variability in sea ice extent is about a factor of 3.
Average decline since 1979 is about 40 percent of that, what engineers would call a signal to noise ratio of only 0.4–nothing to bet your house on.
The leveling out is not consistent with rise in atmospheric CO2.
Conclusion: The decline in sea ice extent cannot be distinguished from natural variability.
You can’t characterize all cycles by looking at just one cycle. C’mon if Earth is older than 6000 years and has had both “all ice” and “no ice” for long stretches then nobody can look at 50 years of “a little ice” and claim to know what the future should look like.
If Al Gore had any ethics . . . any ethics at all . . . he would now publicly disavow the obvious alarmist falsehood he perpetuated in his COP15 (December 2009) address documented in the above article’s video clip.
But I did start with “If”.
algore’s only one of a very long list of climate deniers who need to publicly disavow their falsehoods. But algore’s GIM (generation investment management) firm is heavily invested in alternative energy. And let’s not forget that algore would have made a FORTUNE had the CCX (chicago climate exchange) been successful in selling carbon credits.
Who needs ethics when not having them gets you billions of $$$?
Another Year, Another Non-Event
Fine if you focus on extent, however what is happening is the ice is breaking up more and spreading out more. If you look at the volume of sea ice you’ll see it’s going down!

That is a MODELLED output not measured 🙂
They told you if you bothered to read and your probably the only one who believes it especially since Grace differs. Grace says Greenland and some other areas are losing mass but not the sheet itself.
*************************************************************************
The figures are based on calculations using DMI’s operational ocean and sea ice model HYCOM-CICE
*************************************************************************
DMI are upgrading their supercomputer, so calculations have been suspended for a while. We can guess the consequences of the upgrade.
That’s statement is totally dependent on:
(a) how accurately the volume of Arctic sea ice is calculated, since it is not measured directly, and
(b) the timeframe being considered.
For example, this graph

shows the trend in Arctic sea ice as calculated by the PIOMAS computer program of the Polar Science Center of the UofW Applied Physics Laboratory (https://psc.apl.uw.edu/research/projects/arctic-sea-ice-volume-anomaly ) .
Note that:
1) the overall linearized trend line is a loss of 2,800 km^3/decade from 1979 thru mid-2025,
2) however, there is no loss indicated for the years 2017 thru mid-2025,
3) there are significant variations (cycles?) in the overall trend; for example, the periods of 1981–1988, 2011–2015, and 2017-2022 all show intervals of increasing sea ice volume.
There is no independent evidence as to how accurate/inaccurate these calculations may really be . . . FWIW, the cited website mentions this under the subheading “Model Validation and Uncertainty:”:
“From these validation studies we arrive at conservative estimates of the uncertainty in the trend of ± 1.0 10^3 km3/decade.”
and
“The uncertainty for November total ice volume is estimated to be ±1.35 10^3 km3.”
The first statement amounts to an trend uncertainty of ±1.0/2.8 = ±36%, and the second statement amounts to an value uncertainty of ±1.35/8.5 = ±16%.
Is anyone really surprised that Arctic sea ice is melting overall (by volume) since Earth entered its current interglacial warm period only some 13,000 or so years ago?
1979 extent was actually an extreme high, not far down from that of the LIA..
Anyone that thinks year-long thick sea ice that drives all the sea life out of the Arctic is a good thing, has rocks in their head.
Even now, the extent is well above that of the MWP. One heck of a lot of sea ice up there.
Just curious as to how Arctic sea ice volume was established during the LIA and during the MWP . . . you know, not having computers or satellites or ice breakers during those times.
PIOMAS since 2011
Is the red thumb because whoever it is knows the data is correct ?!
Fact is, that compared to the rest of the Holocene, the LIA was an extreme maximum anomaly.
And 1979 wasn’t much below that.
The Arctic sea life is enjoying the recovery back slightly towards more normal Holocene extents.
Still a long ways to go though.. but unfortunately has stalled…
… and if the AMO flips downwards, an increase in Arctic sea ice can be expected.
Note that Table 1 says, “Values within 40,000 km² are considered tied.”
I think that we can assume that the uncertainty of the estimate is at least that large, it not double.
I note:
1) that I asked about the accuracy of sea ice volume claims,
2) you responded with a statement about sea ice area coverage values.
The twain do not meet.
Are you asserting that the volume of the ice, with no obvious means of measuring the thickness, can be determined with more accuracy than the surface area? Because uncertainties are additive, the uncertainty for the area is a lower-bound for the uncertainty of the volume.
No, I never asserted any such thing.
In fact, what appears “obvious” to you is NOT SO to scientists with relevant experience in the field of measuring sea ice thickness. To wit, as summarized by Google’s “AI” (my bold emphasis added):
“Arctic sea ice thickness is measured using several methods, including satellite-based altimetry to determine ice freeboard (height above the water), airborne electromagnetic induction (EM) sensors and upward-looking sonars to measure ice draft (thickness below the water), and direct measurements by drilling into the ice.”
Hmmm . . . that’s four different methods listed for scientifically measuring Arctic sea ice thickness.
More details on these methods and the relative pros and cons of each, as well as the recent introduction of a fifth technique (the use of ROVs to perform under-ice inspections) are presented in “Methods for Measuring Sea Ice Thickness in the Arctic” (article available at https://www.deeptrekker.com/resources/measuring-sea-ice-thickness ).
Surely the falsifiable hypothesis should now be: ‘that Arctic sea ice extent minima in September oscillate interdecadally with a beat of the order of 50-70 years’??
Obviously, this isn’t the sort of research amenable to a 40 year career, but it’s probably worth humanity measuring it for a few centuries to get enough data to at least have some view of how things change.
Russian sea ice minimum extents since 1900
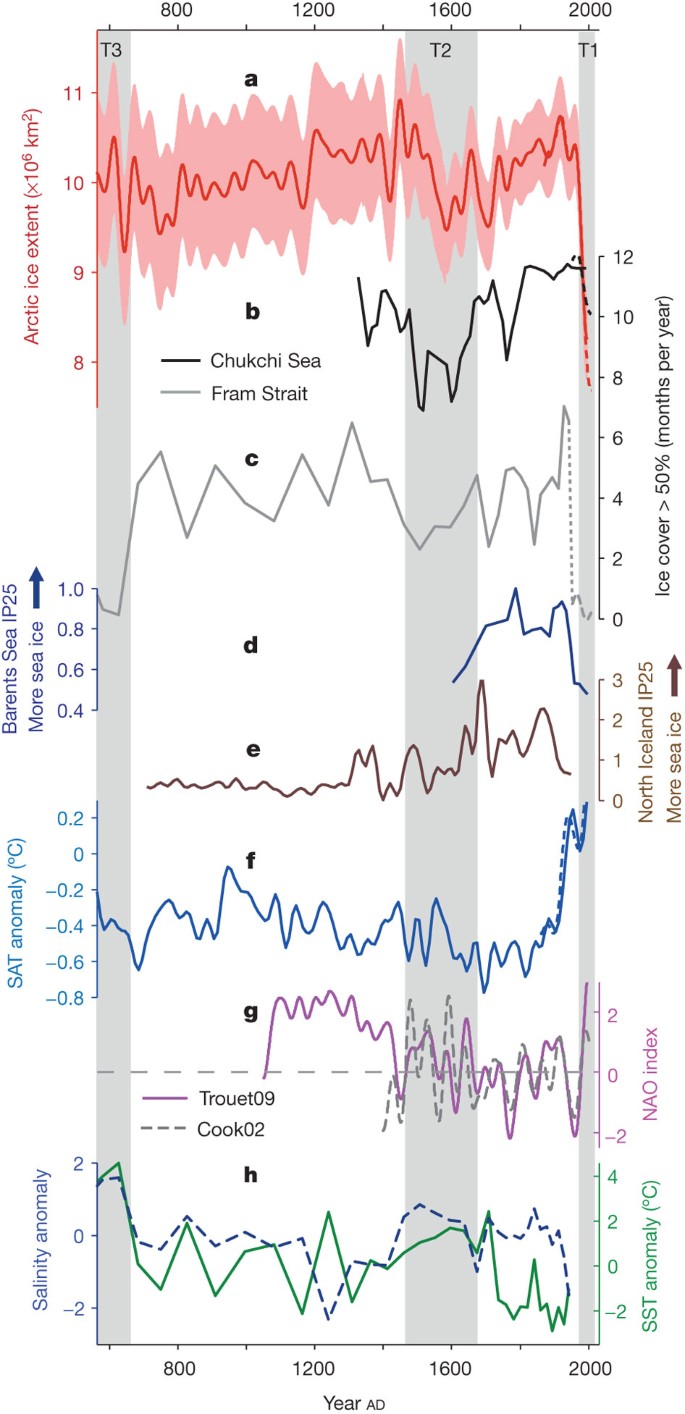
Sea Ice off the Iceland coast since 1200
Every year, there are still amateur sea voyagers who embark on trips through the “melted” North West Passage.
And are then confounded when they find themselves locked in ice, hoping for rescue.
Pro tip for them –
get your Arctic conditions reports from current satellite observations, not Al Gore’s moronic rants.
And most of them are successful, one example this year is a woman sailing singlehanded from London (end of May) via the NW passage to Alaska which she reached in early September. First British woman to sail the NW passage solo, did it in 95 days, like most of those who do so they get up to date satellite reports.
Yep, they skulk around through Cambridge Bay using satellite ice mapping and drones to find pathways through the ice.
No one has yet followed the St Roch route of 1944, in an old wooden boat with a 12.5HP motor and absolutely no satellite image help.
Whaling station remnants show sailing in the region used to be common.
The St Roch which was a RCMP schooner (over 100′ long and had a 150hp diesel engine). The 1944 route has been traversed, a 15m motor boat, Polar Bound, did so recently for example. Most of the whaling stations were on Baffin Island coast and Labrador.
Still one heck of a lot more sea ice than there has been for nearly all the last 10,000 years. !!
Red thumb doesn’t like facts… here’s some more for you.
The current extent of Arctic sea ice is in the top 5% or so of the Holocene.
Has recovered slightly from the extreme debilitating highs of the LIA and around 1979.
Arctic sea life last seen towards the end of the MWP is gradually starting to return.
Your fake version of Stein et al graph, based on a couple of sediment cores in the Chukchi and East Siberian Seas, there’s a model for you!
WRONG. The Stein graph is matched by basically every other graph from the around the Arctic region
Here’s another similar one
And one from another region
And one from above Iceland, only back 3000 years but still showing the same peak during the LIA
That isn’t sea ice extent it’s a reconstructions based on IP25 proxy from core MD99-2269 located North of Iceland. It ends in about the 1950s since when actual measured sea ice extent has dropped by about 3 million sq km! Kinnard et al showed that current sea ice extent is lower than any time in the last 1450 years.
 ?as=webp
Someone goofed, because the Holocene range of month above the average Wadhams is still below the current level.
And the Arctic sea ice is still very much in the seasonal category.. Far higher than for most of the Holocene.
The paper quoted was from 2008 and was for a single point in the Chukchi Sea.
In its introduction it said: “There is clear evidence that over the last 30 years the Arctic has been experiencing dramatic environmental changes (e.g., Serreze et al. 2000; Comiso and Parkinson 2004). Most notably, there has been a rapid decline in the extent and thickness of sea-ice in summer and more recently in winter as well (e.g., Parkinson et al. 1999; Comiso 2002; Serreze et al. 2003; Rigor and Wallace 2004; Meier et al. 2005; Comiso 2006; Comiso et al. 2008; Stroeve et al. 2008). It has been suggested that if the present trend continues the Arctic could experience ice-free summers within 30 years (Stroeve et al. 2008).”
Funny that there are so many whaling station remnants up there isn’t it.
Pretty hard to hunt for whales when it chock full of sea ice… Like most of the time now. Arctic sea creature not in evident since the end of the MWP are only just returning.
The MWP was warmer than now, and had less sea ice, as shown by Viking history and their travels in the Arctic.
Only the LIA and the period around 1979 had more sea ice than now.
And seriously, using the LIA as a reference, when we are looking at the whole of the Holocene..
Disingenuous to say the least.
Yes, there is less sea ice now than during the LIA. !
LIA was an anomalously high extent of year round sea ice that drove most of the Arctic sea creature out of the Arctic.
Why do you hate Arctic sea life so much that you think that TOO MUCH sea ice is a good thing ??
[exceeded your limits of replying to another user. no berating -mod]
How will he learn if not shown the facts..??
If multiple charts could be shown in one post, I wouldn’t need multiple posts to educate him.
Fact is that Barents sea was ice-free year-round between 8000 and 2000 years ago.
It is only ice-free for 2-4 months, if at all, recently.
The increase in sea ice happened about 2000 years ago, at the end of the Neoglaciation… and is still mostly there.
And here one of the Greenland Ice sheet volume, showing that it was increasing during the Neoglaciation, and peaked during the LIA, and has barely dropped since then.
Or we could look at Baltic bottom temperatures.. We same the same pattern.
Much warmer during nearly all the last 8,000 years.
The only difference between Stein’s original graph is the little red bit added as an estimate, and and the periods mark on it to guide ignorant people.
Rotating and expanding the scale to make it more readable does not change the data from the original graph. Here is the original graph (with LIA, MWP and RWP marked.. for ignorant people)
Still based on a couple of sediment cores and modeling, yet the model seaice volumes based on satellite measurements were criticized for being ‘models’!
Your attempts to deny the multiple lines of evidence is hilarious.
Here’s one from 4 parts of the Arctic.
And like the other graphs you show it’s a model and has no data for the last 75 years!
Note that Piomas shows a minimum ice volume ~4000 km^3 compared with the 1980s average minimum of ~15000 km^3.
And the fact that current Arctic temperatures are WELL BELOW the Holocene optimum is even more evidence. Even well below the MWP
It must suck to be the other side but maybe they are just used to be wrong all the time.
They probably aren’t too worried about being right when they can get backing from the mainstream ‘news’ media, which is all the typical layman ever sees.
The media have their own agenda, which doesn’t seem to include objectivity or truth.
They don’t CARE that they are wrong, and know that they are…
… they will still push the scam as far as they can. !
They have proven time and time again that their lies and misinformation are not an issue for them.
In other words, 2025 appears essentially to be tied for 10th place with two other years, and there were 9 other years with less ice. 2012 was an exceptional year — an outlier — not really a trend.
Less ‘extent’, i.e. dispersed ice, ice area was round about 4th lowest rather close to the previous low years.
But still in the 5% or so of the last 10,000 years.. VERY HIGH extent !!
PIOMAS shows no trend since 2011, despite 2 strong EL Nino events.
There once was a guy named Phil
He wants to give every girl a thrill
Danced and sang like a lark
But when excited, he’d fart
Girls ran from his swirling, stinky spill
All in good fun, eh!
Perhaps it would be good to point out, that the quote saying South Dakota’s area is 29,000 sq Miles is actually nearly 76,000 sq, Miles.
Paging Wieslaw Maslowski, paging Wieslaw Maslowski…
Your prediction of the arctic sea ice being melted in the summer by 2013 (made in 2007) is at the lost and found desk waiting for you to claim it. We also have your ‘updated’ prediction from 2011 where you forecasted: the summer melt could lead to ice-free Arctic seas by 2016 – “plus or minus three years”.
… paging Wieslaw Maslowski, paging Wieslaw Maslowski, please come claim your ice free arctic predictions at the lost and found desk…
And this guy is STILL employed by the Naval Postgraduate School. Why? He should be fired because he’s obviously a climate denier.
What he said was: “If this trend persists the Arctic Ocean will become ice-free by ~2013!”, note the exclamation mark. It was a remark made in his slide which followed a slide showing a quote by Julienne Stroeve “Given these conservative model results, along with the remarkable events of 2007, our view is that a seasonally ice-free Arctic Ocean might be realized as early as 2030.”
[too many responses to Phil. –mod]
Too much disinformation and nonsense from Phil. !
The implication of what Maslowski said was that he expected the trend to persist, but was providing the caveat to cover his — bases. Why would he go to the trouble to make the forecast if he didn’t think that it had merit? I interpret the function of the exclamation mark to be to draw attention to how soon it had high probability of happening.
It wasn’t the conclusion of his presentation, as I said this was a comment on an earlier projection by Stroeve. I fact in the published version of this work the value of 2016±3 was presented as an outlier, it wasn’t what he expected to happen.
This might be worth some investigation. I’ve noticed that the North West Passage Sea Ice page currently has more sea ice coverage (>15%) over the Beaufort Sea than does the NSIDC site. I would be keen to understand why there’s a discrepancy?
Arctic September trend is about -12%/decade but Arctic March trend is about -2%/decade. Averaging all the 12 months gives you 4.23%/decade or about a loss of about 19% over the 45 years of satellite scanning.
average Arctic ice extent in 1979 was 12.3 million km2 and was 10.5 million km2 in 2024. However in 2007 it was 10.7 million km2 so the great majority of the decline was pre 2007.
also there is an abundance of evidence that Arctic ice was very low in the 1930s and then increased as the planet entered a cooling phase from 1940 to 1976. So when satellite scanning started in late 1978, Arctic ice was at a high point and if hypothetically satellite scanning had started in 1940, there would have been no trend until now.
1000 years ago Vikings colonised Greenland and farmed land that is permafrost today so we know the Arctic was far hotter then (medieval warm period) and summer sea ice probably disappeared for 200 years.
after the MWP came the little ice age when temperatures plummeted and the Viking settlements n Greenland were abandoned and Europe suffered with black frosts, hail storms causing crop failure starvation and poverty. Arctic ice would have expanded immensely and glaciers advanced by kilometres. There are studies showing glacier bay in Alaska advanced by 100km and peaked about 1770. Since then glacier bay has receded 100km and us back to where it was at the end of the MWP.
during a rapid advance of some glaciers in Europe (a musket shot a day) priests would stand in front of the glaciers with a cross held out in front commanding the them to stop in the name of the lord.