In light of the recent Nature study I discussed yesterday in Settled Science Springs a Leak, it’s time to revisit a position I’ve long held—and, it turns out, one that now requires correction. Specifically, the long-standing assumption that carbon isotope ratios (δ¹³C and Δ¹⁴C) provide unambiguous proof that the rise in atmospheric CO2 is almost entirely anthropogenic.
For years, I’ve maintained that anyone challenging the anthropogenic origin of the CO2 increase had to address the isotope fingerprint argument before their work could be taken seriously. Submissions that didn’t engage with the Δ¹⁴C or δ¹³C evidence were declined, often with little further discussion. That confidence, I now recognize, was misplaced.
The recent study, Old carbon routed from land to the atmosphere by global river systems, has fundamentally altered the context in which the isotopic attribution arguments operate. According to the authors, 59% of global riverine CO2 emissions are sourced from old carbon, meaning millennial-aged carbon from deep soils, sediments, or rock weathering—not recently photosynthesized biomass.
These emissions are radiocarbon-dead, lacking the Δ¹⁴C signal, and are often depleted in δ¹³C—precisely the isotopic traits long attributed to fossil fuel combustion. Until now, these natural contributions were omitted from carbon cycle models and largely absent from attribution logic.
“This previously unrecognized release…equates to 1.2 ± 0.3 Pg C year⁻¹… and 41 ± 16% of river CO2 emissions…could contain recent anthropogenic-derived carbon.”
The implication is unambiguous: the very isotopic signatures used to claim anthropogenic dominance in atmospheric CO2 are now also emerging from newly recognized natural processes at global scale. These rivers are essentially exhaling ghosts—carbon that predates the industrial era by centuries or even millennia—and doing so in quantities on par with major biospheric fluxes.
The Isotope Argument Just Got Muddy
The confidence behind isotopic attribution rested on the idea that only fossil fuels could be responsible for the observed depletion in δ¹³C and Δ¹⁴C. This paper shatters that by showing that the Earth has its own large, continuous natural source of isotopically similar carbon.
Previously, isotope-based attribution was treated like a fingerprint match: the crime scene carbon looked like fossil fuel carbon, and fossil fuel emissions matched the rising levels in the air. Case closed.
But now we know there’s another suspect. And he’s been walking around in the open the whole time—we just didn’t test the rivers.
A Second Look, Long Overdue
To be clear, this doesn’t prove the rise in atmospheric CO2 is not anthropogenic. But it does mean that the evidentiary strength of isotopic data as a sole or dominant indicator of that origin is now substantially weaker.
Climate science has always leaned heavily on isotope ratios because they offered a veneer of mathematical certainty. With the carbon mass balance deeply uncertain, and the models riddled with arbitrary assumptions, the isotopes offered something that looked solid.
Now that, too, is compromised.
To those contributors whose submissions I rejected on the basis that they did not sufficiently address the isotope argument: I owe you an apology.
You raised objections in good faith. Many of you suspected that natural processes were more complex and underappreciated than the models allowed. This paper has proven that instinct correct. You didn’t need to disprove the Δ¹⁴C narrative outright; you simply needed the science to catch up to the question.
It just did.
Confidence Requires Humility
This study is a stark reminder that confidence in science is no substitute for humility in the face of uncertainty. That applies as much to editorial policy as it does to modelers, activists, or policymakers. In this case, the error was not in demanding rigor—but in assuming it had already been achieved.
Carbon isotope ratios remain valuable tools, but they are no longer unimpeachable witnesses. They are part of a broader, far more uncertain picture of how carbon moves through the Earth system—a picture we now know was missing a major river-fed chapter.
A Final Word
The takeaway is simple: no one gets to claim the science is settled when it just got rewritten.
And so, to every researcher, independent thinker, or persistent submitter who brought forth alternative views and was met with the standard rebuttal—“Come back when you’ve dealt with the isotope ratios”—you were due more openness than you received.
For that, I offer a strong, clear, and unreserved apology.
Discover more from Watts Up With That?
Subscribe to get the latest posts sent to your email.
For peat’s sake.
I see what you did there.
Fer peat’s sake, indeed.
Charles, you did not owe the anthropogenic carbon skeptics an apology. You were right, and they are wrong. Humility is a great virtue, but in this case it is misplaced.
This study doesn’t imply what you apparently think it implies. It just adds some minor details to our understanding of natural carbon fluxes. It has no impact on how we know that the ongoing rise in CO2 level is due to human CO2 emissions.
The evolution of the 12C:13C:14C isotope ratio is not how we know that the current CO2 increase is of human origin (mostly from “fossil CO2”). That fact is known from mass balance calculations. The evolving isotope ratios are consistent with that, but they’re not how we know it.
The 12C:13C:14C isotope data gives us clues about the dynamics of the carbon cycle: where natural CO2 emissions come from, where CO2 leaving the atmosphere goes, how fast carbon is exchanged between various “carbon reservoirs,” what the various “lifetimes” of carbon in the atmosphere are, etc. But they’re merely a “consistency check” w/r/t the fact that mankind gets the credit for the ongoing rise in CO2 level. That fact is determined conclusively from mass balance arithmetic.
For example, CO2/carbon from fossil fuels is slightly depleted in 13C, and almost completely depleted in 14C. In contrast, although CO2 from recent biomass decay is likewise slightly depleted in 13C, it is not depleted in 14C.
So CO2 from different sources affects the isotope ratios in the atmosphere differently. But those effects do not call into question the fact that the ongoing rise in atmospheric CO2 concentration is due to human CO2 emissions. Were it not for those human emissions, the atmospheric CO2 level would be falling (initially at a rate of 2 to 3 ppmv per year), rather than rising. (That would be a problem!)
Silly. There is no way to accurately quantify sinks and their response to changing concentrations, biological activity, or weather. Simply assuming a mass balance previously and not a dynamic system is naive.
Sinks or natural sources.
Charles, there’re no such assumptions, just measurements.
We know from ice core measurement data that over the last 800K years atmospheric CO2 levels varied by ≈90 ppmv between glacial maxima (bottoming out ≈190 ppmv) and interglacial optimums (peaking ≈280 ppmv).
We also know those ≈90 ppmv natural changes in CO2 level took something like 8,000 to 10,000 years to happen, which averages about 0.01 ppmv/year.
The CO2 level changes which occurred coincident with smaller, more recent natural climate cycles were only slightly more rapid. The decline in temperature from MWP peak to the bottom of the LIA reduced the atmospheric CO2 level in Antarctic ice cores by less than 9 ppmv, over 450 years.
Here are Law Dome (Antarctic) ice core data, back to year 1010. If you scroll down to “CO2, 75 Year Smoothed,” then keep scrolling, you can watch CO2 levels climb to their peak of 284.1 ppmv circa 1170 (MWP):
https://www1.ncdc.noaa.gov/pub/data/paleo/icecore/antarctica/law/law_co2.txt#:~:text=1170%20%20%20%20%20%20%20%20%20%20%20%20%20%20%20%20%20284.1
Then watch CO2 levels fall to their lowest level of 275.3 ppmv circa 1615 (LIA):
https://www1.ncdc.noaa.gov/pub/data/paleo/icecore/antarctica/law/law_co2.txt#:~:text=1615%20%20%20%20%20%20%20%20%20%20%20%20%20%20%20%20%20275.3%20%20%20%20%201620%20%20%20%20%20%20%20%20%20%20%20%20%20%20%20%20%20275.3
That’s a rate of change of about 0.02 ppmv/year.
(Aside: it’s also compelling evidence that the MWP and LIA were global, not merely regional, as the Pages2K/Marcott/Osborn hockey stick crowd would have you believe.)
Compare that to the current rate of CO2 increase, which is about +2.5 ppmv/year: i.e., more than 100× faster.
Mankind is currently adding CO2 to the air faster than Nature (the net sum of all natural “carbon fluxes,” positive & negative) is removing it, so the amount of CO2 in the air increasing. Here it is quantified:
Measurements show that the amount of CO2 in the atmosphere is increasing by about 2.5 ±0.1 ppmv/year. (1 ppmv CO2 = 7.8024 Gt CO2 = 2.12940 PgC.)
We can calculate quite closely, from economic data (mainly production & use of fossil fuels), that mankind is adding 4.7 ± 0.5 ppmv/year of fossil CO2 to the atmosphere, plus 0.5 ±0.3 ppmv/year CO2 from “land use changes” (clearing forests and draining swamps). That increases the amount of CO2 in the air by 4.4 to 6.0 ppmv/year. (The fossil CO2 figures are calculated from economic data: the amount of coal, oil & natural gas produced and burned.)
The difference between those two numbers is the rate at which nature is removing CO2 from the atmosphere: (5.2 ±0.8 ppmv/year) – (2.5 ±0.1 ppmv/year) = 2.7±0.9 ppmv/year.
The isotope data is consistent with that, a fact which is unaffected by Dean et al (2025). To learn the details see:
Engelbeen F, Hannon R, Burton D (2024). The Human Contribution to Atmospheric Carbon Dioxide. CO2 Coalition. https://doi.org/10.31219/osf.io/het6n
Dean et al is about a relatively minor detail: the “sources of one of the sources:” One of the many natural CO2 fluxes which, combined, constitute what we’re calling “nature.”
The system is, indeed dynamic: the higher atmospheric CO2 levels go, the faster natural “carbon sinks” remove it from the atmosphere. That is a powerful “negative feedback,” which helps to stabilize the Earth’s climate.
The two most important of those sinks are marine uptake and terrestrial “greening” / soils. They both accelerate approximately linearly as the CO2 level rises.
W/r/t absorption of CO2 by water, that linearity is probably obvious: the more CO2 molecules there are in the air, the more frequent are their collisions with liquid water.
Terrestrial biosphere uptake is less obviously linear, but it we know from agronomists’ studies that “CO2 fertilization” enhances C3 plant growth nearly linearly to above 1000 ppmv, and the plants that sequester most carbon (trees, sphagnum moss) are C3 plants.
So it shouldn’t surprise you to learn that the net rate of natural CO2 removals from the atmosphere is an approximately linear function of the CO2 level in the atmosphere. In fact, the rate of natural CO2 removal from the atmosphere accelerates by about 1 ppmv/year for every 50 ppmv rise in the atmospheric CO2 level (about 1/50 = 2%). That means the effective atmospheric lifetime (“adjustment time”) of CO2 added to the atmosphere is about 50 years.
(Aside: the IPCC’s SAR acknowledged that, in a roundabout way; it says, “Within 30 years about 40-60% of the CO2 currently released to the atmosphere is removed.” [SAR WGI TS B.1 p.15] That implies a half-life of 23 to 41 years, which implies an adjustment time (effective atmospheric lifetime) of halflife/ln(2) = 33 to 59 years. That means the rate of annual natural CO2 removals accelerates by 1/59 to 1/33 of the increase in CO2 level, which is 1.7% to 3.0%.)
Steady on there mate. Don’t be flagellating yourself because of something you didn’t know yet.
If you keep up the rejections now then sure, stop doing it and apologise for it if you still don’t stop.
Totally agree.
Charles wrote:
And my first thought was “No, Charles, you don’t owe anyone an apology. An open mind takes on board new information and changes its opinion. If only the Misleadia acted the same way.“
Ditto.
Didn’t know because never looked for … willful ignorance
No. Willful ignorance would be if someone said, “did you check the rivers” and it was ignored. Also, the Willfully ignorant would NEVER retract their misconclusions (yes, I know it is not a word, yet.)
Sir, I salute you.
Most of this goes pretty far over my head even though I try to understand, but that you’re admitting you were wrong, especially in a huge public forum like this, proves both bravery and humility — two qualities sadly absent from far too many people these days.
In particular those self-appointed “climate experts.”
Whenever the media hypes the glorified opinions of climate narrative pontificators, my mental image is the transmission shop advertisement where the guy at the desk assures the customer that “Our mechanics are experts” while in the background chimps wearing lab coats beat on transmissions with sticks.
Just wondering and a hypothesis to be tested…since there are many glaciers melting or retreating, I wonder if they contribute to the increase CO2 in the atmosphere similar to rivers. I’m not an expert or a scientist, I just enjoy reading the information posted on this website.
Almost certainly! However, inasmuch as new CO2 is being entrained with new snow, it probably does more to change the isotopic ratios than the total amount sequestered.
Clyde, the air in snow is just physically captured, there is no known shift in isotopic ratio from the air from the surrounding air at the place of precipitation, down to where the enclosed air from snow-firn-ice is completely trapped in the air bubbles in the ice, with one exception:
In stagnant air, the heavier isotopes and molecules tend to get enriches towards the bottom of the air column. That is measured by looking at the 15N/14N ratio, at the bottom of the air column where the ice pores are fully closing, compared to the same ratio in the atmosphere. The CO2 13C/12C ratio is adjusted for the similar “gravitational enhancement”, which in general is below 1% of the value in magnitude.
See: http://www.agu.org/pubs/crossref/1996/95JD03410.shtml
It was late at night and I’m afraid I didn’t state my thesis clearly enough because it was already past my bedtime and was rushing.
I was responding to John Aqua asking about the impact of melting glaciers on CO2. As old ice melts at the snout of a glacier, it releases the old air, which is depleted in CO2 compared to today. It will also have an isotopic ratio that presumably is more characteristic of pre-industrialization. During the current melting, new snow will entrain and sequester modern CO2. Thus, the net difference will be in replacing modern CO2 with ancient CO2, resulting in slightly reducing the current concentration and buffering the change in the isotopic ratio.
“The science is settled!!!”
That is repeated by every single scientifically illiterate alarmist that I know.
However, it is repeated by zero of the actual scientists that I know.
The people that say they “love science” don’t even understand the very basis of the scientific method.
Earth centric astronomy was obvious and settled—after all, the Sun came up in the east and set in the west—until Galileo’s telescope proved otherwise.
Phlogiston combustion was settled until Lavoisier discovered oxygen.
Luminiferous Aether interstellar light travel was settled until the Michelson-Morley interference experiment proved otherwise.
If it’s settled, it’s not science.
If it’s science, it’s not settled.
There. Settled that!
The are two types of people – those that divide things into two types, and those that don’t.
No. You have that wrong. There are three types of people. Those who understand mathematics and those who don’t.
Nope. There are 10 types of people. Those who understand binary, and those who don’t..
There are 12 kinds of people. Those who understand duodecimal and those that don’t.
Two kinds of people. Those that can extrapolate from incomplete data…
“For years, I’ve maintained that anyone challenging the anthropogenic origin of the CO2 increase had to address the isotope fingerprint argument before their work could be taken seriously.”
You don’t need an isotope argument. A simple mass argument is quite sufficient. Here is a graph tracing the mass of carbon in the air over the last millenium, as measured by samples at Mauna Loa and at Law Dome in Antarctica, compared with the mass that we put into the air directly.
Whatever happened in rivers etc, for over eight hundred years the mass of carbon in the air was constant. Then we started burning, and the rise in carbon in the air tracked the amount we put in very closely.
According to this graph, it looks to me that rise in CO2 content leads rise in CO2 emissions. Is this the case?
Yes. A minor contributor is the effect of land clearing from 1800 onwards. Here is a more elaborate graph (source) that includes that:
So which of your graphs shows the contribution of land clearing ONLY. I’m fairly sure that it has expanded a great deal since the 1800’s.
A quick look at Oz shows that around a quarter of the land has been cleared, (since 1770). How much CO2 rise did that represent on your graph?
https://en.wikipedia.org/wiki/Land_clearing_in_Australia
The purple curve on the second graph.
So the purple line shows all the effect, (does this include the recent findings about the OLD carbon coming out too).
How settled is this ‘science’ now? I’m thinking that the recent study, (regarding old carbon in rivers), has just thrown all your charts into the waste basket.
The purple line estimates land clearance. It does not include river effects.
But how would this supposed old carbon in rivers contribute to this pattern of 800 stable years and then a rapid recent rise proportional to the carbon we burnt?
Where is the line that shows emissions from geologic activity?
(incl volcanic, oceans, glacier cover, etc.)
Not there, and that is the point. Geologic was one of the fluxes that kept CO2 steady for 800 years. There is no evidence that it changed. The change came when we started putting CO2 in the air, and the ppm rose proportional to our additions.
If you want to postulate that the contribution from rivers has played a role in the recent increase in CO2 levels, you need to demonstrate an increase in river flow and erosion that matches the increase atmospheric CO2.
It is argued that the Clausius-Clapeyron relationship increases the potential for increasing the absolute humidity, which will increase precipitation. Also, as it warms, there will be less water sequestered in ice, allowing for an increase in rain.
There is no attribution for that graph, and I don’t see how it could be such a smooth curve for forested land. It would be an amazing coincidence. Europe has been deforested for centuries. In the US, average wood-per-acre volumes have almost doubled since the 1950s. The US is not a small country! The United States has more trees today than we had 100 years ago. That graph claims there are places on Earth that deforested areas at the same yearly rate that the US re-forested, plus they deforested additional land at a constant growing rate for the last seventy-five years. In other words, that graph is just too damn smooth to reflect reality.
There is an attribution at the source. It comes from a series of papers of Houghton, of which this iis the most comprehensive, but there are updates. It is a smooth curve because it is global – variations average out. Recent tropical land clearances have been huge.
But this is a wrinkle on the main graph. Nothing happened for over 800 years, and then CO2 in air started skyrocketing just in proportion to our burning (and land clearing).
Small variations average out over long periods, not every year, even globally. That the US reforested at the same rate that the rest of the world deforested, plus a constant growth rate, every year for decades is not believable by any reasonable standards. Further, in recent years, according to NASA, the earth has substantially more vegetation than just a decade ago (all that fertilizer we put in the air). The deforestation/land clearing line should be dropping. Vegetation on earth has been increasing, not decreasing.
Land clearing follows population growth and to a lesser extent, economic growth. When averaged over all population groups, those two are quite regular.
It’s the classic science problem correlation does not prove cause. You are already hand waving at lead-lag problems.
Here is one to add to your graphs world historic GDP overlay it
https://ourworldindata.org/grapher/global-gdp-over-the-long-run
The answer is simple to stop CO2 emission take world GDP back to 1880 levels 🙂
You put CO2 in the air. You then find CO2 in the air. You don’t need correlation to prove cause.
By your logic the creek that runs through my town is what keeps the ocean full.
No, the emissions are more than enough to account for the observed rise. That is not the case for your creek.
Sorry wrong you have a carbon cycle … it is exactly the same as the creek and ocean problem. You are falling for the classic personal bias problem you HAVE TO PROVE IT IN SCIENCE.
Why do you think actual scientists tried to prove it using isotopes which is the whole post topic. Unlike you they weren’t dropkicks and just declare it so because they could hand wave it they tried to act like scientists and prove it.
Did you look for CO2 in the air first? Maybe it was already there.
“You don’t need correlation to prove cause.”
YES YOU DO!!! Go back to sleep.
Deforesting in the tropics is far more damaging per acre than in colder climates like New England
About 100 years ago, we did not have a heat island stretching from north of Portland, Maine to south of Norfolk, Virginia, about 700 miles, then mostly forested, now covered with heat absorbing human detritus, plus impacted by waste heat from burning fossil fuels.
Almost all of west Europe is a heat island
Nature and statistics abhor a straight line. You know something is wrong when one appears.
Nothing was happening to change ppm CO2. So ppm did not change. It needs a source.
Argument to ignorance. Nothing THAT YOU KNOW OF.
Different time constants sir.
It’s this time constant that matters.
Did you just splice ice core data onto the end of Mona Loa observatory data?
I think most people who read the comments section on WUWT will understand reasons that’s a problem.
He also doesn’t mention that human emissions are estimated. They are impossible to measure, so the number is made up, based on the calculated change in the ratio of c13 to c12, the measured increase at mauna loa, and the assumed output of human activities. This new study destroys that entire construct, but he’s repeating it as if it is unchallenged.
Human emissions are very well known. Burning carbon costs, and an army of accountants (including tax) are calculating.
They are not well known. They are modelled, based on assumptions formed from the measured change of co2 in the atmosphere and the isotope ratio.
That is not true, they are estimated based on documented consumption of fossil fuels.
A small contribution, some 4% of total “carbon” flux.
Be very thankful for that, and for the development of the use of “fossil fuels”
Without them, your life would be very pitiful in deed.
Burning carbon does not “cost”…
… it has been an overwhelming BENEFIT to the planet and all of mankind.
I would agree that the human emissions, particularly from fossil fuels, is known with greater precision than natural emissions. Therein lies the problem. We are assuming that prior to the industrial revolution that the system was in balance and natural emissions were balanced by sinks. However, we know that isn’t true because ice cores tells us that atmospheric CO2 was much lower during the last major glaciation. We have a gap in instrumental measurements between the Pleistocene and 1958.
“ We are assuming that prior to the industrial revolution that the system was in balance and natural emissions were balanced by sinks.”
It is not assumed. It is measured. 800 years of ±2% vatiation. Yes, of course glaciation makes a difference.
It is estimated and approximated by indirect measurements.
Not going to debate with a religious zealot.
How does one measure the impact on the atmosphere when numerous recessional moraines are evidence that episodic losses of at least alpine glaciers was common during the late-Pleistocene. The advancing glaciers during the late-Pleistocene and Little Ice Age are even more problematic. We have to rely on proxies (not actual in-the-field measurements) with there attendant assumptions and less-than-perfect correlations.
Energy of any kind costs. TANSTAAFL.
We know within a few percent how much fossil fuels have been mined/drilled.
The calculations of how much CO2 is generated by burning said fossil fuels are straight forward.
You are correct that these values are estimates, but estimates is not the same as wild guess. In this case, the estimates are within fairly tight parameters.
In fact, according to these calculations, the burning of fossil fuels has released several times more CO2, than has ended up in the atmosphere. There needs to be research into just what sink is absorbing all that extra CO2.
The question is not, does burning CO2 increase atmospheric CO2 concentrations, it does. The question is why doesn’t the burning of fossil fuels, increase atmospheric CO2 concentrations by more than it does.
Just because we know how much fossil fuels have been mined and drilled doesn’t translate into it all being burned. The use of plastics has grown tremendously over the last 50 – 75 years. That will change the attribution ratios of what is used for burning and for other purposes.
Jim, plastics is only 2% of fossil fuel use, up to 6% in industrial countries, but that is not what is used for fossil CO2 emissions: the figures are based on fossil fuel sales (taxes!) and burning efficiency, quite accurate, even if not all is immediately burned, most is within a few months to a few years.
Maybe somewhat underestimated, due to the human nature to avoid taxes. Certainly not overestimated…
Also, the assumption is that every lump of coal, every drop of oit, every natural gas burns exactly the same with exactly the same emissions in every of the multiple and varied thermal generation plants.
Brown coal does not burn the same as lignite.
Okay, 10 PgC/year +/- 10%, or +/- 1 PgC/year from fossil fuel burning, excluding land use changes that also add 1-2 PgC/year.
Probably more like -0/+20% as humans don’t like to pay taxes.
Increase in the atmosphere: 5 +/- 3 PgC. Worst cases during an El Niño: +8 PgC in the atmosphere with lowest case fossil emissions at +9 PgC.
And that doesn’t prove that fossil emissions are to blame?
No. It proves that burning coal and hydrocarbons contribute something.
Those are not the only sources of CO2 entering the atmosphere and we have barely scratch the surface discovering the truth.
We now mine FF containing about 10 Gt carbon a year. The carbon content alone would occupy about 5 cu km. If a significant fraction was not burnt, it would pile up real fast.
One possibility to entertain is that the types and magnitude of all sinks are not properly accounted for.
Ice core is shown in green. Mauna Loa in blue. As expected, they overlap. They are both direct measures of CO2 in the air.
Mauna Loa measurements are direct in the sense that absorption spectra from representative samples are calibrated against known standards.
Ice core measurements are proxies that represent some fraction of air that is trapped indirectly over a period of time. Calibration relies on the assumption that air is both captured and liberated efficiently, although no real standards exist for this type of measurement.
They are not proxies. They are samples of actual air from the time, and analysed accordingly.
Garbage. CO2 diffuses through ice.
No way the ice cores are accurate to what they show – no change for thousands of years. The very fact that there is no change at all in the ice cores prove they must be wrong. CO2 may not diffuse quickly through old, dense ice but the time when that ice was laid down it was not old nor dense and would have been far more porous.
Not settled.
Here are corresponding data from 4 different locations (the Law Dome used new cores). It’s a finer scale, so looks more variable, but in fact only varies pre-1800 between 270 and 290 ppm, and actually mostly between 275 and 285 ppm. They can’t all be making the same errors.
Thanks for showing how dangerously low atmospheric CO2 levels have been for a long time.
Be very glad that they have now risen above basic plant subsistence level.
More would be highly beneficial
“They can’t be all be making the same errors ”
Why not?
They are actually more likely to all be making the same mistake because they are based on a common assumption. Every science theory that ever fell went like that we had multiple things that all said the same thing then along came one that didn’t fit 🙂
Yes. Systematic errors are likely to be the same for a given set of conditions. For decades, ice core measurements didn’t give desired results, so they had to “refine” sample handling in numerous ways.
Nick: It’s good to see you’re referencing WUWT posts to support your argument.
That’s Figure 1 from Hannon, 2021…
https://wattsupwiththat.com/2021/07/02/greenland-ice-core-co2-during-the-past-1000-years/
Must be right, then 🙂
Mike, the “diffusion” was estimated for the relative “warm” Siple Dome ice core and is peanuts at -23°C: some 10% “broadening” of the resolution (from 20 to 22 years) at middle depth up to a doubling at bottom rock. That is all.
These estimates are from the CO2 near melt layers, which may not reflect the “normal” migration:
https://catalogue.nla.gov.au/catalog/3773250
For the much colder central ice cores (Vostok, Dome C) at -40°C, the migration gets simply immeasurable…
Mike, if there was appreciable diffusion is completely refuted by the fact that there is some 80 ppmv (and more) difference between a glacial and interglacial period in the ice cores. Completely in ratio with Antarctic temperatures of the air where the snow was formed:

The discrepancy (mainly at the high side) is from the fact that the data were not compensated for the (long) lags of CO2 after T changes.
The levels of CO2 in still open pores of firn and already closed bubbles in ice are exactly the same and migration from CO2 from one bubble to the next with exactly the same CO2 levels is non-existing.
Migration through meters of ice for a difference of up to 100 ppmv may be theoretically possible, but not seen over 800,000 years:
 ?fit=850%2C327&ssl=1
If there was an appreciable migration, the CO2/T ratio would fade the further you go back in time…
Surface melts, water sinks and refreezes.
At -40°C at Vostok?
Neftel did find one (!) melt layer at 70 meter depth in the Siple Dome record and adjusted his ice age – gas age difference accordingly.
No melt layers at Law Dome (coastal) neither at Vostok or Dome C, far inland and much higher in altitude and colder, even in “summer”…
Yes. Just like ice can evaporate at cold temperatures.
It is not the air temperature. It is energy. Sunlight on ice even very cold will melt the surface a bit and the water sinks and is refrozen. Air blowing on ice will also affect the surface in similar fashion.
This is a different process than what causes melt layers.
No, they are not measurements conducted in the manner of modern sampling such as at MLO. There are assumptions that rationalize treating the air released from melting slices in the ice cores as though one were actually measuring the atmosphere. They may be accurate representations, but they are still proxies for measuring the air in place at the time.
Clyde, CO2 in ice cores are direct measurements, made with the same methods as for CO2 in the atmosphere. They simply are measurements of ancient air with all the constituents of it. That includes radiocarbon and CFC’s in recent decades.
That is not the same as “proxies” where some variable may have a direct correlation with a variable of interest…
The only drawback of ice core CO2 is that the air is a mix of several years, from about 8 years (Law Dome) to 560 years (Dome C) and 600 years (Vostok), depending of the local snow precipitation per year…
Ice core analysis can in no way be a “direct” measurement. They become “proxies” not because of the analysis method, but because of how the sample is captured, handled and processed.
A direct chemical analysis of an air sample would involve something like sticking a probe into the air and making the measurement. One might collect an air sample over time using a composite sampler to smooth out temporal fluctuations but in doing so, the results become proxies, just like ice cores.
Sorry, there is not the slightest difference between a direct measurement of CO2 in the atmosphere and a sample of air trapped into an ice bubble 800,000 years ago.
And any sample you take directly in the atmosphere also is an average of what is mixed over a certain time frame: it takes 2 years to mix the NH changes (both seasonal from vegetation as from humans) into the air sampled at the South Pole.
Proxies are from different variables which have some kind of correlation with each other. Averaged samples are not proxies in the same sense, they show exact the composition of a sample, be it averaged over a time frame.
There seem to be a lot more factors in play than just the measurement of the partial pressure of CO2 in a gas bubble.
(which indeed should be similar to an atmospheric measurement besides the smaller gas volume!?)
Impurities and pressure should affect the chemistry in the gas bubbles and the fact that chemistry and diffusion processes are temperature dependent should impact any comparison of different samples.
Impurities are a major problem in ice cores from Greenland, where frequent (acidic) Icelandic volcanic eruptions may interfere with carbonates from the oceans. Far less for (inland) ice cores of Antarctica.
That was the reason that the old method: melting of the ice and sampling of the CO2 was abandoned (especially for the Greenland cores), because CO2 was increasing over time in the melt…
Later on the grating technique was adopted: grating a portion of the ice core under vacuum, which recovers some 80% of the bubble content.
Nowadays and always for isotopic measurements, more and more the sublimation technique is used: all ice is sublimated with an IR lamp just under freezing temperatures, sublimating everything, over a freezing water trap and a cryogenic trap. After that, selective warming releases all gases, including O2 and N2, step by step for analyses, recovering 99.7% of all gases.
The only drawback: far more time consuming than the grating technique…
Ferdinand Engelbeen wrote
“”Sorry, there is not the slightest difference between a direct measurement of CO2 in the atmosphere and a sample of air trapped into an ice bubble 800,000 years ago”””
and
“””Impurities are a major problem in ice cores from Greenland, where frequent (acidic) Iccelandic volcanic eruptions may interfere with carbonates from the oceans.”””
“””melting of the ice and sampling of the CO2 was abandoned (especially for the Greenland cores), because CO2 was increasing over time in the melt…”””
“””Later on the grating technique was adopted:”””
“””Nowadays and always for isotopic measurements, more and more the sublimation technique is used:”””
(being slow means it keeps the old ice in a new environment longer)
Non of that inspires any confidence that these values represent former atmospheric CO2 levels.
It reminds me of that joke that there are 1000s of books about relationships, if anyone had figured it out, one would be enough!
But clearly if the CO2 concentration is so sensitive to the extraction method, the storage conditions could also play a role.
Last not least there is also the selection bias which needs to be quantified, how much do these proxies represent the global values.
LoN,
The problems with CO2 in ice cores were mainly for the Greenland cores, not for the Antarctic cores. Thus for most other gases (like CH4) both places give the same result. Not for CO2, where impurities play a large role in the Greenland ice cores. Reason why the melting technique as abandoned for CO2 and Greenland cores are not used for CO2 levels.
Both the grating technique and the sublimation technique show the same results, but sublimation is used to be sure that all CO2 is used for isotopic analyses and that no isotopic fractionation can play a role.
It also needs smaller samples, so that the samples can be taken on shorter (time) distance of the core.
And time plays no role at all: if one samples the same core (as was the case for the Siple Dome ice core) after many years, one still finds the same low levels, despite that the CO2 in the storage rooms (and measuring labs) may be twice as high as in the ice core.
And if the CO2 measurements at the South Pole represent the current global CO2 levels within 15 ppmv, despite a 2.5 ppmv/year growth, of which 90% origins in the NH, then I don’t see any reason to not trust the ice core changes over glacial – interglacial periods with a “speed” of change of 0.02 ppmv/year…
Not to mention melt water brine in glacial ice which exists at temperatures of up to 70 degrees below zero.
Which would easily remove CO2 from air bubbles it comes into contact with.
Analytical measurements are very much matrix dependent, especially between different phases, gas, liquid, solid.
That is the reason that the sampling is just below freezing both for the grating technique as for the sublimation. Both under vacuum, removing any water-like layer of the ice surface (for the grating technique) and the first step is over a cold trap to freeze water vapor out, That forms a uniform layer where no CO2 inside the ice can hide (only adhere at the surface in a tiny amount)…
Nah, no difference at all. An average of 600 years vs. a snapshot in real rime. 🙄
That is a common method of deriving a relationship between a variable of interest that is unmeasurable directly, and something that is measurable. But it is not the essence of the definition. The essence is that when something is not immediately and directly measurable at a desired time and place, a substitute has to be found. That substitute is called a proxy. In the case of ice cores, it is difficult to know the altitude of the snow/firn/ice when each formed, the temperature of the snow when it fell, the altitude of the snow when it formed in the cloud, and what thermal variations took place between the transition to ice and when it was cored. I observed water saturated firn on the surface of the Greenland Ice Sheet in 1966; it appeared to be over a meter thick in July, about 20 miles from the coast, near what was then Thule AB. I don’t have a lot of confidence that the annual surface melting doesn’t alter the air composition, as is assumed.
You are using it as a proxies for ‘all over the place’.
How have you calibrated your proxy; Mona Loa vs All over everywhere.
Mauna Loa CO2 measurements are not a proxy, Don. The location (high on a mountain, on the side which usually has a Pacific sea breeze) was chosen to avoid distortions from local effects. It seems quite well-mixed air. Averaged over a year, the CO2 measurement data from Mauna Loa is within ≪ 1% of the “all over everywhere” average, as demonstrated by comparing with measurements from other sites, such as Cape Grim.
Have you seen the “local effects” in the Mauna Loa measurements?
Seasonal variations are quite pronounced.
That is the unstated assumption. Inasmuch as the measurements weren’t actually taken hundreds or thousands of years ago, the samples ARE proxies for what existed at the time. Modern analyses may be accurate for the present ice CO2 content, but there is still the unstated assumption that there is no systematic bias as a result of altitude of snow deposition entraining air, or that the snow crystals do not have any CO2 incorporated into the crystal from the freezing level, and the measurements represent the entire year and not just the time of the year when the seasonal atmospheric variation is at the lowest — when Summer melting stops.
Did you not know that the natives in Hawaii kept very accurate records of atmospheric CO2 starting in 1000 AD?
If it got too high did they throw a young, carbon-based lifeform into the volcano?
KevinM, the ice core data are not “just spliced” with the Mauna Loa data. The ice core data from Law Dome have an overlap of about 20 years (1958-1978) with the direct measurements at the South Pole. The CO2 data for the overlap are here:

From: https://agupubs.onlinelibrary.wiley.com/doi/10.1029/95JD03410 unfortunately, the rest is behind a paywall.
The Law Dome ice cores have a resolution of less than a decade and an accuracy of 1.2 ppmv (1 sigma). Even a one-year peak of 20 ppmv would be detected…
Even if the overlap is only 20 years, consecutive ice cores with less and less resolution overlap each other, up to 800,000 years within 5 ppmv of each other for the entire length of the record. The current 130 ppmv peak in 170 years would be detected in 800,000 year old ice as an unnormal peak of ~20 ppmv…
I recall reading that they arbitrarily changed the “age” of the ice core proxies by I believe it was ~72 years WITHOUT any scientific justification to make it LOOK like there is a smooth overlap with MLO measurements.
The actual record without the age shifting applied showed higher levels than the beginning of MLO measurements *prior to* said measurements.
I also recall reading that “high” values (in excess of what they THOUGHT they “should be”) were discarded as “outliers.”
In other words, the flat, unchanging “record” is more “working backwards from the preconceived conclusion” garbage.
That is incorrect, AiNS. Measurements of CO2 levels in ice cores bubbles are not “proxies,” but they do have challenges.
One challenge is obviously the small sample sizes. Fortunately, modern analytical techniques are pretty good at dealing with that.
Another challenge is that ice is quite brittle, and it is easy to get cracks in extracted ice cores, through which atmosphere can seep. That type of sample contamination causes outlier readings, which must be discarded. There’s nothing unscientific or arbitrary or biased about that, it’s just good scientific practice.
Another challenge is the fact that the ice and the air are different ages. Soft, fluffy snow is very porous, so for some time after the snow falls there are ongoing exchanges of air between the open atmosphere and the gaps in the snow. As the snow piles up, gravity compresses it, first into firn, then into solid ice. That seals the air in the bubbles. At that point, exchanges with the atmosphere cease.
At sites with high snow accumulation rates, the elapsed time between when the snow falls than when the air bubbles are sealed is relatively short. Those sites are near the coast, and they get lots of “ocean-effect snowfall.” But at sites in the Antarctic interior, where the snow buildup is much slower, it takes many years before the air bubbles are sealed.
Consequently, different air age adjustments are required for different ice cores, according to the thickness of the annual layers, due to the varying snow accumulation rates. It is not “garbage” or “without scientific justification.” It is sound practice, based on a good understanding of how snow is compressed into ice.
Most “climate data” is pretty awful, but there are exceptions. Sea-level measurements at the best coastal locations, such as Honolulu, are excellent. The CO2 measurements at Mauna Loa, Cape Grim, and other sites are also excellent. CO2 measurements from Antarctic ice cores are not as good as that, but they are still quite good, and they are certainly far better than things like “global temperature” estimates of similar vintage, or model-derived nonsense like PIOMAS.
They are proxies.
Whatever the CO2 measurement for 1000 AD was NOT made in 1000 AD so the very definition of these measurements are proxy.
Prosecutor: Your Honor, the accused was seen in that neighborhood on the night of the murder.
Judge: So are you saying that’s sufficient proof of a capital crime?
Prosecutor: Well Your Honor, it’s all we’ve got, so ergo, that proves the crime as charged.
Judge IPCC : Officers, take the prisoner down.
The accused was observed putting arsenic in the victim’s food. Arsenic was found in the body. Where could it have come from?
But arsenic was also found in other food from the same restaurant that the accused never had access to.
Judge: Belay my last order.
I’ve just been handed a report that the arsenic found in the victim’s body was organic (naturally occurring) arsenic in low concentration, unharmful to humans.
The alleged observation of the accused putting inorganic toxic arsenic in the victim’s food is clearly perjury.
Officers, take the perjurer down.
He ate a few peach pits, his tap water was at 43 ppb, and the neighbor (completely unobserved, unrecognized, and unknown) added arsenic salts to the mix.
So, yes, he is guilty of the attempt, but in a Perry Mason like case, the unknown neighbor is the murder.
Your honor, there is no crime, except the crime of false accusations perpetrated against my client, the defendant, Mr. CO2 Emission. His only “crime” is massively increasing agricultural productivity and global food security, and greening the Earth.
Mr. CO2 Emission is the Earth’s Good Samaritan. We should be giving him the keys to the city, not falsely accusing and prosecuting him. I move for immediate dismissal of all charges.
Sorry, but I don’t understand the graph. The upper lines appear to be thin red, green and blue stuck on the tail end of the green. The lower line is thick red. The upper lines apparently track along the 600 “Gton C” line from 1000CE to 1800 CE. All of that is green but also thin red. What is the thin red line representing at that point? The thick red line is at zero for the same time duration. So there were zero cumulative emissions during these centuries? No volcanos? No forests burning? No decay of vegetable material? That can’t be right; hence, my confusion about what is being shown. Then from about 1880 to 2012 the thick red line goes from zero to about 380 “Gton C”. During the same time it appears the thin red line goes from 600 to 815. So for every Gton increase in the thick red line there is a .56 Ton increase in the thin red line. I just don’t see how the thick red line could be Cumulative Emissions as it is represented to be. It might be annual emissions that are increasing, but not cumulative emissions it seems to me.
The green is CO2 measured at Law Dome; the blue is CO2 measured at Mauna Loa. The ppm CO2 is converted to tons C in the atmosphere by the ratio based on molecular weight and known mass of atmosphere: 1ppm = 2.13 Gtons C. The lower curve is the cumulative C emissions. The faint red curve near the green and blue is emissions scaled by airborne fraction (0.57 Scripps – details here) and added to the pre-1800 base. So you can see how well the amount in the air tracks cumulative emissions. If you allow for land clearance, as in the second graph, it tracks even better.
Nick, I really hate the “airborne fraction” concept, because it confuses many people.
Many people think it means that some fixed “airborne fraction” (roughly half) of CO2 goes into the atmosphere, and the rest is magically teleported into the oceans and biosphere. That’s nonsense.
As you have ably demonstrated, the apparent near constancy of “airborne fraction” is simply an artifact of the approximately logarithmic growth in human CO2 emissions, and the fact that natural CO2 removals accelerate linearly with rising CO2 levels.
If human CO2 emissions were suddenly reduced by 5.3 PgC/yr (= 2.5 ppmv/year), i.e., approximately halved, then natural CO2 removals would equal anthropogenic emissions, the atmospheric CO2 level would plateau, and the “airborne fraction” would be zero. If human CO2 emissions were suddenly reduced by more than that, then the atmospheric CO2 level would be falling, and the “airborne fraction” would be negative.
The Scripps figure of 57% is not based on any physical principles, it is just curve matching. Any two smoothly accelerating curves can be matched pretty closely, but that doesn’t imply anything about their relation.
Also, that 57% figure is from fossil CO2 emissions alone, ignoring “land use change” emissions. I don’t have a problem with that, because we have good numbers for fossil CO2 emissions [at worst, ±10%], and we have only very rough estimates for land use change emissions, but if an estimate of land use change emissions is included, then the percentage is smaller (and equally meaningless).
Scripps’ “airborne fraction” graph wrongly suggests (and many readers assume it means) that the atmospheric CO2 level, and consequent warming, rise as a fixed percentage “cumulative emissions” of CO2, so natural CO2 removals don’t affect warming. That’s the basis for the IPCC’s TCRE & RCB, and the “net zero” campaign.
It is basically homeopathy, applied to climatology instead of medicine.
Homeopathic medicine is based on the concept of “water memory”—the belief that the mere memory of a substance dissolved in water causes it to still have therapeutic effect even if it’s diluted so much that there’s not a single molecule of the therapeutic agent left in the solution.
Homeopathic climatology (TCRE / RCB / Net Zero) is similar. In the real world, CO2 removed from the atmosphere no longer has a warming effect. But homeopathic climatology ignores the natural removal of CO2, and considers ONLY the additions of CO2 to the air. That could only make sense if the mere memory of CO2 once in the atmosphere still had just as much warming effect as the CO2 had before it was removed.
And AR6 endorses that!
Dave
“airborne fraction”
Yes, as you point out, it is rather a dynamic relation. I just used the Scripps number to rescale the cumulative emissions to show how closely they could overlay the growth of CO2 in the air. I could have used an empirical value to achieve the match.
Over most of that period the Earth was cooling into the LIA.
You argument is empty.
His argument was about CO2 levels vs fossil fuel consumption.
In this instance, he said nothing about whether CO2 influences air temperatures.
One wouldn’t expect CO2 levels to climb while the Earth is cooling to the LIA. !
They only started to climb as the planet started to warm out of the LIA.
bnice2000,
The effect of temperature on CO2 levels over ice ages is about 8 ppmv/°C for Antarctic temperature changes over the past 800,000 years. For global temperature changes that gives 15-20 ppmv/°C.
Recent changes are in the order of 3.5 ppmv/°C on short term (El NIño, Pinatubo).
The influence of temperature on ocean surface pCO2 (which is the main driver for CO2 in the atmosphere) is around 16 ppmv/°C and can be exactly calculated with the formula of Takahashi (based on near one million seawater samples):
(pCO2)seawater AT Tnew = (pCO2)seawater AT Told x EXP[0.0423 x (Tnew – Told)]
That gives an about 4% rise per °C increase of the SST.
Vegetation works in the opposite direction…
That means, that without human emissions, the CO2 level in the atmosphere would have risen some 13 ppmv since the LIA, the rest of the 130 ppmv rise is form the over 200 ppmv fossil fuel emissions…
Or 10% natural, 90% human.
You have zero data for how much extra CO2 is coming from natural sources
The ratio of natural to human CO2 is around 24:1 ie about 4% human CO2.
Basically all the human released is absorbed into the natural cycle
Any human released CO2 become “natural” part of the carbon cycle very quickly.
It has been shown there is very little isotopic human CO2 in the atmosphere.
The rate of CO2 increase follows very closely behind ocean temperatures, even to the step change in CO2 rate of increase from the step change of temperatures from the El Nino events
There are enough data that show how much CO2 each season is exchanged between atmosphere and oceans or vegetation. With large margins of error, but that is completely unimportant. Even if the natural inputs doubled or halved, that doesn’t influence the increase in the atmosphere: as long as human emissions are larger than the observed increase in the atmosphere, then human emissions are responsible for the increase and the net natural balance is more sink than source.
Increase = human emissions + natural emissions – natural sinks
For the current atmosphere (app.) per year:
5 PgC = 10 PgC + X – Y
X – Y = -5 PgC
If X = 10 PgC/yr then Y = 15 PgC/yr
If X = 210 PgC/yr then Y = 215 PgC/yr (figures IPCC)
If X = 1000 PgC/yr then Y = 1005 PgC/yr
Thus whatever the natural fluxes are, these are not of the slightest interest for the cause of the increase in the atmosphere.
And please, use variables of the same order if you compare changes: CO2 vs T or ΔCO2 vs. ΔT not T vs. ΔCO2, or you are fooling yourself:

The the derivative of T has no trend, only a small offset from zero, but T has with a small (pi/2) lag after the derivative and so is the variability of the derivative of CO2, which makes that T and ΔCO2 are fully synchronized, so which one drives the other?
If one also plots the yearly fossil emissions with the derivatives, it is clear which drives what:

That are 13-month moving averages for dT/dt and dCO2/dt and yearly emissions of fossil fuels.
It is clear that temperature is the cause of near all variability in rate of change of CO2, but as clear that human emissions are fully responsible for the trend…
“And please, use variables of the same order if you compare changes: CO2 vs T or ΔCO2 vs. ΔT not T vs. ΔCO2, or you are fooling yourself:”
“which makes that T and ΔCO2 are fully synchronized, so which one drives the other?”
Ferdinand you are the person fooling himself as you wrongly used the annual emissions time series instead of the annual emissions derivative as you apparently intended in your “Derivatives of temperature and CO2” plot, thus your conclusions regarding the source of the trend are false. Here is what emissions and their derivative look like together, using annual data (and dPlot):
I see no problem with using T vs. ΔCO2, like here:
The Monthly ML CO2 12ma∆ trend in panel 1 is increasing at 2.2x the rate of the HadSST4 Tropics Anomaly trend, indicating part is controlled by temperature and the rest by emissions.
The rising annual temperature has effected the CO2 annual derivative, at zero lag. Synchronized, just as you said. The CO2 monthly derivative was annualized to compare to the tropics SST anomaly trend.
It is clear ocean temperature significantly drives CO2 anomalies which lag every important ocean and atmospheric temperature indice.
Can you tell me how I fooled myself with that Ferdinand?
“Thus whatever the natural fluxes are, these are not of the slightest interest for the cause of the increase in the atmosphere.”
“It is clear that temperature is the cause of near all variability in rate of change of CO2, but as clear that human emissions are fully responsible for the trend…”
No, it is clear the mass balance equation must include larger annual natural fluxes on top of emissions in order for the annual carbon cycle rising phase which includes emissions to attain the levels it has reached, as cumulative emissions comprised only 49.6% of the rising phase CO2 since 1959, based on carbon cycle year as shown below in panel 1.
Net MME after sinking comprise only about 39.1% of the net ML CO2 cumulatively since 1959, even though annual MME always exceeds the annual net ML CO2. Note, a minor discrepancy is introduced into the comparison by the method’s time period relative to annual emissions.
The rising phase magnitude of the annual CO2 cycle vs MME, and the temperature dependence of the CO2 trend can’t be ignored anymore, nor can the effect of Henry’s Law be underestimated anymore either.
I realize he’s talking about what Scripps’ graph and what he calls “homeopathic climatology” do, but *unqualified* discussion of “consequent warming,” natural CO2 removals not “affecting warming,” removed CO2 “no longer (having a) warming effect,” and “memory” of removed CO2 still having “just as much warming effect as it had before removal” sure sound like he’s giving credence to the notion that CO2 has a “warming effect” without the all important “all other things held equal” caveat.
Which renders the whole discussion meaningless.
Nick loves him some hockey sticks
Ecept that these hockey sticks are really measured, Mann’s HS was faked…
Are they ?
Historical CO2 measurements… Some where quite accurate as method, but the problem was where was measured: in the middle of towns, forests, etc. Completely unsuitable to know the “background” CO2 level in 95% of the atmosphere.
Is as accurate as measuring temperatures midst of Paris, near A/C units, etc…
Have made a comment on the monumental work of the late Ernst Beck, who made a compilation of over 300,000 historical measurements, leading to a “peak” of CO2 around 1941, which doesn’t exist in any other measurements (ice cores) or proxy and is physically impossible…
https://scienceofclimatechange.org/wp-content/uploads/Engelbeen-2023-Beck-Discussion.pdf
“Historical CO2 measurements… Some where quite accurate as method, but the problem was where was measured: in the middle of towns, forests, etc. Completely unsuitable to know the “background” CO2 level in 95% of the atmosphere.
Is as accurate as measuring temperatures midst of Paris, near A/C units, etc…”
This sounds like you are describing precision. The relationship of the values to their group size, not to the target you are trying to hit. Measuring the temperature in Paris next to an air-conditioner can be considered accurate if you are trying to find the temperature next to an air conditioner in Paris.
The arithmetic seems very simple to me and that is whatever humans generated by all activities must have added to the total increase by the amount generated, all sinks notwithstanding. The real debate is about the effect on atmospheric temperatures by CO2 and how much does it matter. After 30 years of debate and creative mathematics we still have not improved our estimate for this and that is an abject failure of the so called “Climate Science”.
CO2 is not a well mixed gas the Calc of mass from 1 measurement is useless
Each year, some 25% of all CO2 in the atmosphere is moving from/to oceans and from/to vegetation and back. The yearly averaged levels of CO2 in the atmosphere differ only some 15 ppmv on 425 ppmv between near the North Pole to the South Pole in 95% of the atmospheric mass. I call that well mixed…
NASA disagrees. They show rivers and eddies and it is not so well mixed as some assume. It is 10 ppm higher in urban areas and 10 ppm lower in rural areas. I do not have the altitude data at my fingertips, but it is different at ground level than at various altitudes above the same geo coords.
Ah. The hokey stick once again.
A 6000 year continuous coal seam fire would be indistinguishable from ‘fossil fuel’ burning from human activity, and not insignificant:
“Video unavailable” for me, but I assume it’s Pennsylvania.
Australia, try searching youtube by title:
“This Mountain Has Been Burning For Over 6000 Years”
channel:
OzGeology
I clicked on “Watch on YouTube” and it worked fine.
Makes you wonder how many of these coal seam fires or similar are burning around the globe. Have we accounted for any of these in global emissions?
Not that it matters….more or less CO2, as long as above 150 ppm, is good.
In Wyoming I’ve driven by miles and miles of clinker that resulted from natural coal fires that finally burned themselves out.
Outside of Boulder, they finally got tired of the over 100 year old mine fire that had been burning and which was partly implicated in the Marshall fire. In this particular case, they excavated ground until reaching the source and basically dug it out.
Just west of Carbondale are a few ignited coal seams. Some can’t be extinguished, and some that are, are re-ignited by lightening.
They’re re-ignited by making them lighter?
I think there are observations of some centuries old burning coal seams in India too
http://wattsupwiththat.com/2015/05/05/anthropogenic-global-warming-and-its-causes/
How does the amount of coal burned by this fire, compare to the amount of coal being burned by a single coal fired power plant?
Let’s think.. in the “land of fire and flooding rains” (see Dorothea Mackellar) there hasn’t been a sufficient rain event or events in 6000 years to put it out, versus a coal fired power plant the might have been in existence for 100 years (generous estimate). I’m going to guess that it must be more than every power plant ever built on the planet put together.
Depends i these fires are more or less constant burning or increasing in intensity. If they are more or less constant, they didn’t contribute to the recent rise of CO2, only may have increased the average CO2 level somewhat in the past (as good as is the case for volcanic emissions)…
My point is that it is indistinguishable from any ‘fossil fuels’ we have burned, rendering the question of how much we have ‘added’ to the carbon cycle (which is only around 4% of the total anyway) moot.
My point is that a continuous influx of any source will give a new equilibrium, somewhat different from the old equilibrium. That is the case for the coal seems burning since millennia.
Adding a new source that is continuously increasing does continuously change the equilibrium, depending of the speed of addition and removal.
As the removal (as mass) is only half the human contribution (as mass), the total CO2 mass in the atmosphere remains increasing, largely caused by the small human contribution.
The amounts of natural CO2 cycling in and out are not important, only the difference between ins and outs are important and that is more sink than source, at least since 1958, with a few (El Niño) borderline exceptions.
Yet that implies that the sinks had the capacity to remove any excess, so the average stayed the same. To get a hockey stick rise means that the sinks are basically saturated and can no longer remove excess CO2. That causes the average to rise significantly.
Hmmmm? Is this settled science?
Jim,
You need to take into account the time frames that are involved.
The huge 80 ppmv (and more) increase over ice ages needed 5,000 years or a “speed” of about 0.02 ppmv/year.
The current emissions from fossil fuels are around 5 ppmv/year, of which half is fast absorbed in vegetation and ocean surface. The latter indeed is saturated at about 10% of the change in the atmosphere. That is the Revelle/buffer factor. The remainder is going into the deep oceans, but these have a restricted exchange with the atmosphere with the THC. That takes time to get rid of the extra CO2 with an overall time constant of ~50 years, as was calculated by Dietze (1997), Lindzen, Spencer and myself over the past decades.
The 4 years residence time only shows how much CO2 is exchanged, not how much is removed…
That roughly 50 year “adjustment time” was even admitted in the IPCC’s Second Assessment Report (1995). It reported that, “Within 30 years about 40-60% of the CO2 currently released to the atmosphere is removed.” [SAR WGI TS B.1 p.15]
That implies a half-life of 23 to 41 years, which implies an adjustment time (effective atmospheric lifetime) of halflife/ln(2) = 33 to 59 years (i.e., about fifty years). That means the rate of annual natural CO2 removals accelerates by 1/59 to 1/33 of the increase in CO2 level, which is 1.7% to 3.0% per year.
That is all correct, but that admission has been scrubbed from recent IPCC Assessment Reports.
As you say, what the IPCC calls the “turnover time,” i.e., the short residence time (est. 3-5 year), is irrelevant for carbon cycle modeling. If a blade of grass absorbs the carbon from CO2 in the spring, and then rots and releases it in the fall, or even if a falling raindrop absorbs a molecule of CO2, and then evaporates releasing the same CO2 molecule an hour later, that resets the clock on the molecules turnover time, but such exchanges have no lasting effect on atmospheric CO2 levels.
I had long thought the anthropogenic carbon isotope argument was rock solid. It had a simple and obvious core logic:
Photosynthesis favors stable but lighter 12C over stable but heavier 13C. So photosynthetic preferential fossil fuel sequestration of 12C, enriching atmospheric 13C over hundreds of millions of years, would start to reverse atmospheric isotope ratios as sequestered fossil fuels are burned.
One of the only scientists disputing this until now was Katsoyyanis, who provided inconclusive short term (at most a few decades) and somewhat inconsistent data from various spots around the world saying the expected isotope ratio reversal wasn’t happening.
Now we know that natural processes involving rivers can release as much 12C as fossil fuels consumption. Means Katsoyyanis was still wrong, but not for the reasons I originally thought.
We know that CO2 ppm is rising—Mauna Loa’s Keeling Curve. We know annual variation relates mostly to NH land biosphere seasonality. But now we again don’t know how much of that annual rise is from anthropogenic fossil fuels, and how much is from other stuff like agriculture affecting river 12C release (anthropogenic, but not fossil fuel related).
Climate alarmists all want to eliminate fossil fuels, but most do not go as far as also eliminating agriculture (except for a radical few like Paul Erlich and Al Gore).
Rud, does Mauna Loa have the capability to check the isotopes in the CO2?
Yes, but not Δ¹⁴C
See: https://gml.noaa.gov/dv/iadv/
Choose a station, push on “Carbon cycle gases”, then on “Time series” and then on the parameter you want to see. The 13C/12C ratio of both CO2 and CH4 can be plotted (or the data series obtained) for near all stations available.
Maybe even seasonal river flows contribute to the annual CO2 variation.
I’ve read that a lot of fertilizers are made from natural gas.
Presumably, whether through erosion from the soil, or the bio-degrading of plant material, the carbon from the fertilizer within a year or two, becomes CO2 in the atmosphere.
Photosynthesis is not the only mechanism for isotopic fractionation.
Rud,
The problem for this kind of findings is not the extra isotopic flow itself, it is the question if that flow is more or less constant or increased/decreased over time.
What we see in the atmosphere is an enormous drop in 13C/12C ratio, in exact ratio to the human input since about 1850, leaving only 1/3 of the human “fingerprint”, if all fossil CO2 still remained in the atmosphere.
That is only possible if nature replaced 2/3 of fossil CO2 molecules by CO2 molecules from other reservoirs, and in this case mainly from the deep oceans (which BTW renders the IPCC’s Bern model back to the dust bin).
A more or less constant low-13C and zero-14C flow doesn’t change that one bit, as the isotopic base was already established centuries ago and seemingly very constant at -6.5 +/- 0.4 ‰, dropping to below -8 ‰ nowadays, thanks to fossil fuel emissions:
Where TD = Taylor Dome ice core, LD = Law Dome DSS ice core and PB = Point Barrow direct atmospheric measurements.
This is the problem of isotope dating. Knowing how fast the isotopes are changing is only half the puzzle. The other half is a guess: how much should there be?
If all fossil emissions remained in the atmosphere, the drop in 13C/12C ratio would have been 3 times stronger. Thus not only half of human emissions as mass are removed out of the atmosphere, about 2/3 of all original fossil CO2 was replaced by CO2 from other reservoirs.
The new finding doesn’t change that at all.
Dodges the issue. I accept that the drop13C/12C ratio changes in a knowable, predictable way. The issue dodged is: what was the ratio 1000 years ago, and how do you know?
For the atmosphere, measure in ice core bubbles.
Which you *ASSUME* to be something they are not; a closed system.
Has there been a data base established for all the different coal mins and the extracted coal?
Ditto for natural gas.
Ditto for oil.
Sparta N4, AI LLMs are pretty good at regurgitating statistics, so I asked ChatGPT:
How does the 12C:13C ratio of CO2 in the air compare to the 12C:13C ratio in various fossil fuels?
This was its answer:
The ratio of carbon isotopes in atmospheric CO₂, specifically the ratio of the lighter isotope carbon-12 (^12C) to the heavier carbon-13 (^13C), provides strong evidence for fossil fuel combustion as a source of rising atmospheric CO₂.
Key Concepts
^12C is preferentially taken up by plants during photosynthesis, leading to organic material (and hence fossil fuels derived from ancient biomass) being depleted in ^13C.Fossil fuels (coal, oil, natural gas) are therefore ^13C-depleted compared to atmospheric CO₂.This is reflected in the δ¹³C value, which expresses the deviation of the ^13C/^12C ratio in a sample relative to a standard (Vienna Pee Dee Belemnite, VPDB), in parts per thousand (‰).
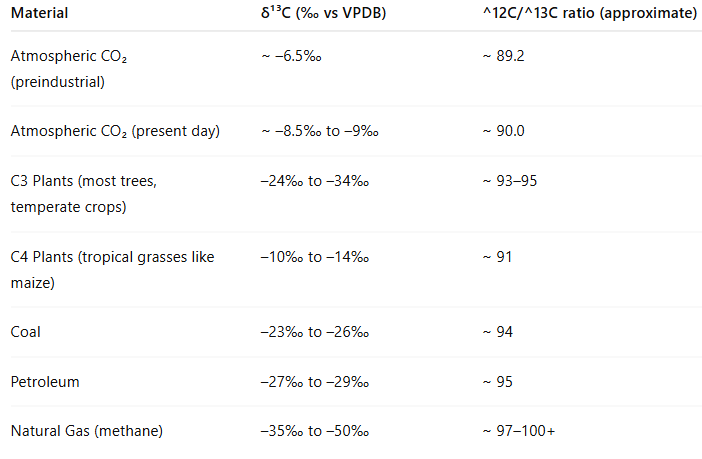
Typical δ¹³C Values
Atmospheric CO₂ (preindustrial) ~ –6.5‰ ~ 89.2
Atmospheric CO₂ (present day) ~ –8.5‰ to –9‰ ~ 90.0
C3 Plants (most trees, temperate crops) –24‰ to –34‰ ~ 93–95
C4 Plants (tropical grasses like maize) –10‰ to –14‰ ~ 91
Coal –23‰ to –26‰ ~ 94
Petroleum –27‰ to –29‰ ~ 95
Natural Gas (methane) –35‰ to –50‰ ~ 97–100+
Fossil fuel-derived CO₂ has a higher ^12C/^13C ratio (more ^12C-rich) than atmospheric CO₂.
Implication
As fossil fuel CO₂ is released into the atmosphere, the ^13C/^12C ratio in atmospheric CO₂ declines over time—a trend known as the Suess effect. This isotopic dilution is measurable and consistent with fossil fuel emissions being the dominant source of increased atmospheric CO₂.
Sources
Francey, R. J., et al. (1999). A history of δ13C in atmospheric CO2 from the Cape Grim Air Archive and Antarctic firn air. Journal of Geophysical Research: Atmospheres, 104(D19), 23631–23645. https://doi.org/10.1029/1999JD900242IPCC AR6 WGI (2021), Chapter 5: Carbon and Other Biogeochemical Cycles. https://www.ipcc.ch/report/ar6/wg1/Keeling, R. F., & Graven, H. D. (2022). Tracing the carbon from fossil fuel emissions into the atmosphere with carbon isotopes. Science, 376(6590), 1045–1047. https://doi.org/10.1126/science.abm5720
That does not answer the question.
Is the isotope ratio identical regardless of which mine the coal is dug out of?
It the isotope ratio identical for every barrel of oil regardless of which part of the world it is drilled? Same for gas.
It is illogical to assume that every lump of coal is identical to every other lump of coal.
When the facts change, a wise person changes his position.
How about if we just say it’s 50/50, and call it a day? This does help explain a few things about why, for example, no matter what happens, the rise remains steady and inexorable. The beauty of the whole argument is that WRT the global warming argument, all it really does is remove yet one more argument the alarmists count on to make their case, but in no way damages what Climate Realists are saying if it turns out to not be case. Win-win.
I thought we knew all along that the earth generated C14 ….. we didn’t know how much though and the warmistas controlled the “insignificant” narrative with the media. I expect they’ll try the same thing with the river enlightenment except who believes the MSM anymore 🙂
Time will come when Charles Rotter and others come to understand that solar activity is driven by gravitational forces on the Sun.
In fact, I am not certain that treating the Sun as a point mass in determining its motion yields an accurate orbital path. The Sun’s complex orbital path as JPL determines from the gravitational forcing on a point mass can also produce a near circular path with very low eccentricity.
And of course is is becoming increasingly obvious that CO2 does next to nothing as a cause of any radiation imbalance on Earth and the notion of “Greenhouse Gasses” is unscientific claptrap.
“…unscientific claptrap.” – It had to happen sooner or later – Richard Greene is being channeled into the comments here in absentia. 🙂
David D, Richard Greene might have said that TO RickWill, but Richard certainly would not support the barycentrism that Rick slipped in. Richard is strong on scientific accuracy, but weak on patience.
“Richard [Greene] is strong on scientific accuracy, but weak on patience.”
I was only referring to RG’s frequent use of the word “claptrap” in addressing the points of those with whom he disagreed. About scientific accuracy, RG has yet to understand, as far as I know, that the concept of energy conversion in the general circulation counters the expectation that the static radiative effect of incremental CO2 must also produce a sensible heat gain result. Don’t get me wrong – I agreed with RG’s conclusions on policy, but not with his reasoning about the scientific claims. In fact, the CO2 Coalition – itself a terrific organization, and of which you are a named member – could and should do better on this same point, in my view. Glad to discuss further. Please consider taking the time to read the full text description at this video, which perhaps you have seen already but (like RG) have not yet fully appreciated what it must mean. Best wishes to you.
https://youtu.be/hDurP-4gVrY
Funny, FE hasn’t commented on this study yet. Curious what he will make of it.
Was not aware of Charles “confession”, but was warned that this was going on… Just wait for the backlash…
“It ain’t what you don’t know that gets you into trouble. It’s what you know for sure that just ain’t so” is a well-known saying attributed to Mark Twain, one good scientists remember before ever declaring the science is settled.
Admin -> Not article related: Is it just my browser, or did you normally great article graphic thumbnails quit displaying? Now just showing grey boxes. Last one that still shows a graphics was “Physics Demonstrates That Increasing Greenhouse Gases Cannot Cause Dangerous Warming, Extreme Weather or Any Harm” yesterday.
Your browser. Reboot your computer
The new study illustrates that carbon isotope ratios may not be the unassailable evidence they thought it was; that humans are the primary cause of the atmospheric CO2 increase of the last hundred years. It still looks like human fossil fuel use is the primary contributor, though.
The EPICA ice core CO2 plot shows it fluctuating between about 180 and 280 ppm over the last 800,000 years. Since the Industrial Revolution it has risen about 50% to 420 ppm. From the ice core data, we see no natural equivalent over the last several cycles of glaciation and warming.
Maybe the ice core data doesn’t have the temporal resolution to show brief, higher fluctuations, but it seems like pretty good evidence that the current atmospheric CO2 increase is largely due to human fossil fuel use overwhelming the natural carbon cycle. However, that doesn’t mean that the modest warming (~1+ ⁰C globally since the late 1800’s) is entirely due to CO2 or that the growing CO2 concentration presages an imminent climate crisis. So far the evidence suggests modest, beneficial warming and increased agricultural yields, not boiling oceans and mass extreme weather events.
The fact that there are other sources with low 13C and no 14C doesn’t change the influence of the human cause of the enormous drop of the 13C/12C ratio because of fossil fuel emissions. It would only be different, if that natural flow should be mimicking the human contribution in exact the same way. Even then, about 2/3 of the human “fingerprint” is replaced by CO2 from other reservoirs. If the natural supply of low-13C increased over time, the replacement by “normal” 13C natural CO2 molecules only would be larger…
Another thing to note, is that as the world warms naturally, new areas of CO2 release will open up.
Peat mosses, methane clathrates, old buried timber attacked by termites etc etc…
How old is this “carbon” and what is its isotopic signature.. who knows. !!
Natural releases from vegetation only can release what was captured first. Most of these flows are already seasonal, some are after years to decades, but in general, vegetation nowadays is capturing more CO2 than it releases, including the emissions from peat and ancient woods (forest fires).
The earth is greening:
https://www.nasa.gov/feature/goddard/2016/carbon-dioxide-fertilization-greening-earth
True! Even some of the folks at NASA admit it. This is NASA’s video (not from GISS, of course):
Well, I agree that some numbers probably have to change slightly, but I never saw the big deal of the isotope tracking to start with.
We know quite well how much anthropogenic CO2 is produced.. about as much as oil, coal and gas is mined from the Earth´s crust.. plus a little bit more from concrete production.
The isotope tracking might help to see where it diffuses s to and how fast that is happening, but -not really surprisingly- these findings match with what we already knew from following the C14 pulse from the nuclear bomb tests in 60ties.
So, since there was not much new to learn from this modern isotope tracking to start with, these new findings will not impact our understanding too much.
Dr Feynman would be proud of you, Charles.
Harold The Organic Chemist Says:
RE: Update On CO2 In The Atmosphere
At the Mauna Loa Obs. in Hawaii, the concentration of CO2 in dry air is 430 ppmv.
One cubic meter of this air has mass of 1.29 kg and contains a mere 0.845 g of CO2
at STP. In 1900 the concentration of CO2 in dry air was ca. 295 ppmv. One cubic meter of this air contained 0.595 g of CO2.
After over a century of an enormous increase in the consumption of fossil fuels and in the populations of humans and domestic animals, there has been only modest increase in the concentration of CO2 in air (i.e., 0.25 g CO2/cu. m). Where has all the CO2 from these sources gone as well as from all natural sources and in particular from volcanoes and from rivers?
The main sinks for CO2 are:
Mother Nature has developed many methods for removal of CO2 from the air.
There is very little CO2 in the air and we do not have to worry about it.
We do have to worry if the atmospheric CO2 level starts dropping.
Food supplies could become an issue.
I’m not worried. We will keep pumping megatons of CO2 into the air and nothing will happen because IR absorption bands of CO2 became saturated at 300 ppmv. That is, increasing concentration of CO2 above this level will not result in an increase surface air temperature.
Check out this chart for Brisbane from the late John Daly’s website: “Still Waiting For Greenhouse”. Note how flat the plots of temperatures are even though there was an increase of CO2. In 1949 the concentration of CO2 was 310 ppmv and by 2001 it had increased to 371 ppmv.
BTW: Do you how to obtain temperature data from BoM? I would like to know if there has been any significant increase in temperature at this city. However, I have read that the BoM has been “adjusting” and “homogenizing” all the temperature data so that all the weather stations show a recent warming thus supporting the government crazy climate plans.
NB: If you click on the chart, it will become expand and become clear. Click on the “X” to return to return to text.
4 Photosynthetic plankton that when they die, drift down to the abyssal plains
When it warms, the precipitation of limey muds increase in the Carribean.
I was about get upset with this post until I got to sink #4. Well done sir.
Dr Feynman would be proud of you, Charles. For some reason I cannot give you a 5 star rating.
I tried to find a piece of information in the article or the comments, but I could not identify it. It is important to understand that this riverine CO2 annual addition of 1.2 GtC should be compared to yearly fossil fuel emissions, which are about 10 GtC per year. It means about 10-12 % more CO2. which has the same isotopic ratio as fossil fuels. Not a big difference. I do not find information to which place this new CO2 source is going: into he atmosphere or the ocean?
As does any rational person when they become aware of new facts. Kudos to you.
Mind you, what is this CO2 supposed to do? It, along with the rest of the atmosphere, makes human life on Earth possible, by reducing daytime maxima, and reducing the levels to which temperatures can fall at night.
John Tyndall, amongst others, figured this out over one hundred and fifty years ago.
7% CO2 is toxic, 1% (10,000 parts per million) “may result in reduced cognitive performance is some individuals”. However, US nuclear submarines allow 5000 ppm CO2 for 90 days continuously, and up to 40000 ppm for 24 hours. Hopefully, it hasn’t reduced the crews to a state of shambling incoherence.
Previous papers purporting to show cognitive decline due to 2500 ppm CO2 exposure were not able to be replicated. It appears that many previous studies claiming to show negative effects of moderate CO2 levels were examples of wishful thinking or political correctness.
Humans breathe out 4 – 5% CO2. Maybe its toxic cognitive effects have made us all believe in fairytales – the GHE being one!
That should be obvious from the fact that a major CO2 flux from the oceans into the atmosphere is up-welling water from the abyssal plains. It is generally thought that the time it takes to transit from the Poles to the Equator in on the order of 1,000-years. That is, the up-welling waters rich in CO2 are at least several hundred years old, and possibly over 1,000. They are providing atmospheric CO2 that was first dissolved in the water a millennium ago, with contributions from the bodies and shells of marine calcifiers that are younger. I doubt that anybody has looked at how the ages of the organic carbon (which looks like fossil fuels, isotopically) varies along the length of the deep currents.
Clyde, the study was about CO2 in fresh water, which is a surprising find of an until now unknown source of ancient CO2.
The upwelling from the deep oceans is the main cycle that “dilutes” the human 13C and 14C fingerprints, but is completely ignored in the IPCC’s Bern model. That is the reason for the long tails in the CO2 level of the atmosphere for centuries as the IPCC insists on from the Bern model (and other similar models) implies, but not seen in real life…