By Vijay Jayaraj
A decade ago, I was able to get away from a terrible flood that killed more than 500 people in the southern India city of Chennai (formerly known as Madras). The bus taking me from the city barely managed to avoid rising water slowly but inexorably engulfing the roads.
My escape was only possible because I had been tracking the movement of a cyclone that had brought the deluge. That flood was not unusual. Once known for its light cotton fabric designs known by the Madras name and most popular in the 1960s, Chennai since has gained notoriety for frequent flooding.
In other articles, I have analyzed how recent floods in Chennai are not attributable to anthropogenic global warming, as some suggest, but rather to poor urban planning that has resulted in inadequate rainwater drainage and construction in areas that had naturally retained water.
Chennai is notorious for something else: its summer heat. Lately, the mainstream media has portrayed the extreme temperatures of the city as a sign of a climate crisis. But readings from a temperature station located near my former Chennai residence debunks this claim.
Dating back to 1855, records from Chennai’s Meenambakkam weather station (MWS) challenge the apocalyptic narrative of the purported runaway global warming dominating headlines. The data reveal a more nuanced story that tells of a modest rise in average annual temperatures over the last 170 years – a period that includes a record high set way back in the 19th century – and a modern warming trend that owes more to asphalt and jet engines than to carbon dioxide.
Since the mid-19th century, the annual average temperature measured at MWS has risen by less than half a degree Celsius – at a tortoise-like pace of 0.294 degrees Celsius per century. This is a fraction of the HadCRUT global model’s 0.65 degrees per century, which is often cited as evidence of a planet in peril. More striking still, the hottest day in this long record didn’t occur in the fossil-fuel-drenched 21st or 20th centuries but rather in May 1892.
This fact alone should give pause to those who paint Chennai (or for that matter most metropolitan cities) as buckling under unprecedented heat driven by global warming.
It is also worth noting the influence of the Urban Heat Island effect (UHI), which is a phenomenon common to all of India’s densely populated cities. Cities trap heat in their concrete jungles, artificially raising local temperatures, as do airports’ vast expanses of pavement and jet exhaust.
The city of Chennai is no exception. The MWS is nestled just 300 meters from the runway of Chennai International Airport.
Before the 1950s, the airport was a sleepy outpost, handling a handful of flights a day. By the 1980s, it had begun its ascent as a hub connecting Europe, Asia, and points beyond. Traffic surged through the 2000s. Today, it’s India’s third-busiest airport, radiating heat mere steps from the Chennai weather station’s sensors.
The station’s readings since the 1980s align suspiciously with the airport’s growth. Before the jet age, temperature increases were quite slow but accelerated after the 1980s. Coincidence? Maybe or maybe not. However, it seems likely that much of the warming denoted as a product of “climate change” in Chennai could be reflecting the transformation of a modest airstrip to an international gateway.
Further, the winter warming at MWS has been nearly negligible, registering just 0.09° Celsius per century. If global warming were the dominant force, we’d expect a more uniform rise across seasons. Instead, the data point to a localized, seasonal skew.
The fact that Chennai’s highest recorded temperature occurred in 1892, long before the era of modern industrialization and urbanization, is a powerful reminder that extreme weather events are not a recent phenomenon. This record, set during the British colonial period, predates the widespread use of fossil fuels and the subsequent rise in atmospheric carbon dioxide levels.
This is a reminder that climate discourse should embrace an evidence-based approach that acknowledges the substantial role of local environmental factors that contribute to temperature trends.
This commentary was first published at BizPac Review on March 28, 2025.
Vijay Jayaraj is a Science and Research Associate at the CO2 Coalition, Arlington, Virginia. He holds an M.S. in environmental sciences from the University of East Anglia and a postgraduate degree in energy management from Robert Gordon University, both in the U.K., and a bachelor’s in engineering from Anna University, India.
Great common sense reporting. I started college in 1967 in a madras shirt, now I know where the name came from.
“The MWS is nestled just 300 meters from the runway of Chennai International Airport.”
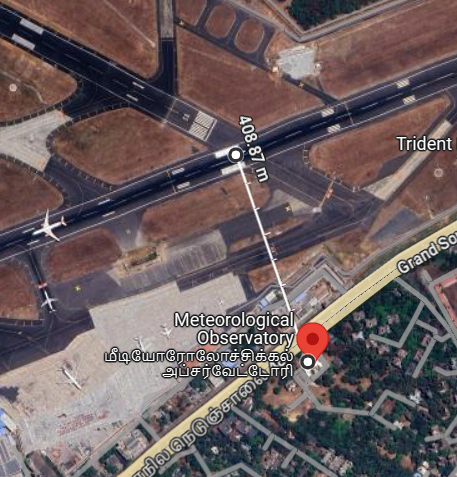
Well, 400 m, which is no small distance:
Yeah taxi ways don’t count. They use electric motors for taxiing. 😉
Your point eludes me. Hopefully, you are not trying to imply that adding CO2 to air makes it hotter, are you? That would be no small feat, possibly qualifying you for sainthood, if such a miracle could be properly documented.
I admire your ability to totally reject reality, but I have no desire to share your fantasy.
I personally wonder what shit Nick inhales in the morning, must be really really good stuff… makes you fly so high you’ll never need to purchase a ticket or deal with airport security anymore.
How about from that adjacent taxiway at the “wait line” for air traffic to queue prior to take off? I’d wager that point is only 204 meters away. (Considering the half way point of your 408m line passes right over it)
Or how far from the turning point at the end of the taxiway (where taxiway and runway meet) where jets blast their engines to make the turn prior to waiting at the end of the runway for clearance to take off? That warm up blast is directly at the station.
There’s 2 runways and they cross at your 408m mark.
Their engines are quite powerful and blast heat a fair distance
There is an apron with parked planes, a rail track, and 6 (?) lanes of traffic.
Rural? I think not.
Thanks for showing us yet another surface site which is class 5 at best !! 🙂
ie totally unfit for anything to do with climate.
Six lane highway, massively expanded airport, huge buildings, trees, other roads all around.
And of course the new terminal… 2022?… with modern air conditioning. No heating effect ?
And the fact that the whole of the light grey area on your image is parking for jet cargo aircraft.
Nick doesn’t show the weather station mounted within a few metres of the building, which is only 20m from a very busy three-lane highway.
Nice try, Nick
Zoom in a little closer..
Surely the measurement equipment can’t be on top of the building…
That would make it even more FARCICAL.
It is on top of the building
And don’t call me Shirley.
So you think that increasing air traffic along with increasing temperatures is just coincidence but increading CO2 along with increasing temperatures is proof of man made global warming?
That’s the logic of the whole “climate crisis” narrative. “I’ve got a pet hypothesis about it so it’s a fact.”
Wow! That foot was well planted in that mouth Nick!
Excellent way to pick nits. Actually show that it’s worse than stated while trying to show that it’s not as bad 🤣. Do keep up the good work!
Points added for increased accuracy.
Points deducted for an opinion of distance being insignificant.
Looks like the thermometer is located adjacent to a major road. Maybe 10 meters, as a guess.
but “teleconnections” from thousands of miles away are real. Riiight.
Let’s call it what it is, across the street!
What was the high temperature?
“The station’s readings since the 1980s align suspiciously with the airport’s growth. Before the jet age, temperature increases were quite slow but accelerated after the 1980s. Coincidence? Maybe or maybe not. However, it seems likely that much of the warming denoted as a product of “climate change” in Chennai could be reflecting the transformation of a modest airstrip to an international gateway.
Further, the winter warming at MWS has been nearly negligible, registering just 0.09° Celsius per century. ”
Do planes only lane in Chennai in summer? After all if the warming is due to the airport’s growth you would expect to see the same warming in summer and in winter. Unless of course no planes land in Chennai during winter which seems unlikely.
Doesn’t matter.
The site is totally unfit for “climate” work anyway.
Class 5 at best… would be even higher if they went higher. !
And yes, urban population growth around the world took a steep climb around that period.
It would be interesting to overlay a CO2 graph on that population graph.
The site is unusable for climate studies but it is surprising that with all the asphalt and concrete around it, it’s measured temperature increase is so little over such a wide time frame.
As a proponent of the analysis of alternatives, is it not possible that winters would be colder there without the airport?
In winter the solar vector comes in at a steeper angle and less energy is available for storage and subsequent release at night.
“The fact that Chennai’s highest recorded temperature occurred in 1892″
Actually it occurrd in. …..
“The highest temperature ever recorded in Chennai was 45°C (113°F) on May 31, 2003.
Here’s a more detailed breakdown:
This is another of the “look no Global warming” articles by dint of picking cities that lie on a coast ( Mr Sherrington – Oz)…..
https://wattsupwiththat.com/2025/02/06/australian-heatwave-stories-slammed-some-more-part-2/
And here again the moderation of temps at time of max insolation happens due to the arrival of a sea breeze.
https://citizenmatters.in/explainer-on-chennai-summers-sea-breeze-urban-heat-island/
“In the city, heat waves may not be as intense as in the interior parts of Tamil Nadu. Chennai being a coastal city with tropical climate, it depends upon the sea breeze for respite from brutal summers in the afternoons and evenings,” Balachandran adds. “
Also the met station appears to
lie to the east of the runway, and so no supposed heat from the runway would affect it after arrival of the sea breeze.
Another thing – even if the metropolis between it and the coast is causing increased UHI,
then a record temp back in 1892 would disprove that.
It seems that for the most part the controlling conditions in the achievement of record highs here is the time of arrival of the SB and
the warming of the source air from over the Bay of Bengal.
The surface site in Chennai is totally unfit for comparing temperatures over time… Period. !
And if sites away from the coast are used, the 1930s is warmer than around 2010, even with urban expansion.
Oh, and show us where all the measurements for SST’s of the Bay of Bengal came from in 1920-1980.
There are no thermometers there that have any sort of consistency.
And if it is the bay that really is warming, there cannot be any sort of human CO2 causation…
This one shows India was just as warm in the past as it is today:
“| Trend of average annual temperature in the Indian subcontinent during 19002015 (data source: https://data.gov.in/).”
The Indian subcontinent is experiencing a general warming trend, with maximum temperatures increasing more rapidly than minimum temperatures, and the all-India mean, maximum and minimum temperatures have increased by 0.51, 0.71 and 0.27 °C per 100 years, respectively, from 1901 to 2007.
Here’s a more detailed breakdown of the trends:
https://www.nature.com/articles/s41612-023-00494-0
a–h Annual averaged maximum (Tmax), temperature (Tmin) and mean (Tmean) temperature from the IMD data in the temperature homogenous regions and entire India from 1980 to 2020. The numbers at top of each panel represent the temperature trends (°C per decade) and the star indicates that values are statistically significant at the 95% CI. Here, NW is Northwest, WH is Western Himalaya, NC is North Central, NE is Northeast, EC is East Coast, WC is West Coast and IP is Interior Peninsula.
Anthony,
Let me take a wild guess –
Your comment was generated by the use of Actual Idiocy.
Am I right?
What if your graph were going in the opposite direction. Would that be a good thing?
A bit of a mish mash of “you can’t prove there’s no global warming because it isn’t actually warming, but the sea is, so there!” argument, really.
I do love the “Chennai is located on the thermal equator and on the coast, which leads to a relatively mild climate with no extreme seasonal temperature variations.” That sounds to me very much like someone who has never spent time, let alone a summer, in Chennai. Try it, then get back to me,
The Indian environment journalist who wrote that was speaking as a native of the subcontinent and I have no doubt he has “spent time in Chennai”. It is as I said – the climate is moderated by air from the BoB, not stupid hot in summer as is the interior (due the SBs) and not to cool in winter.
Bit of a pathetic attempt at a comeback ziggyzaggy, and of course via a swerve of the goalpost.
Problem in measuring temperature in India is likely to be very similar to that of the UK where the utter incompetence of the Met Office and its local directors has left it with a very large proportion of its surface sites being totally compromised by increasing urban density and infilling. Something like 80-90% of the surface sites in the UK are totally unfit for “climate” purposes
The situation in India is likely to be compromised even further by their large population increase and their extravagant use of air-conditioning. The Chennai site is likely to one of the least bad, one can only imagine the condition of other surface sites in India !!
Take any surface measurement data from India with a large spoonful of salt.
Cities trap heat in their concrete jungles
We need to not use the Climate Alarmist lexicon.
Cities absorb and store thermal energy for later release in their concrete jungles.
Heat is defined as the flow of thermal (aka kinetic) energy across a temperature gradient, from hot to cold.
If it is trapped, it is not flowing. If it is not flowing, it is not heat.
Just a nit.
Good point. Excellent point, in fact. Totally rejected by GHE cultists who believe that “heat” can be “trapped” or “accumulated”, of course.
The best description I’ve heard is “Trying to ‘trap heat’ with CO2 is like trying to trap mice with a chain-link fence.”
As usual, Vijay Jayaraj sets the record straight to counter the weekly, or maybe daily, climate crisis stories guaranteed to be featured in the mainstream media.