The U.K. Met Office claims to have a continuous record of temperatures at Stornoway Airport going back to 1873. This is truly remarkable since manned powered flight was not achieved until 1903 and the actual airport was built in 1937. Yet another error in the Met Office’s temperature recording database. Yet another sign that in its mission to scare the population into accepting the looming Net Zero catastrophe, the Met Office is failing in its day job to accurately record temperatures across the U.K. Over the last year there have been revelations about data invention at 103 non-existent weather stations while almost the entire 380-strong network is heavily skewed by unnatural heat corruptions. All of this in a year when it added a politicised measure to its “Indicators of Global Warming” based on just 10 years of actual data and 10 years of computer model speculations loaded with improbable claims of future temperature rises.

Again we are obliged to the work of super sleuth Ray Sanders, who has been conducting a forensic examination of the temperature claims made by the state-funded Met Office. Of course there was no airport on the site in 1873. The coordinates provided apply to the current airport location, although there is no indication in the detailed records when these might have changed. The diligent Sanders discovered that the original site was located 4.25 kms away in the grounds of Lews Castle. Further research found that the move to the airport site occurred in 1968. “Is all of this just ineptitude on the part of the Met Office or is there some motivation behind this covert dataset bonding?” asks Sanders. “Did nobody ever stop to think about the dates when attributing 19th century readings to a site with the name ‘Airport’ attached?” he further inquired.
Sanders’s work is published on the Tallbloke blog and comments are invited. Derek T noted: “You are uncovering so much of this sort of thing that it cannot be that they are unaware of any of it. The explanation must be that they are intentionally ignoring it. Eventually they must be held to account for it.”
Derek might be in for a bit of a wait. Any mainstream discussion of the Met Office’s sloppy methods will open a Pandora’s Box and will be extremely unhelpful in promoting the political Net Zero fantasy. Populations in the U.K. and around the world are being groomed to accept that temperatures are rising at a faster rate than can be justified by the poor data presented. Recent academic work suggests urban heat corruption, which appears to be a worldwide problem affecting many state-run weather services, is adding around 30% extra warming to recent temperature measurements.
Earlier this year, the Daily Sceptic disclosed via a Freedom of Information request that almost eight out of 10 U.K. temperature measuring stations were sited in locations that had internationally-recognised ‘uncertainties’ between 2-5°C. But is a scientifically-chastened Met Office trying to make amends for all this unscientific siting at or near airports, car parks, walled gardens, main roads, solar farms and electricity sub stations? It does not appear so. This year we have also learnt that 80% of the 113 measuring stations opened in the last 30 years were deliberately or carelessly sited in World Meteorological Organisation junk Class 4 (uncertainties of 2°C) and super-junk Class 5 (uncertainties 5°C). Shockingly, the situation was just as bad over 10 years, and it beggars belief that in the last five years, eight of the 13 newly-opened stations were at junk sites. And step forward again citizen journalist Sanders who used FOI requests to discover that the Met Office was inventing temperature data from over 100 non-existent stations.
Late last year Professor Richard Betts, the Met Office’s Head of Climate Impact, published a paper that sought to sidestep the inconvenient fact that temperature trends can only be measured over a long period, and breaching the so-called Paris threshold of 1.5°C industrial-age warming would take years to confirm. Science, alas, getting in the way of politics. Betts’s solution was to provide an “instant indicator” that would point to an exact period when the 1.5°C ‘guard-rail’ had been breached. This would “provide clarity” and reduce delays in imposing further climate control measures. This magic indicator uses just 10 years of past data which are added to 10 future years of guesstimates from climate models.
A few problems would seem to present themselves. Recent global temperature datasets, including the Met Office’s HadCRUT5, have been subject to considerable retrospective warming adjustments of late, while computer models have barely an accurate temperature forecast to rub together over the past 40 years. In addition, the models will be loaded with a ‘pathway’ known as RCP4.5, which assumes a temperature rise over the next 80 years of up to 2°C. Given a rise of barely 0.2°C over the last 25 years, this looks a bit of a stretch. The indicator is now in use by the Met Office. Betts hopes that his “instantaneous indicator of current warming” will find favour with the Intergovernmental Panel on Climate Change (IPCC). In future years he suggests the IPCC could state: “It is very likely that the current global warming level exceeded 1.5°C in year X.”
All the while keeping a straight face, a discipline it seems is required for a great deal of the Met Office’s current output.
May I wish all my readers a Happy New Year. I love you all dearly and am encouraged by the support, insights and wisdom you give me in this publication and in wider social media. As can be seen, there are massed forces at work promoting the idea of a climate crisis and the need for a political Net Zero solution. Attentive readers might have gathered that I regard Net Zero as a looming catastrophe for humanity but I am encouraged that much more attention is being paid to what is little more than a luxury middle-class belief. If you are a student of history, you will know that these puritanical groupthink cults pop up at regular intervals. I am also encouraged by the growing interest in the underlying science and the scandalous way the scientific process has been traduced in recent years. We fight and debunk this nonsense with facts. Next year is likely to see reality make substantial gains and it should be fun.
Chris Morrison is the Daily Sceptic’s Environment Editor.
Of Morrison’s many beat ups, this is the silliest. Yes, the station at Stornaway moved 4.2 km, and is now called (correctly) Airport. Logan Airport at Boston has a record has a record going back to 1753. Normal people can cope with name changes.
There’s coping with name changes and there’s coping. I really want to go back to calling weather “weather” and not “climate change”, because that will mean the parasite class has stopped extracting trillions of dollars from the global economy, with concomitant abuse of the citizenry.
Old weather is so much more exciting with a new name:
Heat dome
Polar vortex
Atmospheric River
Bomb cyclone
“Beat-ups”
Indeed Nick, I am expecting one to come along on a regular basis.
Morrison and Homewood together.
As if this mattered a jot.
You won’t see it but to follow will be that nice man and prob his partner Karlo.
I’m having to much fun to follow your tip to exclude them (yet).
I use Chrome and that app doesn’t work on it.
Tried it on Edge and it works with that.
Are you sure you aren’t using acid?
Rent free in your head.. vacant possession.
Hilarious.
Get a life, mini-muppet
You’re the one thread-bombing after every post I make, ranting and ad-homing nice one.
I’m just having fun rubbishing the “science” in your posts.
If all you can do is that, then be my guest.
It shows you up as an angry denying wind-bag, desperate to get the last word no matter what, as though a “win” is in on piece rates.
So I’m not “rent-free” in your head?
Sure looks like it to me.
Not got it as muddled as your is your “science” have you?
Stop whining.
to quote the old Elvis song
“I am always on your mind. !!”
It’s actually the other way round: You were always on my mind…
“I’m just having fun rubbishing the “science” in your posts.”
Only to get slapped down every time. !
Poor child. !
The Met Office seems to have spliced a series of measurements from one (garden) location on to another series from a different (airport) location some 4km away. The it has reported them as if they were one continuous series of measurements from one location.
This is not on.
I notice neither you nor Nick address any of the other points in the head post.
The other points are a rehash of past beat-ups.
Which you have never been able to address.
You love your FAKE data, and all the other shenanigans that BoM, Met, GISS etc get up to the try to create alarmist talking points.
In other words, Nick still can’t refute any of those points, now or in the past.
He just wants to pretend that he doesn’t have to.
Then you have nothing.
LOL.
Well,the UK is running a climate and energy policy based at least in part on analysis by the UK Met Office. And the UK Met Office is basing its analysis of the UK climate on stations with some odd characteristics. I have extracted bullet points from the head post:
There is a real problem here. You and Anthony Banton may not like it, but there really is. The UK is embarking on a hugely expensive program motivated in large part by the desire to alleviate global warming. It consists of moving electricity generation to wind and solar, while at the same time moving home heating to heat pumps and making cars EVs,
Never mind the total impracticality of the program, which is being undertaken without provision for intermittency, and which, even did it work, would only produce a reduction in global emissions of a fraction of a percent, if that. Look at its justification. One element is the absurd claims that the program will reduce energy costs and deliver energy independence. But another main justification is the supposed climate emergency.
This is supported by lots of claims in the media about ‘extreme weather’. These claims are supported by Met Office fake reports of temperature and wind speed readings. So in the perfectly normal hot summer of a couple years back the BBC and press were broadcasting positively hysterical warmings about supposedly unprecedented temperatures. When scrutinized, these claims were based on readings from very unrepresentative stations, and the actual temperatures as experienced by UK residents were similar to the ones they go on vacation to the Med in search of every summer.
In general we can say that the Met Office station base is not fit for the purpose for which it is being used in policy making, and this is what the work summarized in the head post is showing.
The same is true of Met Office reports of supposedly unprecedented rainfalls and wind speeds, which are also cherry picked readings in a context in which nothing out of the ordinary is happening to UK weather.
One can go on. There is the same kind of denial and falsification going on in many areas of UK policy. This is long enough already, so I will leave the parallels to the readers.
The Met Office is a failing organization. Its put political activism ahead of reporting and forecasting the weather, and this has led to falsification of its reporting. As with many other UK organizations in recent years. Stornaway airport is trivial in itself, but as an example of a cultural phenomenon its very important and indicative.
Bottom line: don’t report two different series of observations from two different places as if they were one continuous series from one place. And stop defending this absurd practice.
And I would close with a word of caution. The end destination of this cultural trend and popular discontent with it is not what you think. You may think that worst case its Farage and Reform. Its not. Its much worse than that, its when discontent rises enough to put Reform into power, and its headed by the successor to Farage.
“I have extracted bullet points from the head post:”
And to emphasise the rehash, your first two bullet points are identical, just rephrased. But going on about junk status is Sanders thing. Those are the extremes of some range that someone wrote down. They are not junk. They measure accurately the temperature where they are, which might differ from the temperature taken in some other microenvironment by up to that much (but probably much less). Any serious climate work is done with anomalies, in which the mean (incorporating most of this “error” is subtracted out. That actually covers the first four points. See what I mean about rehash.
As for the fifth, just look behind the bluster. What actual thing is he complaining about? What was it there for? Who was it meant to help, and in what way?
I don’t really understand your view. Are you saying that its fine to use a collection of Class 3 and 4 stations to measure trends in UK weather? Because the temperature may not represent the country, but the averaged variation in measurements, the anomaly, will still measure trends?
And are you also making the stronger claim, common among UK climate agitators, that you can take the one of these stations which shows the hottest day in a given period, note that this reading is the highest since X, and use that observation to claim that climate change is producing unprecedentedly hot temperatures? This is what is usually done with high wind readings, and during the very warm summer of two years back it was done about temperature.
My own view? Nothing much is happening to UK weather. Its very changeable, and it changes from year to year. Its not notably wetter, warmer, colder, windier than it has been for the last few hundred years.
And as for the attempted move to net zero in power generation, it is that rare combination, impossible of achievement and useless to its supposed goal if achieved. But the attempt can lead to truly disastrous political and social outcomes, far, far worse than those which would occur from any trivial increase in global emissions that happen if the UK does business as usual.
“Are you saying that its fine to use a collection of Class 3 and 4 stations to measure trends in UK weather?”
Again, you, like Sanders, seem to have no interest in finding out what they are actually used for. Their major use is the old fashioned one of telling people what was the temperature in their town. The one that Sanders has been brandishing is the history page, which simply tells people about the temperatures actually measured at various long record sites. No homogenisation, which would be done before any serious climatic use.
The other page with the “made up data” is simply a service to allow people to look up temperature normals near them.
If you want to make a claim about measuring trends, find out what data they do use, and how they do it.
So none of the information from these stations has made it into any of the official temperature data streams climate scientists use to determine climate change?
Correct.
“Are you saying that its fine to use a collection of Class 3 and 4 stations to measure trends in UK weather? “
Yes, because that is the reality of the UK’s latitude.
“WMO Siting Classifications were designed with reference to a wide range of global environments and the higher classes can be difficult to achieve in the more-densely populated and higher latitude UK. For example, the criteria for a Class 1 rating for temperature suits wide open flat areas with little or no human influenced land use and high amounts of continuous sunshine reaching the screen all year around, however, these conditions are relatively rare in the UK. Mid and higher latitude sites will, additionally, receive more shading from low sun angles than some other stations globally, so shading will most commonly result in a higher CIMO classification – most Stevenson Screens in the UK are class 3 or 4 for temperature as a result but continue to produce valid high-quality data. WMO guidance does, in fact, not preclude use of Class 5 temperature sites – the WMO classification simply informs the data user of the geographical scale of a site’s representativity of the surrounding environment – the smaller the siting class, the higher the representativeness of the measurement for a wide area. Indeed, it should be noted that WMO Class 5 is not the same as a Met Office ‘Unsatisfactory’ inspection assessment, which ultimately determines the ongoing use of a site. We use the Met Office grading system to determine record verification because; it has historical relevance, covering a wide range of long-standing criteria at UK observation sites, the equipment, and the exposure in a holistic manner and has clear meaning to what is acceptable or not. It tells us how much confidence we have in the data and permits comparisons. “
Yet real measurement uncertainties are ignored and not reported, to include the additional WMO siting uncertainties.
What is the optimum concentration of CO2 in the Earth’s atmosphere, blanton?
(obsession noted).
I’m having to much fun to follow your tip to exclude them (yet).
You would do better to filter them out, as I do with Bnice. Replies and engagement are simply polluting the site, which you will not mind about in the least, but its also bad for you, its engaging with the childish and dysfunctional, and it reduces you to their level. It also lowers your own credibility and so diminishes that of your other posts.
Consider: if you find it ‘too much fun’, what does that say about you?
It says that it is instructive of those coming here with an unbiased opinion on the subject, of me countering his manic denial with the real science/meteorology.
That he thread-bombs me with science free ad hominem is a bonus in that he is easy to bite back on.
Perhaps it is “feeding the troll”.
But it is merely pushback, that is indeed amusing in that he shows up the sceptic’s cause …. So a further plus.
I can’t exclude him as I use Chrome, which does not allow the app to work, but I thank you for the tip (via Nick Stokes).
BTW: “Credibility” here is in inverse proportion to the knowledge of the person contributing it.
So my “credibility” to denizens could never be lower as a result of my countering the nice man.
I will probably go over to using explorer/Edge here, as the novelty is wearing thin now anyway.
And it is a touch exhausting!
Michael:
I have reason to believe there may be (at last) repercussions for bnice
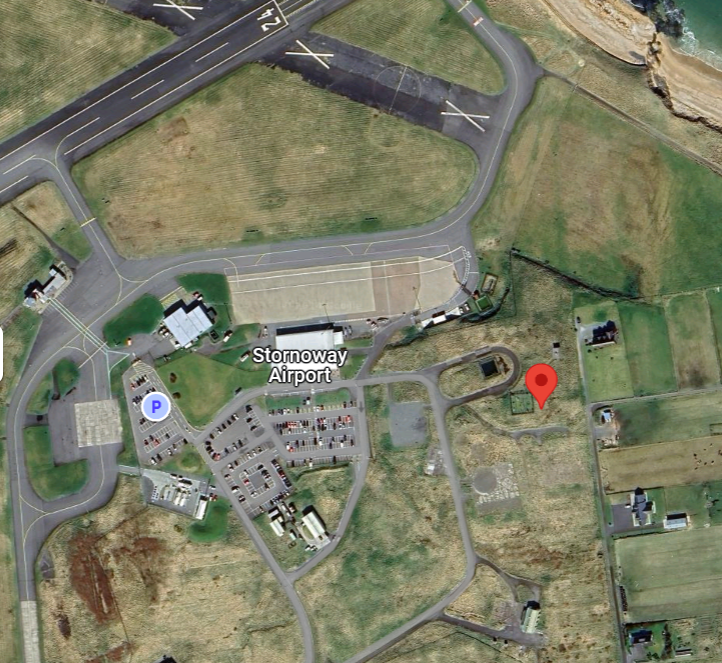
I have to assume that Lews Castle is surrounded by acres of black tarmac, and has always had jets idling near the measurement site.
Stornoway A/P is not “surrounded by acres of black tarmac”.
As can be seen here.
The instrument enclosure is just to the left of the pin.
Not all airports are massive build up areas.
Stornoway is part of the Isle of Lewis.
Small population – small airport.
There is some tarmac as must be expected, but it is “surrounded by acres” of grass.
https://www.google.com/maps/place/58%C2%B012'48.8%22N+6%C2%B019'07.1%22W/@58.2138665,-6.3190876,695m/data=!3m1!1e3!4m4!3m3!8m2!3d58.21355!4d-6.318637?entry=ttu&g_ep=EgoyMDI0MTIxMS4wIKXMDSoASAFQAw%3D%3D
Here is the image:
The fact that you think those runways and buildings etc won’t have a warming effect with the right breeze…
.. again shows you live in a total la-la-land. !
And there’s tarmac only 16m away.
I’m sure that was all there way back in 1900 and before.
Prevailing winds are South Westerly across the UK so that carpark looks to be a possible heat contributor.
Looking at a satellite picture of Lews Castle, I stand firmly by my sceptical viewpoint.
Only a complete moron would think that Lews Castle has the same micro-climate as the site in the airport ground.
Oh, its Banton.. that explains it. !
I have not been to Lews Castle, but I have been to a lot of UK castles and manor houses. One thing they mostly have in common are walled (stone or brick) gardens in which they grow lots of fruit trees, many of which would not grow outside such a micro climate. I would expect that the gardeners at Lews Castle and their bosses would have been more interested in temperatures inside the gardens and not out on the moor, especially in 1873. I could be wrong about the motivations to keep temperature records in the late 1800s. However, the records were kept for a reason, and that reason is unlikely to have been to chart global warming for the benefit of 21st century scientists. Either way, it is not the same micro climate as today’s airport.
I suspect the old weather site would have been behind the castle somewhere..
In the area now occupied by a whole heap of building and a car park.
Probably had to be moved to make way from them.
Wherever it was, the micro-climate would have been totally different from the current location on a hill 300m from that large inlet from the sea.
There can be absolutely no justification for splicing the data.
It doesn’t have to be surrounded for structures and ground cover to have a profound effect. For example, is the screen aerated? If not, structures can have a nasty effect on wind providing sufficient airflow to produce accurate readings. That is just one factor. Look at the photo shown by Nick below. I’ll bet the ground cover does not meet the requirements of the WMO for accurate measurements.
If you can’t justify accurate measurements with little uncertainty, tell us how you can the mathterbate data to obtain one-thousandths of a degree?
What was the name of Stornoway Airport before the name was changed to Stornoway Airport?
The station at Stornoway was moved 4.2 km, but it is still the same station…..
Isn’t this like the axe that George Washington used to chop down a cherry tree, where the handle has been replaced 7 times and the axe head has been replaced 6 times, but it is still the same axe?
Meteostat has historical weather and climate data for Boston Logan International, with records dating back to 1936 for daily data and 1943 for hourly data.
Where did 1753 come from?
From BEST:
BEST where the Met Office learnt data splicing.
Joining two separate sets of data be they 4km apart or 40 then you’re going to be led up the garden path.
Fake Data Nick strikes up another hockey stick.
That is 1 degree West of Logan Airport, which presumably is fitted with goalposts for Nick to be able to move.
It’s worse than that, the given position is not even in Massachusetts, it’s at the Keene State Preserve
Would love to see where the actual site is.
The co-ordinates are in the woods next to a lake.
FAKE site.. FAKE data.
The Nick Stokes way !!
Is that the BEST that uses all the WORST data they can find, and is too incompetent to identify urban warming
And of course Boston Logan Airport looks exactly the same as it did in say 1900, doesn’t it, thick-Nick !!
Talk about a MASSIVE expansion of buildings and tarmac. !!
Why always so disingenuous.. !!
And that latitude and longitude is roughly 50 miles away from Boston Logan Airport in any case.
Yep, weird, isn’t it.
Incompetence from Nick.. or deliberate mis-direction.
Hard to put %’s on that
Talk about silly… In 1753 Logan Airport was not even an island, only exposed at low tide. Compare the old map at https://bostonraremaps.com/inventory/harbour-of-boston-in-new-england-george-grierson-1730/?srsltid=AfmBOoop14w5w3jVgQUqhQeDinGWLTNl4CRLzsh1rtMhzL2gLahXfZe7
Logan airport occupies the ground to the right of the words “Ship Channel” vicinity of Bird Island. Been just a few changes over the last 250 years
He’s silly and dishonest.
Yes, and as I point out below (since no one else did) with this figure, human CO2 didn’t start for real until about 1940-ish, so you fraudsters keep claiming the temperature increase from 1850 as if it’s CO2-induced, when it should actually be subtracted from the trend since 1940-ish. You know what you’re doing too, so we know it’s deliberate. You know that 1.5 C will never be reached without cheating (or natural factors), and that ECS will never be shown to be discernible from zero without cheating. It’s what you guys do.
Yes, but this is WUWT.
Many UK and Irish ‘airport’ sites have records going back before the invention of flight.
My nearest one, Aldergrove, goes back to 1880.
Of course they used records from proximate locations, adjusting as required in the normal manner as set out in peer reviewed literature.
adjusting as required
No kidding.
“in the normal manner”
Bastardization is the standard now.
If you look at a chart that shows the 1930’s as being cooler than today, then you are looking at a bogus, bastardized Hockey Stick chart.
The Temperature Data Mannipulators have been very busy. They have been bastardizing as many regional charts as they can. But, the unmodified written temperature records put the lie to the “hotter and hotter and hotter” temperature profile of the bogus Hockey Stick charts.
Tony used to show written regional temperature records that had been bastardized by the Data Mannipulators. The original data showed the 1930’s as being just as warm as today. The bogus, bastardized computer-generated version showed the 1930’s being cooler than today.
This should be Fake Data Mannipulators.
Another blog comment hero who thinks he can refute the adjustment methods laid out in plain language and published in peer-reviewed papers – but doesn’t.
Why not, Tom?
Why speak big on this increasingly laughable and irrelevant blog when you can bring your wisdom to light via the normal peer-review process?
It’s because you can’t, isn’t it?
Trying to defend data fraud, again.
Give it up.
Speaking of laughable and irrelevant.
You should read your own posts. !
You have no wisdom to light anything.
Yes, we have seem the “adjustment” methods
They are facrical.
“Yes, we have seem the “adjustment” methods
They are farcical.”
Yes, they are. Nail should show us some evidence that the adjustments are necessary. Show us how the opinion of a modern-day computer operator, bent on climate change fraud, trumps the written temperature record.
When the temperatures started cooling after the 1998 El Nino temperature high, James Hansen, NASA’s climate czar at the time, started hemming and hawing abut how 1934 was not as warm as 1998, even though a couple of years earlier he said 1934 was 0.5C warmer than 1998. And btw, Hansen wasn’t the only person making this claim. The Climategate emails contain an exchange between Hansen and a colleague, where the colleague agrees with Hansen that 1934 was warmer than 1998, in this case, the colleague measured the difference at about 0.497C warmer than 1998.
So when the climate crisis narrative goes wrong, as it did after 1998 (Hansen was expecting the temperatures to continue to climb because CO2), so what do the climate alarmists do in this kind of situation? Why, they start mannipulating past historical temperatures! I wonder what Hansen’s colleague thought about Hansen changing his tune on 1934?
The Hockey Stick “hotter and hotter and hotter” temperature profile is all a FRAUD created to sell a CO2 Climate Crisis!
Here’s Hansen’s U.S. surface temperature chart where it shows 1934 to be 0.5C warmer than 1998.
Hansen 1999
The adjustments are not strictly necessary, they are mostly an effort to tidy things up around the edges – omitting the adjustments entirely only has a small impact on the global trend, increasing it slightly:
This is a comparison of every version of NASA/Hansen’s temperature history:
Can you point out where the fraud started?
Are you really this dense?
“The adjustment don’t change anything so its ok to do them” is a fav Stokesian line (and it appears like you are just regurgitating his standard post).
If they don’t matter then why bother with them?
The argument is that the adjustments don’t have a profound impact on the global trend, they just reduce the overall warming a bit, so if you really really hate them, you can just ignore them if all you care about is how much the planet has warmed. The reason scientists do them is first because they care deeply about getting things right, even when it means obsessing over minute details, and second because the adjustments start to matter when you look at smaller regions or shorter time frames.
It is data fraud, and you wonder why you have zero reputation.
This is more bullshit, climatologists care only about keeping the CO2 PANIC alive.
And when are you going to learn some basic metrology?
What is the intent of the fraud? Do scientists want you to think there has been less global warming than there really has been? What end would that serve any conspiracy?
How do you know the values of these adjustments?
You can compare the raw versus adjusted data, as I provided above:
https://imgur.com/oVWvIHF
On a station by station basis, you can either download the GHCN raw and adjusted datasets and compare them yourself, or use a tool like NASA’s station data viewer, which shows the raw and adjusted records for all GHCN stations:
https://data.giss.nasa.gov/gistemp/station_data_v4_globe/
How do you know what the true values are?
We do not know what the true values are, that is not within the purview of science.
Then these adjustments are nothing but guesses.
They cannot remove error as you claim, without evidence.
The adjustments are well-tested against real and simulated datasets and these results are described in the peer reviewed literature. In the US, we can also see that the full, bias-adjusted network is nearly identical to the pristine US Climate Reference Network. This would not be the case if the adjustments were not performing as expected.
If you can identify a source of systematic error or bias and evaluate its magnitude, you can remove it. There may be other systematic issues remaining that you have not removed, but you have still removed a source of systematic error from your estimate. If I learn that my tape measure is an inch longer than advertised, I can remove a systematic error from every measurement I take with it by subtracting an inch. I do not need to know the true value of any measured object to do this, I only need to identify and evaluate the error itself.
I’ve hit my tolerance limit for engaging with the alan j chat bot.
This is all bullshit: uncertainty is what you don’t know!
And you AGW shills and clowns have no idea what the “systematic errors” were in the 1920s, let alone the 1820s.
You are fooling no one except yourselves.
You keep displaying your callous attitude toward measurements. It is the attitude of mathematicians and statisticians. Numbers are just numbers where “tidying up” values is ok, to paraphrase you.
To physical scientists , engineers, and others where measurements are the lifeblood of what is accomplished, “data” is binary, either fit for purpose or not fit for purpose. Measurement data can certainly be analyzed for outliers and other possible errors and even corrected at the time of reading using calibration information. But the final result is either, fit for purpose or fit for nothing but the wastebasket! No tidying up to make it fit a preconceived result.
Your lack of mention about how homogenization affects the variance of the changed data and how that is propagated into uncertainty calculations also illustrates your complacency when it comes to measurements. You want to establish some bona fides in physical science, discuss measurement uncertainty and how it propagates into and through each calculation.
The fact that the data only needs “tidying around the edges” as the preparation for analysis indicates the it is indeed fit for purpose. Data cleaning is standard practice in data science and analytics, and nobody thinks their results are worse using clean data than using uncleaned data.
alan j has gone into chatbot augmentation mode.
You really walked into that one, didn’t you?
Would you agree that the unmodified, written historical temperature records show that it was just as warm in the Early Twentieth Century as it is today? You should, because that’s what they show.
So you contend that the people who recorded the written temperature records didn’t do a good job, and their results need to be run through a computer to get the correct temperature?
Here are 600 written, historical charts from around the world that don’t show a bogus “hotter and hotter and hotter” Hockey Stick temperature profile. Instead, they show that it was just as warm in the Early Twentieth Century as it is today.
Data Mannipulating Climate Alarmists knew they couldn’t sell their hysteria if the temperatures in the past were just as warm as today, so they bastardized the temperature record to eliminate the warmth from the past.
And you buy the fraud that modern-day computer jockey’s can tell us what the temperatures were in the past better than the people who actually experienced the weather.
You should go over to Tony Heller’s website and challenge him to a duel over the adjustments/fraud to the temperature records. Adjustments are opinions. The written record is the written record. I’m sorry that the written record does not promote your Climate Crisis narrative, but that’s life.
Here are some of the charts that put the lie to the bogus Hockey Stick chart profile.
https://notrickszone.com/600-non-warming-graphs-1/.
No reply, huh? I guess you couldn’t find a Hockey Stick profile at that link.
So how do climate scientists produce a Hockey Stick chart “hotter and hotter and hotter” temperature profile from data (the regional temperature records) that don’t have a Hockey Stick profile?
Answer: They have to change the data in some way. Say, adding in bogus, non-existent, cool sea surface temperature data to the mix.
That’s what Phil Jones did. Phil Jones doesn’t want to make the data he used to create the instrument-era Hockey Stick chart public because he says some people might try to challenge it.
This is what you base your worldview on. You’re on shaky ground, my friend. Taking the word of Data Mannipulating Charlatans will lead you astray.
Invariably, when called out on the Fake Data fraud, they go to the claim that “the adjustments don’t change anything”, i.e. gaslighting.
They adjust the data according to their peer-reviewed, published methods.
If you can refute those methods then you are at liberty write a refutation to the journals they are published in.
Funny, none of you ‘sceptics’ seem to be capable of doing that simple thing.
Very loud on blogs, very quiet in the peer-reviewed journals.
TheDenierNail hauls out the peer-reviewed canard, again.
They are convinced that having a couple of their lab partners rubber stamping each other’s results is the gold standard in science.
More arm-flapping to condone data corruption
Not a good look !
Peer reviewed science concludes with a theory.
None of it is fact.
If Climate “Science” had any integrity, “adjustments” would actually be called “corrections” and would be performed by constructing a calibration curve between the older instrument and its modern replacement, which itself would have been previously calibrated with an NPL or NIST standard.
We’ve seen too many of these “peer reviewed” papers that were loaded with identified errors that were allowed to be published.
We’ve seen too many papers retracted because someone, who did not point out a single error in the paper, disagreed with the conclusions.
Peer review once was a hallmark of science reports. No longer.
The author of the original work on Stornoway Airport was some chap called Ray Sanders. He also did a review of Aldergrove, perhaps you may like to read what an expert like Ray wrote about it.
https://tallbloke.wordpress.com/2024/12/27/aldergrove-wmo-03917-a-clear-view-of-the-car-park/
Darn that is a HUGE area of carpark. !!
How many cars does it fit ????
No heating effect at all, though.. right ! 😉
I know that area very well. I worked in some of those very buildings, in fact.
That area of the car park is very rough gravel; lapwing and other waders are happy to loaf and roost there over the winter.
It is roughly 1 km from the main runway. The most frequent wind direction at Aldergrove is westerly; i.e. from left to right.
That car park has zero temperature impact on the weather station, which was moved from a much more central part of the airfield some decades ago (with appropriate adjustments applied).
The fact that you can even accept the site at the airport might be relevant to reality is hilarious, to say the least.
The fact that you think gravel isn’t a huge heat sink, is even more stupid. !!
Met office building only 30m away blocks the westerly, dopey !
Main truck entrance driveway only 16m away.
And that’s a nice Met Office tar car park only 12m from the site.
Great heatsink.
Are you for real? Do you think nobody else has ever been there? “That area of the car park is very rough gravel” No it is not. You have zero credibility.
“I know that area very well.”
Of course you do……
The logic is irrefutable.
If the car park has zero temperature impact on the weather station, then it is clear nothing humans have constructed have any impact on the climate.
Splicing two distinct data sets that have used different devices with different locations and different environmental conditions, then adjusting the old downward is quite honestly unethical. Without access to the previous measuring device at the same location, one simply can not say that the recorded temperatures are incorrect and require ADJUSTING. There is NO scientific evidence to support that conclusion.
The only reason for doing this highly questionable ADJUSTING is to attempt to create a LONG RECORD that can be used to justify trends. That is equivalent to p-hacking in order to achieve a desired result.
It’s basically science fraud.
We’re being lied to, by Climate Alarmist Frauds.
Pure and simple — who defend their fraud with accusations of “DENIERS!”
Any method that makes the data better match the output of the modes, is considered to be valid.
Goodness gracious! You, Nick and the rest of the team all working the New Year holiday. Time and a half?
No, it is 2 Jan here!
“My nearest one, Aldergrove, goes back to 1880.” No it does not. It was installed in 1926
https://utils.ceda.ac.uk/cgi-bin/midas_stations/search_by_name.cgi.py?name=aldergrove&minyear=&maxyear=
I’m with Nick on this one. Renaming the weather station to Stornoway Airport is no big deal.
However, I would question the need to move it from Lews Castle and how the move was documented to ensure continuity.
Interestingly, the Met Office shows TMax/TMin for July 1893 as 16.7/9.9C and TMax/TMin July 2023 as 16.7/10.9C (I’m not sure how they managed that amount of accuracy in 1893!)
July 2024 is TMax/TMin 15.4/10.2C provisionally (until they add 1C of “warming” 😉
“However, I would question the need to move it from Lews Castle”
Stornoway airport must have a station.
Stornoway cannot justify maintaining two stations.
Now answer the second part Nick
They are not temperature measurements. They are monthly averages.
No, Nick, this:
Stornaway airport opened in1937, and the changeover presumably happened about then. I don’t know what documentation there was. We have to deal with historic data as best we can. There is no point in railing at the people of the time for not anticipating our climate interest.
You don’t “deal with historic data”, it is either fit for purpose or it is not. If it is not fit for purpose it is discarded.
Then you can not justify modifications to the measurements to bond them into a long record.
According to NIST, you can only determine bias by comparing readings of the same thing to readings of that same thing from a calibrated device that has its own bias correction chart.
Comparing two measurement devices, each with unknown biases, is the worst thing you can do. You will have no idea about corrective changes.
Why is it you folks never, ever support your assertions with university lab instructions, metrology textbook references, or JCGM quotes? Are you metrology experts?
The goal is to prove that CO2 controls the climate. Data quality is not a problem, so long as it can be used to support the goal.
According to NIST, you can only determine bias by comparing readings of the same thing to readings of that same thing from a calibrated device that has its own bias correction chart.
Comparing two measurement devices, each with unknown biases, is the worst thing you can do. You will have no idea about corrective changes.
Why is this so difficult for Stokes, Banton, Simon, and TFN to understand? Could it be because their entire worldview would collapse if they did?
“changeover presumably happened about then”
Wrong as always.
Happened late 1960s. Probably when those buildings behind the castle were built.
There is no point using data that is so hopelessly compromised…
… except for climate propaganda purposes , of course.
In other words, the lack of documentation is not a problem, it’s an advantage.
“There is no point in railing at the people of the time for not anticipating our climate interest.”
Yeah, people didn’t have a climate change agenda back then, they just wrote down the temperatures they saw on the thermometer.
Then, in our era, people who do have a climate change agenda got hold of the written temperature records and bastardized them so they told a completely different story than the written record.
The written record shows CO2 is not a major player in determining the Earth’s temperatures because even though there is more CO2 in the air today, it is no warmer today. So more CO2 has no measurable effect on the Earth’s temperatures,
The computer-generated bastardized temperature record shows it is getting hotter and hotter and hotter and today is the hottest time in human history. Just the kind of temperature profile a Climate Alarmist would want/expect to see.
The Temperature Data Mannipulators have a Climate Crisis agenda. They are liars and frauds perpetrating a hoax on anyone who will listen. They ought to be thrown in jail, imo, because this is deliberate fraud, which has cost humanity TRILLIONS of wasted dollars trying to control CO2..
Presumably. Again, assumptions.
HAHAHAHAHAHAHAHAHAAH
Nick trips up and points at the elephant in the lab.
Not convincing at all. Averages ARE made from temperature measurements.
If only the averages are being adjusted, that is even worse. That IS p-hacking to get a preconceived result. It is ultimately saying “We don’t care about the measurements, we only care about the averages being what we want!”
Nick doesn’t care about integrity, he has the result he wants.
“Stornoway cannot justify maintaining two stations.” Why do you spout complete bollocks endlessly? You have no idea whatsoever about whether or not an airport can justify weather recorders. For your information the Met Office climatic stations are NOT the ones used for aviation purposes. Moron
Really? Heathrow?
Yes you idiot there are actually multiple site weather readings taken at Heathrow for aviation purposes (like runway temperature) but only one Met office site. For such an ignorant moron you are one hell of a gobshite
They may take other readings, but the point is that they must take the readings that the MO needs, and the MO uses those. And if Stornaway has an airport, they don’t need a second station.
I’m guessing you didn’t actually read Ray’s comment, or at least you didn’t read ot with comprehension as your goal.
Great, someone else who instantly resorts to name-calling.
Only to liars
Scientific fraudster too Jeff. It’s not name-calling. It’s not even aimed at Nick. It’s so that new readers can see the climate liars, climate gobshites and crackpots for what they are. Nick knows what he’s doing, as does Betts.
They’re continuing this more recent fraud angle of claiming the temperature increase prior to significant increases in anthropogenic CO2, as if it was caused by humans. They like using the date 1850. This a) helps them with achieving their equally fraudulent 1.5 C increase, but, more importantly, b) lets them fake the actual temperature baseline so they don’t have to subtract it from the actual record. This has been going on for a while now and Nick, Banton, Nail et al. continue to do it, for whatever their reasons are.
If people like Stokes, Beeton, Banton, etc, did that, they’d be banned. We should be held to the same standards.
It’s what you get when you call people deniers, which they do on here frequently without getting banned. The mods on here use the same standards as far as I can tell.
That is likely true, however these people are LYING a heck of a lot and even when they get their asses handed to them ignore it and continue the same lies anyway, the rest of us suffer for their lies because of huge economic losses and liberty losses that will in time create violence to the liars to stop it has happened many times in the past.
A lot of people are suffering from the climate holiness club actions who want to regulate everything in the delusional idea that we are in deep peril over he he…. ha ha ha…. trace gas with a trace warming effect above 100 ppm level.
+1000
Well said.
TFN, Banton et al. would normally be written off along with Flat Earth and Apollo Moon Landing conspiracists. Unfortunately, unlike the latter group, our WUWT trolls are not harmless but rather shills for an extremely insidious and dangerous Neomarxist powergrab.
Flat Earth? Apollo Moon Landing? thanks,
All my other conspiracies have been shown as valid. I need a few that I can just hang on to without thought or fear that I will loose my dopamine boost(s) to reality.
I despise them for trying to take methane, diesel, and gasoline away from my life.
Trying to take them away for no good reason!
Yep. It will change global temperature averages by exactly zero.
“They’re continuing this more recent fraud angle of claiming the temperature increase prior to significant increases in anthropogenic CO2, as if it was caused by humans.”
You’ve not heard of land use changes then?
https://www.sciencedirect.com/science/article/abs/pii/0045653594901694
“Pre-industrial human activities which changed the atmospheric greenhouse gas or aerosol loading, or which modified the properties of the earth’s surface, such as albedo, roughness, or vegetation cover, had the potential to modify the regional or even global climate. The primary activities which could have produced these effects were deforestation, burning, and agriculture. These activities were not independent, and often occurred together. Deforestation could have produced warming or cooling at the surface, and different effects on different scales, depending on the fate of the biomass removed and the new use of the land. Burning is much less now than it was in the past in some regions, which would have produced warming as the burning decreased. This may be a partial explanation for the Little Ice Age. While a thorough survey of such pre-industrial human activities is called for, current information indicates that regional climatic effects were large in some regions, such as western North America, and hemispheric or global effects were possible. Once these pre-industrial human climatic forcing factors are better quantified, existing numerical models of the climate can be used to examine the impacts on regional and global scales.”
And then we get the usual projected hate via ideologically motivated paranoia.
Oooh, look over there, a bunch of squirrels. See, if you didn’t have fraud, you wouldn’t have anything. You just continued the lie about carbon dioxide by trying to change the subject. Not on this site luvvie.
What a moronically stupid attempt to change the subject..
FAIL !!
Note the word “could” throughout. Evidence-free garbage which Banton thinks passes for Science.
Its what he does.
I debate perfectly civilly with honest people – liars and charlatans get short shrift because that is what they deserve.
Mr Sanders:
Like I said it’s obvious.
ATC can easily take the observations, even on a hourly basis.
I doubt a school (see link below) can do that.
Aircraft safety Mr Sanders …. you don’t think that is justification enough?
You know, like need for aircrew to be given wind speed (and hence desigrated runway). Temperature for fuel load and barometric pressure for setting of altimeter QFE/QNH.
(BTW: I speak as someone who spent many years observing the weather and passing it to ATC for the UKMO at a variety of RAF airfields)
https://www.tandfonline.com/doi/full/10.1080/14702541.2022.2158366#d1e333
It seems the weather station moved over to the airport in 1968 ..
“The recording station at Stornoway moved to Stornoway Airport in 1968, from where the record continues today”
“For your information the Met Office climatic stations are NOT the ones used for aviation purposes. Moron”
What is that supposed to mean?
Apart from the “moron” part that is.
The only moron here is you, as your use of the word makes you out to be one.
So you now admit they are totally different sites, and that Chris is totally correct.
Your petty arguments fall flat and FAIL as usual.
As, I was about to say Nick.
Is obvious really.
Air traffic controllers at the airport to the job of observation as well as their other normal duties.
You really are that thick aren’t you.
Yep, Banton is one of the most mal-informed AGW-junkies around. !
True, and Nick saying he was a senior guy at the Met Office is supposed to be a good thing. Ha ha ha.
Maybe the UK can borrow Elon and Vivek for a month or two? I hereby volunteer to assist in the mission.
Elon and Vivek need to look into the temperature data fraud we are all being forced to live with, causing the waste of TRILLIONS of dollars in a futile effort to control CO2, when CO2 does not need control, since CO2 is nothing other than a benign gas, essential for life on Earth.
Unfortunately, the temperature data fraud is international in scope which might make it difficult for Elon and Vivek to get data from some parties.
The exact definitve display of DK sydrome right there …
“The Dunning-Kruger effect is a cognitive bias that occurs when someone overestimates their abilities or knowledge in a particular area due to a lack of skill or knowledge. It’s a type of delusion where someone is so ignorant that they don’t recognize their own shortcomings.
Ah. A self-disgnosis.
No:
Just have experience working with weather at airfields
Many years of it.
So not thick, and certainly not abusive – as you appear to be.
If all you can do to counter is to give an ad hom then your “argument” is a fail.
Hi Anthony, against the torrent of downvotes and personal attacks you’re receiving, I just wanted to say I’ve found your comments thoughtful and informative, and I’ve earned a lot. In my experience, downvotes and insults here come in direct proportion to how unable the populace is to mount a cogent rebuttal. The wronger they are the angrier they get.
You mistake mockery for anger, silly shill.
To any outside observer, the mockery is indistinguishable from petulant tantrums. If that is not your intent, perhaps this is a signal to adjust your tenor.
Have you interviewed all the outside observers?
Stop whining and learn some basic metrology.
Uncertainty is a metric for the limit of knowledge about a measurement result, it is not error.
Climate science believes it is possible to increase knowledge with averaging and subtraction.
You and they are wrong, it has exactly the opposite effect.
“Have you interviewed all the outside observers?”
That was going to be my question until I read your comment. 🙂
Methinks AlanJ is assuming too much.
That seems to be a feature of Climate Change Alarmists.
Outside of his robotic shilling for the AGW party line, he gets real quiet when his gaslighting is exposed.
Exactly how much have you earned?
Is profit/payment based more on the number/type of response, or is it based more on the number of your posts? How exactly is the matrix set up?
It is instructive that seizing on a typo, somehow can be turned into a basis to attack motives.
But often applied here.
Anthony can’t take a joke.
Great minds think alike! 🙂
Thank you Alan.
Yes, I gauge the veracity of the post by the size of the red number.
Funny, I haven’t noticed a lot of red numbers under your posts or under AlanJ’s posts. Maybe I’m too early.
No, you’re to late … when I (any supporter of climate science) posts early on then they are bombed with red numbers.
“and I’ve earned a lot.”
A Freudian slip? 🙂
Why must the airport have a station?
Airports do need weather stations, but those are put as close to the runways as possible. This station does not meet the needs of the airport.
Take that up with the airport. The fact is, there is a station maintained there, perfectly OK for MO purposes. And Stornoway could not justify a second one.
Nick you really do need psychiatric help with your problem.
Says the pot calling the kettle black
“… perfectly OK for MO purposes.”
That, right there, is the problem.
Correct, the problem lies with you assuming that the MO purely exists to further the “AGW scam”.
There is no “scam” and the UKMO is mandated to provide services to the UK public …. Which is what Nick (of course) means.
And not to micromanage inconsequential siting issues when the station is there to serve the airport and not be integrated into some “doctored” global temperature series.
Three obvious points. Firstly different climatology from two significantly different locations. Secondly bonding two different datasets. Thirdly deliberate disguising the bonding. The original work
https://tallbloke.wordpress.com/2024/12/23/stornoway-airport-wmo-03026-the-met-offices-incredible-forecast-abilities/
Great report Ray..
These should not be spliced together, but recorded as two separate sites.
All part of the fakery.
You are absolutely correct! Records should not be bonded by adjusting one or both just to create a LONG RECORD. That is equivalent to p-hacking, that is, searching for a preconceived outcome.
“Firstly different climatology from two significantly different locations.”
No.
https://rmets.onlinelibrary.wiley.com/doi/10.1002/joc.3370140102
“In view of the implications for the assessment of climatic changes since the mid-nineteenth century, systematic changes of exposure of thermometers at land stations are reviewed. Particular emphasis is laid on changes of exposure during the late nineteenth and early twentieth century when shelters often differed considerably from the Stevenson screens, and variants thereof, which have been prevalent during the past few decades. It is concluded that little overall bias in land surface air temperature has accumulated since the late nineteenth century: however, the earliest extratropical data may have been biased typically 0.2°C warm in summer and by day, and similarly cold in winter and by night, relative to modern observations. Furthermore, there is likely to have been a warm bias in the tropics in the early twentieth century: this bias, implied by comparisons between Stevenson screens and the tropical sheds then in use, is confirmed by comparisons between coastal land surface air temperatures and nearby marine surface temperatures, and was probably of the order of 0.2°C.”
“Secondly bonding two different datasets”
None issue.
The alternative is to have 2 datasets, 4km apart in the same geological surroundings. Just what would that have acheived in saving the world’s climate record from corruption. (rhetorical – obviously, zero – to those not consumed by hatred of the MetO).
Again peeps here think only in terms of the role the UKMO has in climate modeling. That is but a tiny subset of what it is mandated to do. It handes all things weather for the UK public. Full stop.
Sorry if that task offends you.
“Thirdly deliberate disguising the bonding.”
Rubbish – it’s inconsequencial in either case.
How about you provide evidence of the about hand-waved assertions
that perport to be of consequence?
There you go, condoning data maleficence.
Why doesn’t that surprise me. !
They are two distinctly separate microclimates.
They should be reported as two separate sets rather than splicing together to create a long , but FAKE data set.
And too dumb to realise or know what a microclimate is… hilarious.
Can you keep your Dunning Ktuger to yourself please.
Banton oozes Dunning-Kruger…
I gave a +1, but not sure I agree. I think he’s another one of the many (like Nick possibly) who don’t have the balls to admit that their lifetimes of wonderful falsifiable hypotheses got falsified, so they’re somewhere in the denial, anger, bargaining phases. They never even knew what a falsifiable hypothesis was, but now they’re living one.
I think you are right. The Climate Alarmists are losing traction with the public and they can feel it, so they are going through some personal changes.
It’s difficult to accept that the worldview you had for so long is actually wrong. Some people don’t accept it and just hang on to the old way of thinking with a death grip.
Mere projection Mr he who would be nice.
“The Dunning-Kruger effect is a cognitive bias that occurs when someone overestimates their abilities or knowledge in a particular area due to a lack of skill or knowledge. It’s a type of delusion where someone is so ignorant that they don’t recognize their own shortcomings.“
As a retired professional meteorologist I beg to differ.
How many times are you going to spam this red herring?
If you are a retired professional meteorologist you are the living proof of just how unqualified and incompetent some Met Office employees are. Your appeal to fake authority is quite mind blowing.
We still haven’t heard what are your qualifications to be rudely lecturing a Senior Meteorologist on meteorology?
Gob-smacking exhibition of DK syndrome.
Words fail me other than that.
With added insult as well.
An abusive DK sufferer.
Now Mr Sanders, assuming your profession is/was in some sort of scientific field (you have yet to tell).
I propose that you are “unqualified and incompetent” in it.
So how easy it is to do?
What an arrogant buffoon you are.
“As a retired professional meteorologist”
As a retired professional meteorologist, let me ask you a question.
When the first Instrument-era Global Temperature Chart was created by Phil Jones, the only temperature data available to him or anyone else was from the written, historic, regional temperature records from around the world.
So how do we end up with a Global Temperature Chart that has a “hotter and hotter and hotter”, “today is the hottest time in human history” temperature profile, when none of the regional temperature records from around the world have this temperature profile?
The written, historic temperature records show a cyclical climate movement where temperatures warm for a few decades and then the temperatures cool for a few decades. This warming and cooling has happened three times since the end of the Little Ice Age around 1850. From there the temperatures warmed to a high point around the 1880’s, a similar high point during the 1930’s, and the similar warming of today.
The 1880’s, the 1930’s, and the current day all belong on the same horizontal line on the chart because they are all equally warm, within a few tenths of a degree. That’s what the written, historic temperature records say.
So how do you get a temperature profile like the Hockey Stick which says the climate is getting hotter and hotter and hotter, decade after decade, with today being the hottest time in human history, from regional temperature data that does not show anything of the kind?
Have you ever wondered about that?
“Hide the decline…”
“… with today being the hottest time in human history, from regional temperature data that does not show anything of the kind?
Have you ever wondered about that?”
No, because that is not the case ..
https://www.researchgate.net/publication/314285955_An_Overview_of_Mainland_China_Temperature_Change_Research
“Changes in country-averaged annual mean surface air temperature anomalies over mainland China during 1901–2015 [relative to the 1971–2000 average; updated from Wang et al. (1998), Tang and Ren (2005), Tang et al. (2009), Committee on China’s National Assessment Report on Climate Change (2015), and Cao et al. ( 2013)].”
Canada:

 ?w=600
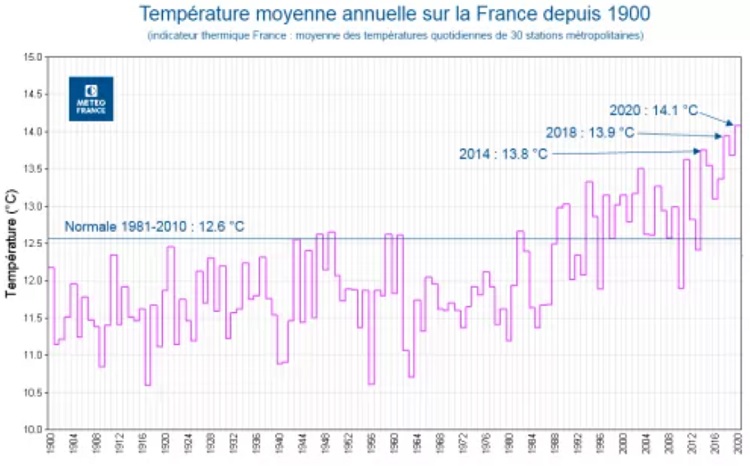
France:
UK:

Sri Lanka:

Arctic:

Hawaii:
 ?fit=627%2C333&ssl=1
USA:
 ?itok=rPIDKKxN
blanton has the hockey stick parade today.
purport
“in the same geological surroundings”
That is a manifest LIE. !
They are totally different microclimates.
Here is a picture from a local TV station of local stations. See that pink circle? Tell everyone what the homogenized temperature for that location using a typical homogenization algorithm.
We’ll see if you can get the correct answer.
Hey Jim,
don’t leave us hanging… just look’n I give it a 64. What was it? Given drainage and elev change was it below 60?
May I have some garlic bread with that world salad, please?
Either increase your attention span or learn some meteorology.
I’d suggest both.
Stornoway is not just a renaming, it is a a renaming and a 4 km move. So a splice of two different stations with different local settings.
Missing in this conversation is, did they use the same sensors after the move as before? It may have been stated somewhere, but if it was, I missed it.
It is a big deal if the records are spliced to create a LONG RECORD by adjusting the previously recorded temperatures to show a matching data where they join.
Would science be allowed to change gravity acceleration data at different points on the earth so that there would only be one value for the whole earth?
Would science allow the folks searching for the Higgs boson to modify previous data so they could say all of our data now agrees that we have conclusive evidence?
What would the legal profession say if a certified lab said they were going to lower the blood alcohol levels in the past in order to meet a newer and better measuring deivice?
Data records should be sacrosanct . Adequate conclusive evidence of being incorrect should be required. Then, the data should be discarded, not adjusted.
Not discarded. Especially if incorrect, annotated and archived. Historical records should be preserved.
If you can’t see the end of all things Scottish in this graph… I can’t help you…..(sarc)
Rainfall… horrific.
Funny how much of the U.S. shows the same thing in rural areas for monthly averages.
Funny how the famous Hockey Stick vanishes when real temperature series are examined.
There are no Hockey Stick temperature profiles in real, written temperature records.
The written, historical temperature records show that the Hockey Stick chart “hotter and hotter and hotter” temperature profile does not exist in reality.
The Hockey Stick chart is a BIG LIE created in a computer to sell the CO2 Climate Crisis Hoax. It turns the temperature record on its head. It’s High-Dollar Fraud.
Yes, it looks like it was just as warm in Kansas in the past, as it is today.
This means that the increased amount of CO2 in the air today has had no effect on the temperatures because it was just as warm in Kansas in the past with less CO2 in the air. So more CO2 does not equal an increase in the temperatures in Kansas.
And of course, this applies to the whole world because the whole world has the same temperature profile as Kansas where it was just as warm in the past as it is today.
CO2 shows no effects on atmospheric temperatures.
PANIC!!
It is extremely rare that I almost agree with the ‘watermelon stokes’ but in this case this is really a ‘nothing to see here, move along’ item.
Clearly weather has been monitored at or near that location a long time. And we know that alrmists are perennially playing fast and loose with language, but I see no evil intent here.
Just the usual incompetence and lack of clarity.
Leo, have you read my original work from which this article is extracted? I did question whether or not it was ineptitude or motivated. Surely it does seem rather strange to attribute 19th century data to a site with “airport” in the name. It was extremely difficult to identify the two separate datasets and as I indicated most undergraduates would not have questioned the issue. Here is the original
https://tallbloke.wordpress.com/2024/12/23/stornoway-airport-wmo-03026-the-met-offices-incredible-forecast-abilities/
It is also worth considering it in context of this report and those others linked in it.
https://tallbloke.wordpress.com/2024/12/17/southampton-mayflower-park-dcnn-5642-artificial-unintelligence-spliced-datasets-fake-estimates-disinformation-and-a-1976-record/
Whether it is incompetence or deliberate, once the problem has been pointed out, one can only assume that there is a deliberate decision to do nothing.
No, the deliberate decision is going to be that they have to lie harder.
“Near” is not good enough. 4.2km may not seem like much, but I’ve seen as much as a 27F difference between locations just 13 miles apart. The readings are for that location, not a different one.
I typically see 0.25 C to 0.5 C per mile change in temperature during my daily commute. No significant change in altitude.
At last a unbiased rational view.
Well done.
But not incompetence.
Simply a common-sense view that it was unimportant not to mention it.
As I say peeps on here may be obessed with such matters, but to the met officer compling data 9-5 weekdays it doesn’t even come into his thinking.
Not important.
It makes not the slight jot of difference, save to dog-whistle rage on here.
“As I say peeps on here may be obessed [sic] with such matters”
The climate catastrophists are obsessed with 0.004 degrees of warming. I’d say that’s a much more obsessive trait.
“But not incompetence.”
Sorry, but splicing disparate data sets and pretending they are one set is either incompetence or fraud.
The fact you condone it, shows it was probably the latter.. with intent to deceive.
Hanlon’s Razor states: never attribute to malice that which can be adequately explained by neglect, ignorance or incompetence.
Any sufficiently advanced incompetence is indistinguishable from malice.
The idea that two sites 4km apart can be treated as the same site, goes against basic science. It can’t be dismissed as being in the same area.
Trying to splice two data sets together violates every standard of data management.
This reminds me of BEST and my old home town. It had a station at the PO until the late 1940s and one at the airport since the mid 1940s. They had an AP site going back to 1892 because it was the PO and the AP stations combined. What was silly was the corrections. Very different for the PO and the same data used for pre-1944 AP.
Nick, be honest with everyone, have you ever been in charge of making recordable measurements of a measurand that had legal and scientific requirements? I would suggest not, after seeing your flippant responses to legitimate questions.
I just helped take a load of corn to the elevator yesterday. The elevator takes a test sample from the load to determine the moisture content. That measurement is used to reduce the payment per bushel. The measuring device is required to be calibrated and is checked by state auditors. Why? Because it would be easy to defraud farmers.
Certified labs must continually check and calibrate their equipment. Why? Because a misquoted blood alcohol level can be costly. Therapeutic levels of medicine are vitally important. On and on.
The world is being asked to turn its energy sources and demand cycles upside down while seeing electric rates skyrocket. The public deserves to be shown data that is absolutely accurate and calculated correctly. That just isn’t happening.
Homogenization error is being hand waved away as being close enough. Past recorded data is being reimagined with no scientific EVIDENCE that it is wrong. Climate science dismisses the fact that one can not increase resolution beyond what was actually measured by calculating average upon average upon average. I am drafting a letter to my U.S. congressional representatives that funding be allocated to have NIST do a comprehensive forensic audit of data changes and the calculations being done to achieve one-thousandths resolution of data recorded in integer fashion up to 1980.
Can you point us to any audits ever done by the weights and measures agencies in any country as to how climate science treats the data it uses. Please show us one.
DUI defense attorney here. If one is suspected of DUI, the first thing done is to get a clean breath sample with a calibrated machine, operated by a trained operator. If you haven’t got that, there is no case. I note that results of a roadside breath test are not admissible in court, at least where I practice. They only provide “reasonable suspicion” that a driver is intoxicated, as do all those field sobriety tests.
Funny story. Back in the early 80’s I was on a DUI jury where a fellow had pulled up to a toll booth in what appeared to be a car that had been rolled. Glass all gone and beat up. A HP officer stopped him as the exited the toll booth, did a field sobriety test, and arrested him. They obtained a blood sample and instead of immediately sending it to a lab, they put it in a desk drawer.
The way the law was at the time, it specifically said an officer must OBSERVE the suspect driving in an unsafe manner in order to stop a vehicle. In addition, they lost the chain of evidence by having it stored in a desk drawer for over a day. We let him off!
As a defense attorney, I got people out of trouble when the police did not do their jobs properly as well. I also know of a case where the driver’s blood alcohol was almost double the legal limit, but she was not driving in an unsafe manner. The judge found her not guilty of driving while impaired. There are lots of things that go into it, but having good data from calibrated equipment is paramount.
Jim I personally do not feel constrained by politeness with people/bots like nick Stokes. He is an incompetent idiot. In my part of the UK we all these people “Gobshites” on account of everything they say is complete crap. Nick Stokes is an insignificant pratt and should be ignored.
Absolutely agree, he (and his acolytes) are nothing but shills for the IPCC official line.
Great comment Ray. 🙂
Precise, accurate, and to the point. !
Are you really trying to insist that it represents a continuous representative record? Presenting it as such is fraudulent, and I do believe that is the point of the article. Taken in context with the other misrepresentations presented, your “beat down” seems rather a pathetic attempt to excuse deliberate fraud.
If it moved 4.2 km, it quite clearly is not the same station.
4.2 m, maybe. 4.2 km it’s a new station and the start of a new record.
The government run Met Orafice is wedded to the WEF and the great warming scam.
Well parts of it are.
Some of the forecasters go a long way to never mention climate change at all. It’s just some political crap that infests the met office and appears on their website run by activists within that cannot be sacked.
Leo, may i tap you up for your power network knowledge please? In my report on Amersham
https://tallbloke.wordpress.com/2024/08/24/amersham-field-centre-dcnn-4570-gridwatch/comment-page-1/
The issue of waste heat from the transformers affecting readings came up. do you have any views on that?
WOW, they don’t seriously use that site for weather or climate purposes do they. !!
I used to walk past the local substation regularly, and on some day when the wind blew the right direction there was a very distinct increase in temperature.
Summer evening.. very warm air coming from the transformers at peak demand time.
Pleasant in winter.. Not so much in summer. ! 🙂
All that tar underneath wouldn’t help either.
That should be class 8 or 9 ! 😉
Please keep posting these links to Met Stations..
They show what a FARCICAL measurement system it really is. !
There are actually worse ones than Amersham! You should see Bingley no 2
https://www.google.co.uk/maps/place/53%C2%B048'41.0%22N+1%C2%B052'00.1%22W/@53.8113929,-1.8692738,642m/data=!3m2!1e3!4b1!4m4!3m3!8m2!3d53.8113898!4d-1.8666989?entry=ttu&g_ep=EgoyMDI0MTIxMS4wIKXMDSoASAFQAw%3D%3D
Interesting how the worst of the bots so often show up first.
I take it that their climate models assured them of manned flight prior to 1873!? Sounds right!
Once again, the comments so far are revealing; some people prove their bias and non-scientific attitude. The simple conclusion is that there can be no temperature record for the Stornoway Airport site prior to 1968. There is a temperature record for Lews Castle from 1873 to 1968. Patching the two together is ‘Michael Mann science’.
To append the two as the same record tends to legitimise taking the gold that existed in Indonesian creeks prior to 1995 and moving it a few km to Busang drill core samples and then calling it a gold mine. How did that work out?
“The simple conclusion is that there can be no temperature record for the Stornoway Airport site prior to 1968. There is a temperature record for Lews Castle from 1873 to 1968. Patching the two together is ‘Michael Mann science’.”
So what?
It makes no difference where on that tiny island the instruments are located bar being on the west coast and then moving inland, or there is a sig change of height.
It is windswept and largely barren.
Both locations are at the same altitude (Lews Castle is ~ 15m higher not a sig difference) and the same distance from the sea to the east.
Yet somehow this corrupts the worlds’s climate history!
In fact Lews castle is much more likely to be the warmest of the 2, due it’s surroundings – Stornoway town to the east and a wooded area around the whole of the western side. Especially to the SW, which is where he prevailing wind comes from.
https://www.google.co.uk/maps/place/Lews+Castle/@58.2131513,-6.3486758,11121m/data=!3m1!1e3!4m6!3m5!1s0x489209d566a00d6f:0x27a7267522339f60!8m2!3d58.2115208!4d-6.3941607!16zL20vMGJfYzF3?entry=ttu&g_ep=EgoyMDI0MTIxMS4wIKXMDSoASAFQAw%3D%3D
Meteorology is not your strong point is it? Location is crucially import even within a few metres. Read the CIMO regulations from the World Meteorological Organisation / International Standards Organisation before posting such nonsense. https://www.eoas.ubc.ca/courses/atsc303/Instruments/wmo_guides/CIMO_Guide_2014-Met_Site_Classification.pdf
Who need experts like the chap who compiled the original report. eh?
https://tallbloke.wordpress.com/2024/12/23/stornoway-airport-wmo-03026-the-met-offices-incredible-forecast-abilities/
Banton doesn’t have any “strong” points.
He seems to be universally brain-washed with AGW bias and mantra…
… incapable of any rational thought process whatsoever.
He needs to wake up to the fact that a significant majority of surface stations are TOTALLY UNFIT for the purpose of recording temperature changes over time.
Yet these are the sites that are use to support the AGW scam.
See above oh ignorant nice one.
“Meteorology is not your strong point is it?”
Tony Banton has been senior meteorologist at the Met Office, with qualifications to match. And you?
Titles are meaningless, Stokes.
I’ve personally known PhDs with high positions that are, stupid.
So that means all PhD’s are stupid?
Stupid is, are those that think and say that.
And typical thinking amongst denizens.
That because someone somewhere has a contrary opinion to the mainstream.
Then ergo the mainstream is wrong.
The answer lies in you wanting the contrarian to be correct not that he/she is.
Reading comprehension problems, blanton?
Where exactly did I imply this?
Rest of you word salad rant skipped.
“Titles are meaningless, Stokes.
I’ve personally known PhDs with high positions that are, stupid.”
So what exactly did you mean by this post?
That although “I’ve personally known PhDs with high positions that are, stupid.” That doesn’t mean they all are.
Really? pull the other one.
He doesn’t know his physics, that’s for sure. How about you?
(If he did, he wouldn’t have written this nonsense: “Then IR radiometers are wrong when they show that indeed there is downwelling IR from a clear night sky?”)
So your qualifications?
Mine are irrelevant. Anthony Banton’s are the ones under discussion, and he falls far short, as I pointed out.
As I said above a perfect example of DK syndrome:
“The Dunning-Kruger effect is a cognitive bias that occurs when someone overestimates their abilities or knowledge in a particular area due to a lack of skill or knowledge. It’s a type of delusion where someone is so ignorant that they don’t recognize their own shortcomings.”
And of therefore, of course, anyone who has experince/expertise in anything they are ideologically apposed to is the igoramous and they the expert.
Well done – for expressing a perfect example of it.
blanton spams his cherished red herring again.
Anthony, you failed to demonstrate any correct physics knowledge after writing the above nonsense about IR thermometers. What do you think the word “radiation” means, for example? What do you think “energy” means? And what exactly do you believe I don’t know, but that I think I do? To support your assertion that I am some sort of Dunning-Kruger case?
Err, could you please point out where I “ ….. after writing the above nonsense about IR thermometers”?
That is to say that is not one of my posts.
Sorry.
OK:
Tell me what your knowledge/expertise runs to as regards meteorology – if it’s the equal of mine then I’ll concede.
Anthony, you wrote that nonsensical line here:
https://wattsupwiththat.com/2024/12/17/climate-models-clouds-olr-and-ecs/#comment-4008728
It is definitely one of your posts. Or at least it looks like it, since the comment is labeled “Anthony Banton”. If that was a different Anthony Banton, then I retract my claim, and my apologies for the confusion. I expect it’s a sufficiently common name that there are more than one of you.
What I said about your abilities (based on that posting) had nothing to do with meteorology per se, and everything to do with physics (which of course is what ultimately results in meteorology, and everything else too). Your (or the other Anthony Banton’s) grasp of physics is faulty. One can certainly debate how much physics a meteorologist needs to know, and obviously you made a pretty good career without it. Many other meteorologists do too. But that means you should limit your comments to clouds and thunderstorms and jet streams, and avoid anything to do with the physics of “climate change”, or “radiant greenhouse effects”, because that is, well, physics. And as I pointed out, with evidence, you simply don’t know yours. (None of the other “climate scientists” do, either, by the way, so you have plenty of company.)
To be fair, the physics of electromagnetic radiation in particular is highly counterintuitive, and everything you’ve been told about it by “climate scientists” is flat-out wrong, so it’s not surprising that you have failed to grasp the correct nature of the phenomenon. At least, as best we understand it today – everything could still change! That’s how science works, of course.
You mean:
“Then IR radiometers are wrong when they show that indeed there is downwelling IR from a clear night sky?”
You need to read it in conjunction with the post I was replying to …
“I see no opportunity for ‘IR back-radiation’ from radiative decay of vibrationally excited CO₂ in the troposphere, although, as you note, everyone talks about it.”
From Pat Frank:
It’s sarcasm – meaning of course there is (IR back-radiation) from CO2 as IR thermometers show it under clear sky (lack of WV) conditions.
Further this 10 year study at 2 far separated locations shows …
First direct observation of carbon dioxide’s increasing greenhouse effect
Anthony, IR thermometers and radiometers do not show “downwelling IR [power] from a clear night sky”. Who told you that they did?
If you meant “downwelling IR energy“, that’s different, but IR thermometers do not show that either – not directly. And I’m not yet buying that you have any clue about the difference between “energy” and “power”, so both phrases almost certainly look identical to you anyway.
Your linked study includes this claim (from the summary article): “These instruments, located at ARM research sites in Oklahoma and Alaska, measure thermal infrared energy that travels down through the atmosphere to the surface.”
No they don’t. Infrared energy travels through the atmosphere in all directions, yes, but infrared power doesn’t, and their instruments measure power, not energy. The instruments only show energy being transferred (power) from the atmosphere to a liquid-nitrogen-temperature sensor, that happens to be located at the surface, but which has nothing to do with what’s going on at the rest of the Earth’s surface, because the rest of the Earth’s surface is not at liquid-nitrogen temperatures. But you knew that, right? You wouldn’t be trying to pull a bait-and-switch on us, would you?
One of the authors (Feldman) also lies “We measured radiation in the form of infrared energy”. But that’s not what their instruments do, is it? No, they measure infrared power, which is not the same thing. There is certainly a relationship between the two – but now you’re getting into the realm of assumptions, estimations, calculations, and guesses, not “measurements”.
Their claims about “radiative forcing” at Earth’s surface are imaginary. However, what they can legitimately conclude from their measurements is that the atmospheric temperature (including the temperature of the CO2 molecules in it) increased during their measurement period. That would be a scientifically supported conclusion, but a lot less exciting than the one they claimed, and it isn’t really news – nor was it in 2015 for that matter. Nor does it support the fictional notion of a “radiant greenhouse effect” that they are trying to sell us.
Indeed, since their sensors are closer to the temperature of outer space than the temperature of Earth’s surface, what they are really measuring is how much radiant energy (the rate of transfer of which is denoted as power) would be emitted to space from the atmosphere. They have managed to conclude that this power measurement in space would be increasing. But we knew that already, or at least we could have guessed, because if Earth’s temperature increases, all else being equal, the amount (rate) of energy being radiated to space will also increase. That’s not really news either, and pretty much the opposite of a “greenhouse effect”, since they are describing an increasing loss of energy to space – a cooling effect.
In other words, yes, Earth’s temperature has gone up since the Little Ice Age, and the amount of CO2 in the air has gone up too. And CO2 absorbs and emits infrared energy, like water vapour, of which there is a lot more. No one disputes any of those statements, as far as I am aware. But there is no “downwelling IR power” or “radiative forcing” at Earth’s surface, at normal surface temperatures. No one has ever measured any. The thermodynamics of such a phenomenon would be backward, and contrary to the 2nd Law. Do you know what the 2nd Law says? And what it means?
“Anthony, IR thermometers and radiometers do not show “downwelling IR [power] from a clear night sky”. Who told you that they did?”
“If you meant “downwelling IR energy“, that’s different, but IR thermometers do not show that either – not directly. And I’m not yet buying that you have any clue about the difference between “energy” and “power”, so both phrases almost certainly look identical to you anyway.”
No, I meant IR emission and for one, Roy Spencer and they do indeed measure IR emission from a clear night sky as he shows …
https://www.drroyspencer.com/2010/08/help-back-radiation-has-invaded-my-backyard/
“The IR thermometer was measuring different strengths of the greenhouse effect, by definition the warming of a surface by downward IR emission by greenhouse gases in the sky. This reduces the rate of cooling of the Earth’s surface (and lower atmosphere) to space, and makes the surface warmer than it otherwise would be.”
“Infrared energy travels through the atmosphere in all directions, yes, but infrared power doesn’t, and their instruments measure power, not energy. The instruments only show energy being transferred (power) from the atmosphere to a liquid-nitrogen-temperature sensor, that happens to be located at the surface, but which has nothing to do with what’s going on at the rest of the Earth’s surface, because the rest of the Earth’s surface is not at liquid-nitrogen temperatures. But you knew that, right? You wouldn’t be trying to pull a bait-and-switch on us, would you?”
IR thermometers measure IR emission.
And
“And I’m not yet buying that you have any clue about the difference between “energy” and “power””
Thanks for the implied insult. Noted.
Power = energy/time (J/s = W)
A simple equation for the experimenters to solve, don’t you think?
And
“One of the authors (Feldman) also lies “We measured radiation in the form of infrared energy”. But that’s not what their instruments do, is it? No, they measure infrared power, which is not the same thing. There is certainly a relationship between the two – but now you’re getting into the realm of assumptions, estimations, calculations, and guesses, not “measurements”.
See above:
Simply divide the measured “power” by the time taken !
Why is taking account of the time of measurement “into the realms of …..”?
“But there is no “downwelling IR power” or “radiative forcing” at Earth’s surface, at normal surface temperatures. No one has ever measured any. The thermodynamics of such a phenomenon would be backward, and contrary to the 2nd Law. Do you know what the 2nd Law says? And what it means?”
That is what a common or garden IR thermometers does within the relation power=energy/time.
“Indeed, since their sensors are closer to the temperature of outer space than the temperature of Earth’s surface, what they are really measuring is how much radiant energy (the rate of transfer of which is denoted as power) would be emitted to space from the atmosphere. “
No, the sensors are situated on the surface, and ergo the IR emission that they measure has travelled to the surface through the atmosphere, as the radiative forcing of GHGs does.
That the sensor is cooled is to exclude external contamination from its surroundings.
It is irrelevant to the emissions received – but necessary for the instrument to work.
“But there is no “downwelling IR power” or “radiative forcing” at Earth’s surface, at normal surface temperatures. No one has ever measured any. The thermodynamics of such a phenomenon would be backward, and contrary to the 2nd Law. Do you know what the 2nd Law says? And what it means?”
And just why does the Earth’s surface temperature preclude radiative forcing from GHGs to not be a thing?
Oh, it took me awhile, so well done, you’ve just being expounding over the mythical 2 LoT contradiction.
It is not contrary at all – the law relates to net transfer. Thermal radiation can and most certainly does travel in both direction up/down. All things are constantly receiving and emitting radiation – it is the net flux that is the 2 LoT. Temperature of the 2 bodies only makes a difference in the power of that radiation.
So yes the surface is radiating more strongly but the colder layers aloft do indeed transfer energy to the surface. They just do NOT WARM it – they slow its cooling, by replacing some of the energy that is emitted by the surface up again.
So in the end after a wordy tome – you give just the usual denial of the long known and proved radiative forcing of the atmosphere’s GHGs.
And don’t turn that back on me, as I merely quote from the textbooks and papers on the subject that the whole of climate science has accumulated starting from before the last century.
That you know better qualifies you as a …. syndrome (You know what) sufferer.
Sorry, dismissed as the usual AGW denier, as I know that constructive discussion with like just goes down deep into the same rabbit-hole.
Anthony, you wrote:
“No, I meant IR emission and for one, Roy Spencer and they do indeed measure IR emission from a clear night sky as he shows …
https://www.drroyspencer.com/2010/08/help-back-radiation-has-invaded-my-backyard/
“The IR thermometer was measuring different strengths of the greenhouse effect, by definition the warming of a surface by downward IR emission by greenhouse gases in the sky”
Roy Spencer is no more of a physicist than you are, and he doesn’t know what “IR emission” means either.
Are you referring to energy, or power? Please specify, because they are very different.
Note that the 2nd law forbids warming of a warmer object by a colder one, and since the atmosphere is colder than the surface, this claim of Spencer’s (and the rest of the AGW crowd) is physically impossible.
Why did Dr. Spencer refuse to allow comments (i.e. corrections) on his posting, do you think?
Your qualifications to discuss measurement science is as pertinent as stevekj’s qualifications. How about it?
Who is discussing “measurement science”. The issue was Sanders assertion that meteorology was not Tony’s strong point. I’d still like to hear Sanders qualifications in meteorology. Or anything.
This is so stupid that it burns my brain. Appeal to authority ( real or fabricated) is number one scientific fallacy. Getting desperate?
Another irrational upside down to experince comment.
Of course appeal to authority is valid.
Do peeps go to college/uni and then say to the lecturer “you are appealing to your authority as an expert in this subject so I wont believe you” !!
The world has progressed on “appeal to authority”.
Newton said “that I have seen so far is because I have stood on the shoulders of giants.
( “the No1 scientific fallacy” eh )!
So a WUWT denizen turns logic and human experince by using a fallacy to “prove” a fallacy.
FFS
He has a title, therefore he must be right.
Really Nick, do you have that little knowledge of basic logic?
Anyone with a need to shove their resume/title into other people’s faces has some serious psychological problems, in my completely unprofessional opinion.
Wow. If true, considering his reply to my posting above, that is disconcerting. I would not have expected a real scientist to propose that joining temperature data sets from two different locations was acceptable if the earlier one could be demonstrated to be a warmer site than the later one. This reveals a distinct and serious personal bias from a meteorologist that now requires a much greater scrutiny of meteorologists in general. Something is wrong, and I thank you for pointing that out.
Well said Len.
If there is one rotten apple… etc…
The phrase Dunning -Kruger comes to mind.
“if the earlier one could be demonstrated to be a warmer site than the later one”
That is a very explicit bias.
The magnitude of which you have no way of measuring, outside of guessing.
Thank you again. Nick. That ‘very explicit bias’ was not stated by me; it came directly from Anthony Banton, when he clearly stated that he understands that two different sites can have different temperature records, while he was arguing that they can be appended.
In fact Lews castle is much more likely to be the warmest of the 2, due it’s surroundings – Stornoway town to the east and a wooded area around the whole of the western side. Especially to the SW, which is where he prevailing wind comes from.
Does a senior meteorologist have any training in measurement technology, determining resolution, precision, and accuracy, evaluating uncertainty, and meeting NIST and ISO requirements for calibration?
Do you?
Can you or he tell us why the uncertainty of the two measurements used to calculate anomalies is thrown away rather than propagating the uncertainty of the parent measurements into the anomaly value?
Tell us why σ²[(X) – (Y)] = σ²(X) + σ²(Y) doesn’t apply to temperatures.
Can you or he tell us the procedure to determine “bias” in a measuring device as defined in the VIM JCGM 200:2008? FYI, NIST documents will tell you.
He definitely doesn’t. A couple of months ago, he argued in a thread that systematic errors can simply be offset by balancing them with opposing error magnitudes from other stations. That’s a classic ‘numbers is numbers’ viewpoint.
The problem is that most systematic “errors” occur in a single direction. The only way to cancel bias is thru calibration.
It the same attitude climate scientists use for averaging model outputs. Somehow averaging wrong answers will give a correct answer.
Global average temperature anyone?
The usual climatology nonsense, to include claiming that calculating an anomaly cancels error.
None of that usual J Gorman stuff is at all relevant to the fact that the 2 Stornaway sites are in anyway systematically different and that it matters a jot anyway.
That explains his manic desire to hide all the data maleficence and shenanigans he and his mates get up to..
Thanks for that information Nick.
It goes a long way to explaining the APPALLING MESS the Met Office currently has with its weather stations.
Explains a lot.
In which case he has absolutely no excuse for being so ignorant.
It doesn’t show well in his comments….., LOL
Someone reported that Banton is/was a BMOC in the UK Met Office. I saw this and immediately thought: “hmmm, a manager”,
In climate science, the results matter more than the method.
Your ignorance and inflated sense of your own knowledge/importance on a subject I spent 32 years professionally in is telling Mr Sanders.
“Location is crucially import even within a few metres. “
No it’s not.
So long as exposure remains the same.
That is checked with pair-wsie observation.
Well this is certainly a stupid statement.
Is the WMO wrong for recommending increased measurement uncertainty intervals for meteorological measurement stations that are poorly sited?
The point is that there are two distinct stations, microclimates, and measuring devices.
The issue is BONDING two separate data streams, especially by ADJUSTING one or both of them. I’ll bet you can’t find another scientific endeavor that allows this for measured scientific measurands.
So where exactly does this “bonding of two separate bonding of 2 separate data streams” cause GW to be invalidated??
And to boot, if they were homologenised you would criticise that.
In a phrase, the MO cannot possibly do any right by you.
Until you can learn and satisfactorily explain the relationship between “energy”, “power”, and “radiation”, you have effectively no business whatsoever talking about “temperature” or any other climate topic either. Please come back after completing a physics degree – this field is obviously way over your head.
Why would I have to “explain the relationship between “energy”, “power”, and “radiation” ?
They are what they are … and meteorology results.
In that I am an expert.
Sorry.
Well, if you want to convince us that you know anything at all about physics, then you would easily be able to explain those concepts and their relationships to each other. Can you?
To put it another way, since you are an expert in meteorology, please stick to what you know and don’t make any nonsensical claims about “downwelling IR”. How does that sound?
What are you an expert in, Steve? What are you qualifications?
Are you back to pulling this rabbit out of your hat so soon? Didn’t work so well the last time you tried this trick.
For one thing, Alan, I can explain what units “energy” should be measured in. Can you?
I can, so what are your qualifications?
Oh the irony.
Well, what is the correct unit then? Please put up or shut up.
Let me know your qualifications first and then we can play your game. Sound fair?
You are committing multiple argumentative fallacies here.
Ad hominem – the implication that only those with the credentials you agree with have credible arguments. Every one else is too ignorant to hold legitimate positions.
Red Herring – this is deflection from the issue to another subject that is immaterial. The credentials one holds is not indicative of what a person can learn beyond academic degrees.
You need to up your game if you wish to make cogent and logical arguments.
Steve says people should only talk about things they have expert qualifications in. Steve won’t share his own qualifications, yet has an awful lot to say. I am making no fallacy here, and there is no other issue at hand except Steve’s desire to quiz people on SI units. To play Steve’s game I need to know his qualifications, otherwise I’d be concerned that he is speaking about issues he has no expertise in, which would make him a hypocrite, and I’d hate that for him.
It’s not “my game”, Alan. I am asking you a simple physics question, which you cannot (or will not, which amounts to the same thing) answer. Why not? How old are you, anyway? 6?
I’m asking you a simple question, which you cannot (or will not) answer. Why not? Why so worried about sharing your qualifications? Why should I answer your simple question when you refuse to answer mine?
Alan, my “qualification” is that I know my physics far better than you do. The proof of that statement is that you have no idea what “energy” means, while I do. It would be easy to disprove my claim, but you won’t, because you can’t. And since the answer to my question involves no more than a 3 second Google search, I conclude that you have an IQ slightly lower than a wheelbarrow. Can you disprove that?
“To put it another way, since you are an expert in meteorology, please stick to what you know and don’t make any nonsensical claims about “downwelling IR”. How does that sound?”
Err, it sounds like exactly what the experts say:
I am one who believes that the experts know more than me and are not either incompetent or fraudsters.
Seems you don’t agree?
Fake Data fraud is what you do, blanton.
You didn’t answer my question. Why did you make a false and uneducated statement in a field you know nothing about, and then call me a Dunning-Kruger case without any evidence to back that up either?
In fact Lews castle is much more likely to be the warmest of the 2, due it’s surroundings – Stornoway town to the east and a wooded area around the whole of the western side. Especially to the SW, which is where he prevailing wind comes from.
Do you realize that you’ve just pointed out why data sets from two different locations can’t be enjoined and thereafter referred to as data from the same location? I neither intended nor stated any bias about which might be warmer and which cooler, simply that joining the two is fundamentally unscientific. It appears you have answered your own question of “So what?”–and very effectively. I express my gratitude.
According to the Met Office both sites still exist.
https://weather.metoffice.gov.uk/forecast/gf77nk9q6#?date=2025-01-01
https://weather.metoffice.gov.uk/forecast/gf77pyn51#?date=2025-01-01
No dopey.
That is a estimated weather forecast for a site that doesn’t exist. !
If you look down the bottom of your link, in “Nearest forecasts”, it is obvious that there is only one
climate[weather] stationThanks, Phil.
Assuming the Lews Castle site is physical and not one of the virtual sites, it should be possible to run a side by side comparison to determine how well they correlate.
The links show a mismatch at 8 am and 11 am.
No. the Lews Castle site no longer exists.
What Phil has linked to is a model based forecast..
It is not real measurements.
Like where I live, the nearest official BoM weather site is about 20km away in a straight line, but they generate a forecast for the town I live in.
It quite useful, but everyone knows it is not real.
That is rather disappointing. Parallel runs can provide extremely valuable information.
That there is a slight difference in exposure is unlikely to result in any sig difference.
The over-riding point is that the prevailing wind is Sw’ly from the Atlantic and over barren land to virtually the same position on the island. The difference in height is negligible as is the wooded area to the SW (if it was even there at the time of Lewis’ readings).
Anthony if you really are claiming location does not matter you are an outright liar. If your claim to being a senior meteorologist at the Met Office is true then you are a disgrace to the profession.
.
“a disgrace to the profession.”
Certainly would help explain the current parlous state of the Met Office weather network !!
I suspect that he is deep into the stupid AGW propaganda nonsense thus will do anything to defend it despite that the AGW conjecture was effectively refuted over 20 years ago.
Where is the “hot spot”, where is the Positive Feedback Loop, where is an actual true change of a climate area on the planet, where is the climate emergency developing.
Zero, Zero, Zero, Zero……
He ignores reality because his head is filled with AGW propaganda.
Banton probably got his promotion precisely because he parrots the approved CAGW line so faithfully. His ignorance of basic metrology and indeed intellectuel integrity is amazing.
The Castle is in fact 4.46 km from the reporting site and 50ft higher
Close enough for government work, as the old saying goes.
History of Lewis and Harris, actually a single island.
Lord Leverhulme negotiated the purchase of the Isle of Lewis (400,000 acres, inhabited by 30,000 people), including the pseudo-Tudor Lews Castle, with Colonel Duncan Matheson between August 1917 and May 1918. The agreed purchase price was £143,000. In 1919 Leverhulme bought the adjoining Isle of Harris (a further 170,000 acres, home to a population of 4,750) for £56,000. South Harris was sold to him by the Earl of Dunmore and North Harris by Sir Samuel Scott. This purchase made him the biggest private landowner in Britain at that time.
The population today are 18000 and 2000.
In 1923 1500 people, mainly young men left Stornoway on the Western Isles for Canada on the SS Metagama. Many others left from Glasgow.
I’ve got no idea what effect depopulation or moving and midernising the weather station have had on temperatures measured on Lewis. But it looks from the picture in this article that the airport has significantly change the local environment.
The Outer Hebrides had their first COP this year, they came up with the same old platitudes,
“The Outer Hebrides are taking a bold step in the fight against climate change…”
“Our islands face unique challenges due to climate change…”
“OH-COP1 will bring together a diverse group of voices to discuss the past, present, and future of climate action across our islands…”
The Hebrides have a long list of real problems that need fixing, climate is not one of them.
A locale like the Hebrides that has been occupied for about 5000 years has seen lots of climate change and folks still lived there. A degree or two up isn’t going hurt them. They have seen it before.
Callanish Standing Stone Circle
Isle of Lewis.
The Calanais Standing Stones were erected between 2900 and 2600 BC – before the main circle at Stonehenge in England. Ritual activity at the site may have continued for 2000 years. The area inside the circle was levelled and the site gradually became covered with peat between 1000 and 500 BC.
Peat cutting around the site in 1857 revealed the true height of the stones. It’s possible that there’s plenty more archaeology sealed beneath the peat that covers much of the Western Isles
5000 years of cold wet virtually buried them in peat.
It’s was the loss of trust in the Met Office’s data and figures that made me buy my own Max & Min thermometer. So l could call them out when their claims to the high temperatures that they have recorded are looking rather suspect.
Sadly the Met Office are now simply part of a unit to spread the climate change/net zero agenda.
I wrote the original source article on Stornoway
https://tallbloke.wordpress.com/2024/12/23/stornoway-airport-wmo-03026-the-met-offices-incredible-forecast-abilities/
It is part of a project to review every Synoptic and Climate reporting weather station in the UK. So far I have written 114 site reports and special topics. There are over 380 stations so only about a quarter way through. The ongoing indexing can be found here.
https://tallbloke.wordpress.com/index-page-surface-stations-project/
The principal issue raised with Stornoway is the recurring theme of bonding data sets from distinctly different climatology often associated with computer modelled data. This review below is a good starting point for understanding this.
https://tallbloke.wordpress.com/2024/12/17/southampton-mayflower-park-dcnn-5642-artificial-unintelligence-spliced-datasets-fake-estimates-disinformation-and-a-1976-record/
Further studies can be found from the index – look up Dungeness, Lowestoft, Braemar, Cawood and Leconfield for further examples of this data corruption/invention.
Station moves are explicitly accounted for in every major surface temperature index. Scientists are well aware that a station move might potentially introduce a bias, but they lack the ability to travel back in time and change that, so they work within the confines of the reality that we all inhabit.
Well if you had actually read my reports you will see that though the Met Office may make that claim the reality is that they demonstrably do not. That is the whole point that you seem to want to overlook in you rather blind faith attitude.
Nowhere in your reports is there any evidence whatsoever that station moves are not accounted for in the major temperature indexes. Can you cite a specific study of yours showing this?
Nowhere in your reports is there any evidence whatsoever that station moves were accounted for in the major temperature indexes.
Can you cite a specific study that they were.?
Assuming you’re asking in earnest from a place of genuine interest, see e.g. Menne and Williams, 2009. This is an issue that has been worked on for decades.
Yep, it is a well refined method for creating spurious warming. !
And we are talking about this specific site..
Failed attempt at diversion, yet again.
so you can’t pony it up, why are you this stupid?
It is NOT bias! It is two distinct and separate sets of measurements. To claim the term “bias” one must ignore the meaning of bias in terms of measurements.
From the VIM, JCGM 200;2012
One can only determine bias by assessing the data from a device as compared to a calibrated device measuring the exact same measurand.
Comparing data from two different devices with their own systematic measurement errors provides no information about the actual bias of either device.
The term “bias” as you are using it simply means different readings from separate devices. That is not bias and you can’t “correct” one in order to bond the two measurement streams by saying one has a bias and the other does not.
You can call it whatever you want, I have little interest in quibbling over semantics. The effect of station moves on climate trends is accounted for by all the major surface temperature indexes. Nothing in Ray’s various works provides any evidence to the contrary.
The fact that you call these semantics is indicative of your lack of knowledge concerning the science of metrology and of making and evaluating scientific measurements.
So the science is settled, is that your answer?
If so, don’t try to tell us that you have sufficient knowledge to discuss the details or to tell people they are wrong. You are just a heckler in the peanut gallery.
It is purely semantics, because the thing we are discussing does not depend on what you choose to call it. A station move can impart a non-climatic signal into a station record, call it a bias or whatever you want. That is what we are talking about. This issue is very well known and understood, with abundant literature on the subject, and is accounted for by every single surface temperature index that uses surface stations.
if you want to argue that this science is not settled, you need to demonstrate that the methods developed to account for station moves are deficient, not that the issue is unknown or deliberately ignored by scientists.
You always were one to condone deliberate data shenanigans to push the AGW-scam.
Either that or you are a mathematical and scientific nincompoop.
The two data sets from the two sites should not have been spliced… period. !!
The point of systematic bias is that you don’t know the magnitude, and can’t know.
But climastrologists are also psychics.
Word Salad, do you work in a greenhouse by any chance.
Do you ever proofread your babbles?
Jim I seriously doubt this AlanJ even knows the difference between meteorology and metrology!
Yep!
Alan, I’m not sure if you’ve seen Pat Frank’s paper from last year, but he discussed the adjustments in his publication. He correctly pointed out that using data from nearby stations can propagate the uncertainties from those stations into the target station. A common issue in climate science is the conflation of precision with accuracy, and this is essentially what homogenization does: it increases statistical precision between stations without improving accuracy.
Homogenization removes non-climatic signals from the network and is thus a de facto improvement to accuracy – it removes systematic error.
That is a load of garbage.
Homogenisation DESTROYS real data.
It is the absolutely opposite of improving accuracy. !
It does not remove error.. it deliberately creates it.
Of course no data is destroyed, and peer reviewed studies show that the homogenization works. But this is WUWT so the standard ill-informed takes must be trotted out on cue. And no one can offer a substantive rebuttal to anything I’ve said, the insults just get more desperate.
Original data is destroyed. period.
Sorry if you are so dumb and ignorant that you cannot see that fact !!
You haven’t said anything except arm-waving BS..
You are one of the most ill-informed trollettes around… and that’s a big accomplishment !.
The raw station data is freely available for download. How is destroyed?
The desperate insults continue. I wonder if you find spending your time that way to be fulfilling.
But when you homogenise, that data no longer exist in the result.
Gees you are THICK !!
Do you find it fulfilling being a idiot ?
Data “being destroyed” implies that it no longer exists. If you simply mean that homogenization yields an analytical result not identical to the raw values, then, yes, that is the point. Any one who wants to do their own analysis can just go get the raw data themselves.
I find my life fulfilling, but I’m not going around being childish on the internet, so I’d like to hear about your experience.
Show us one government web site that is presented to the public as containing the government accepted “official” data that includes a disclaimer saying the data is not the original data. There isn’t one that I could find.
That means you are waffling about what the general public sees as official data.
You mean a citation to the primary source? That is usually included. It’s not clear why you think any other kind of “disclaimer” is warranted. Viewers are told they’re looking at global temperature change, and that is what they are looking at, not point level station records.
Yet those temperatures ARE determined from “point level station records”. The public should know that the data used to calculate what they are seeing has been changed from the original records.
This is a matter of transparency in government and academia. When you hide the fact that data has been changed you are not being transparent.
The public can follow the data source citation, that’s what citations are for. NASA’s GISTEMP website even has a handy data viewer where users can compare raw and adjusted records for individual stations. They can freely download and run the GISTEMP source code. It is impossible to conceive of any way to be more transparent.
And it shows just how rampant the mal-adjustments are..
Cools the past to create FAKE warming in a very large percentage of cases.
Wake up, idiot… They are using the homogenisation routine as a tool to make agenda based adjustments.
“are told they’re looking at global temperature change, and that is what they are looking at”
NO, they are looking at agenda corrupted and fabricated once-were-data outputs of a manic mal-adjustment process.
It is NOT REMOTELY REAL.
So you admit that homogenisation makes the real data redundant by replacing it, in what goes into the final fantasy fabrication, with “adjusted/faked” data..
OK.. we can agree on that.
You just LOVE your FAKED data, don’t you !
Peer-reviewed studies don’t account for systematic measurement error. Not one of them (except this one).
Bullshit. It does no such thing — climastrologers live in a fantasy world of their own making.
Data contaminated with systematic measurement error behaves just like good data. It will pass every single statistical test.
Homogenization removes step-glitches, adjusts for station moves and detects missing data. It doesn’t remove systematic measurement error at all.
Homogenization removes systematic bias, but is not the only procedure for addressing non-climate influence in the station network, nor is it assumed to be perfect.
And always, we don’t know what we don’t know, so the possibility of some totally unknown systematic issue imparting substantial non-climate bias into the network is always there – that’s the nature of science. So we keep working to improve our methodologies. The potential of new information to overturn old is not a paralytic.
Still more bullshit.
Whatever adjustment factors you Fake Data fraudsters come up with and apply only increase uncertainty.
That is a load of absolute twaddle !
Basically just manic arm-waving !
You need to show a reference for this assertion. You cannot simply say this without showing the authority you are using. Anonymous Sources don’t work in an argument. I’ve looked a lot and can find no experimental verification of your assertion. You supply one.
Lest you think I have no sources. Let’s start with this site.
https://www.isobudgets.com/sources-of-uncertainty-in-measurement/#bias
Go to Section 5 – Bias
From the VIM:
Please note “replicate” indication in 4.20. That is, several measurements of the same thing averaged. That lets out determining bias using different stations.
The web site goes on in Section 5.
Why is this important? Uncertainties ADD – ALWAYS. Uncertainty never gets smaller it always increases. Any assertion that uncertainty cancels is not familiar with the science of metrology!
See Menne and Williams, 2009. The approach is shown to be effective on real and simulated datasets. Your criticism is devoid of an awareness of the thing actually being done.
I have read it. It does not use real data from measurements and verify the accuracy.
I’ll challenge you as I have others with the same picture.
See the pink dot. Use an homogenization algorithm and tell the temperature under the dot.
Homogenization addresses trend disparities in temperature series. What you’re describing is incoherent.
If you want to raise challenges like this it would behoove you to demonstrate a stronger grasp of what we are talking about.
Homogenisation INVENTS spurious adjustments that have no rhyme or reason behind them.
There have been articles showing that even the same data is randomly adjusted every time it is mal-homogenised.
You have ZERO grasp on anything subject matter you yap about.
Oh look Alan The Gaslighter ran away from the challenge.
Not a surprise.
Your answer is about what I expected. You have no scientific basis for making an estimate and you don’t want to look foolish by making a wrong GUESS!
If you can’t walk the talk, don’t denigrate the people who pose questions you can’t answer. Instead, ask yourself why you can’t answer the question.
The systematic measurement error is invisible in real data sets. The data look and behave like good data. But they’re not good data. The error can be neither detected nor removed.
Discussed extensively here.
We aren’t trying to understand the absolute temperature at a point in time, we are trying to understand temperature change over time. Systematic error that yields a constant offset is irrelevant to this estimation. Systematic errors that introduce a spurious trend are addressed via the adjustments we’ve been discussing.
More of the usual climastrology garbage about “systematic error”.
Your adjustments increase uncertainty.
Error is not uncertainty.
But as a practitioner of the liberal art of climastrology, you are unable to understand this.
Wow, this is by far the best reply I’ve seen from you, AlanJ! Thanks for exposing the flawed thinking behind AGW!
If we’re trying to understand and predict physical changes in a specific region, don’t we need accurate temperature readings?
You AGW proponents keep stressing that even a tenth of a degree change is important, but then hold the position that the accuracy of the baseline temperature doesn’t matter? WTF kind of pseudoscience is that?
The thing being determined is the anomaly. Constant offset errors in the absolute temperature value are not present in the anomaly, and thus not relevant.
You’re completely wrong: the anomaly inherits the error.
It does not if the error is constant between successive measurements. If the error is time varying then it will yield a trend disparity in the anomalies, and this is what the adjustments address.
A constant error is still an error, right? Even if it doesn’t create a “trend disparity,” the recorded numbers still don’t accurately reflect physical reality. So, how can you know what’s actually happening in a given region? All you have are meaningless numbers, hence the ‘numbers is numbers’ meme for climate science.
It’s pretty easy to demonstrate this to yourself by setting up a case where the information is known perfectly and examining what happens when a systematic error is introduced. Here is a case where each observation has a systematic measurement error of 1 degree:
The error is not transferred to the anomaly because it is an error in the absolute magnitude of the observations, not in how different the observations are to one another, which is the information of interest.
Yes, I have done this exercise before in Excel. When the baseline mean is offset, the anomalies also becomes offset. You’re essentially proving that systematic errors can behave just like valid data.
Wouldn’t a 3-degree positive anomaly from a baseline average temperature of 15.6°F presumably represent a different physical change in the real world compared to a baseline of 14.6°F?
To argue otherwise would be illogical, because it undermines the claim that every tenth of a degree increase matters.
If your baseline is physically inaccurate, then you wouldn’t have any reliable sense of what’s actually happening.
That’s the essence of systematic error: a deviation from the true state of reality.
Of course, but the difference is not something you can evaluate just by looking at temperature to begin with, even if you had perfect measurements. The temperature alone just… tells you how many degrees the temperature has changed relative to the climatology during the baseline period.
(boldface mine)
How can these numbers tell you how much the temperature has changed relative to climatology if they’re physically inaccurate to begin with?
Last I checked, temperature and climate are real, physical phenomena. Yet your responses keep implying that climate alarmism is nothing more than a product of statistical manipulation and fraud.
I just demonstrated that above. The inaccuracy is in the absolute magnitude of the temperature, not in how different a temperature and the baseline mean (with the same inaccuracy in their absolute magnitudes) are from each other.
Since the thing we care about is the trend, we don’t care about the accuracy of the absolute temperatures. Things that affect the trend we do care about, and scientists develop adjustments to account for those.
And you (along with the unnamed “scientists”) remain 1000% wrong.
This is the mantra of the trendology ruler monkeys.
But you can’t articulate what I’m wrong about, or why, just heckle from the sidelines.
Wrong (as usual): I’ve stated multiple times how your Fake Data “adjustments” are invalid, and cannot remove “error” as you so fervently desire.
/plonk/
h/t karlomonte
And how do you that errors don’t drift with time?
YOU DON’T.
No, it tells you how much above the baseline it is. The temperatures during the baseline period have their own uncertainties & errors, which have to be added to the uncertainties during the period of interest.
The potted summary is that the offset is treated as a constant, and the average anomaly during the baseline period is 0.0 degrees A(nomaly) +/- uncertainty.
The usual climatology BULLSHIT.
Bullshit is all you got, you and your hero Mann the Mannipulator.
Explain please how hundreds of different measurements conveniently have exactly the same value of “error”.
Explain please how you know “error” does not vary with time.
You are completely wrong, the error affects the mean, which is subtracted.
Your “numbers are just numbers” mindset is showing, Nick. You can’t simply say that the error is subtracted from the mean when you don’t even know the size of the error to begin with.
The process of averaging temperature measurements to create a baseline and then subtracting monthly averages from the mean to calculate deviations increases the precision between two independent stations. This is why, as Pat mentioned earlier in his response to AlanJ, data corrupted by systematic errors can behave just like valid data and pass every statistical quality check before being archived at NOAA.
“ when you don’t even know the size of the error to begin with. “
Systematic error affects all the readings equally. That is why it is called systematic. So it appears in the mean and disappears on subtraction of the mean. It also disappears on formation of a trend.
No, systematic error can change over time, as karlomonte pointed out.
Even if the error were constant, it wouldn’t vanish. In fact, your colleague AlanJ demonstrated this himself.
Looking at Alan’s table and hypothetically extrapolating those numbers to the real world, you’d find that the actual baseline would be 14.6°F, not 15.6°F. Similarly, the true deviation would be 18°F instead of 19°F.
And now Stokes doubles down on the bullshit.
The mean of a monthly average random variable is subtracted by the mean of the baseline average random variable. Both of those random variables also have variance. Variances ADD when subtracting or adding the means.
That means the anomaly inherits the uncertainty, including the systematic errors, of BOTH parent random variables.
The means of both the monthly average and the baseline can be equal and cancel to 0. Does that indicate the error has canceled also? Not hardly.
The difference in temperature of the 2 periods inherits both uncertainties, but the offset must be treated as a constant. Each anomaly only has its own uncertainty.
I agree with you and Alan on this.
Provided the offset is constant, it doesn’t have any effect on the differences between readings taken with the same instrument.
Which you cannot know is the case or not.
Uncertainty is a limit to knowledge, you cannot increase knowledge with averaging and subtraction.
Like 273.15K?
And now Stokes the genius doubles down on the climatology stupidity.
He refuses to understand.
They just come back and repeat the same points as if they hadn’t already been thoroughly eviscerated in previous threads.
Walter:
Being “thoroughly eviscerated” by dint of overwhelming superiority of numbers here, is not in any way a valid conclusion
.
If you think so then I reject that opinion vigorously. This blog is clearly one where the vast majority of denizens are deniers of anthro climate induced change.
Turkeys don’t vote for Xmas.
They just don’t.
Their psychology simply rejects the data reflexively.
When this comes up I find it most amusing, that you and any others think this place either impartial or knowledgeable on the subject and the echoes on here speak loudly to that fact.
“They just come back and repeat the same points”
The usual hypocrisy: Mostly untrue and to boot, so you and others dont?
Hahaha, your repeated attempts to denigrate this website and its members as an ‘echo chamber’ of deniers are starting to feel a bit tired.
It’s becoming clear that this is a go-to line you rely on in nearly every reply.
Strong arguments don’t need to lean so heavily on such tactics. When people are confident in their points, they don’t need to repeatedly undermine the credibility of others to make their case.
“Hahaha, your repeated attempts to denigrate this website and its members as an ‘echo chamber’ of deniers are starting to feel a bit tired.”
Oh don’t be ridiculous – of course it is.
And so don’t give me so many reasons (such as that stupid illogic) to say so.
Any contentious post is pounced on (or red numbered) with the attack-dogs in first.
So your brilliant conclusion that it is impartial and therefore proves that *we* have been “thoroughly eviscerated” is laughable.
blanton whining again that he doesn’t get the respect his huge hat size thinks he deserves.
You and your alarmist comrades have repeatedly lost every debate about metrology on WUWT, at least from what I’ve seen over the years.
They treat measurements as simple numbers that can be arbitrarily manipulated in spreadsheets, justifying this approach either through a lack of proper understanding or by intentionally misrepresenting fundamental metrology principles outlined in authoritative texts.
From my perspective, the former can be excused, but those who engage in the latter deserve to be attacked or, as you put it, ‘red-thumbed.’
Break-point detection is a great idea, but adjustments aren’t.
Menne and Williams 2009 only covers step changes and step+trend changes. The detection success rate is reasonable, but the false positive rate is rather high. This may have subsequently improved.
The correct approach is to spawn off a new series at a detected step change (at a minimum, the intercept has changed) rather than adjust either series up or down. This is doubly important given that adjusting the false positives will skew the slope.
The shorter series may introduce some difficulties for hypothesis testing, but that is far preferable to corrupting data series through adjustments
I don’t see how your proposed method is any different. Splitting the one series into two at a breakpoint and aligning the two new series or adjusting the series at the breakpoint is the same thing. If it helps to use that as your mental model for visualizing the procedure then I suppose that is probably useful conceptually.
They’re different data series with different properties. It is what it is.
It certainly warrants investigation, if possible.
It doesn’t warrant automatically adjusting one or both to splice them together.
The further investigation may show some factor which warrants re-baselining one or both of the series, but that will be on a case by case basis.
That is particularly the case where the false positive rate is high.
The issue is adjusting recorded data without any calibration data to show that the previous recorded data is incorrect.
What you are suggesting is that all physical science disciplines should be ok with returning to all points in the past and updating experimental data in order to bond it with current measurements thereby creating “long records”. Do you agree that is ok?
This discussion is way off beam. The page Sanders is talking about is a history page. It gives the raw temperatures at a number of long running sites. That page is not used for trend estimation, or UK or global temperature. It is just a record.
It doesn’t matter whether it’s used for trend estimation or UK or global temperatures or not. If there is a material change, it should be treated as a new data series.
In any case, the off topic digressions are part of the charm 🙂
Exactly! Well said.
When I bought a new THD meter, I didn’t get to go back and change old measurements to reflect what the new meter might have shown. I couldn’t send customers revised spec sheets showing better measurements based upon creating revised test results.
Revising past data at a station without actual calibration information is simply creating information out of nothing. Trying to justify it is using the old adage that the end justifies the means.
The question is not is the “page” being used, rather is the DATA on that page being used for climate science determination of local, regional, or global temperature trending.
Well, is it? Any evidence?
Yes, thanks for the reality check, Nick. The original point, now lost to the sands of time, is simply that station moves are accounted for when a temperature record is used in a climate analysis. Station moves are not hidden or obscured for some nefarious purpose – the historic records are simply archived as they were taken.
More trying to paper over the crap that climatology uses instead of real metrology.
Your lack of education in measurements is standing out in the open. You don’t even know what you don’t know. I’m sure you are quoting some things you have read in papers from climate scientists but I assure you they have no training in measurements either.
Here is a section from Experimentation and Uncertainty Analysis for Engineers.
If we want to make a statement about the value of X based on our measurements, about the best we are able to do is to say that we a C% confident that the true value of X lis within the interval
X_best ±U_X
Uncertainty is stated in terms of standard deviations. Systematic errors can be calculated and specified as a standard deviation. Combined uncertainty is calculated by ADDING all uncertainty components together. That is how the value of U_X is determined.
The basis for all this is that measurements form a probability distribution. A probability distribution has both a mean value and a variance. Monthly averages are random variable that have a probability distribution. Monthly averages have a combined uncertainty value derived from the variance of the probability distribution.
This allows a functional relationship like f(x) = X – Y to be used and its uncertainty calculated using the common statistical formula of
Var(X – Y) = Var X – Var Y
If X = Monthly Avg and Y = Baseline Avg, and
Var(X) = U_X and Var(Y) = U_Y, then
Anomaly = X – Y, and
Var_anomaly = Var(X) + Var(Y)
As you can see, the uncertainty (U) does not cancel, it is additive.
You should have learned this in any introductory metrology course and any advanced physical science lab in physics or chemistry.
Investigate NIST TN 1900 Example 2 for brief explanation of how to calculate one portion of a measurement uncertainty value for a monthly Tmax average.
Then you can show us your calculations about how these uncertainty values can be propagated into a global value of uncertainty.
Before someone jumps in, I should say my math above is missing some squares and square roots. But, the general idea is valid. The errors come from typing too quickly late at night.
Var(X) = U_X and Var(Y) = U_Y
should be,
Var(X) = (U_X)² and Var(Y) = (U_Y)²
Yeah, but when converting from the Celsius or Kelvin temperature to “anomaly” or vice versa, the baseline average offset should be regarded as a constant, just like the 273.15K offset when converting between Celsius and Kelvin. This is required for reversibility.
Whether or not this is done is a different matter…
The moment you average different anomalies, either from different stations or of different months, you are dealing with different baseline means and uncertainties. It is one of the reasons, climate science can not provide an “absolute temperature” that corresponds with the calculated anomaly. All they can do is give you a global average temperature that has been calculated from monthly average temperatures using all the stations. It can not be reversed calculated from the ΔGAT, i.e., the anomaly.
That’s one of the information losses of averaging.
The absolute temperatures can be calculated from the individual site data series. People may not want to, but it can be done.
This is getting away from the uncertainty of an individual anomaly, however.
You’re talking about how to estimate uncertainty, I’m talking about the effect of systematic error on the trend. Imagine that you have perfect information. The systematic error is known exactly, there is no random error. There is no uncertainty. We want to know if the perfectly-known systematic error will affect the observed long term trend.
If the systematic error is constant, it will not. If there is time varying error, say changes in instrumentation, this might introduce a spurious trend.
Fool! It must be included.
Fool! You don’t know if this is true or not.
Again, are you really this dense (to include your mate Nit Pick).
Systematic error IS NOT known exactly! Where did you ever learn that? Give us a reference from metrology that states that. Remember, we are not dealing with some introductory statistics book that supplies a constant, we are dealing with field measurements taken by instruments of quality.
Did you examine the NIST TN 1900 Example 2? Show us a reference that shows the subtraction of two means cancels the uncertainty which includes a factor for systematic error (or bias if you wish).
Did you not read what I quoted from an accepted text on uncertainty?
Do I need to give you more references?
It is in imaginationland, where I asked you to go for this thought experiment. Again, we are not talking about estimating uncertainty – which is properly achieved using probabilistic techniques for GMST estimates, but about the effect of systematic error on the anomaly and trend.
If the anomaly is defined as Anomaly = X – Y, where X is the monthly mean temperature and Y is the mean temperature for the month over the baseline period, constant systematic measurement error is subtracted out because it affects both terms equally.
More of the same bullshit, you have no way of knowing this is true or not.
My reference:
Can you read the bolded words? Do you see that word “systematic” in bold?
I WILL CAPITALIZE THIS FOR YOUR UNDERSTANDING. SYSTEMATIC ERROR IS INCLUDED IN THE UNCERTAINTY OF A MEASUREMENT.
“X” and “Y” are not simple numbers as you apparently presume. They are random variables each with a mean and uncertainty value.
When you subtract the means of two random variables, the variances of those random variables are added. By definition, the systematic portion of the variance IS ALSO ADDED. THE SYSTEMATIC UNCERTAINTY DOES NOT CANCEL!
I’ve already posted a web site with good ISO references on uncertainty. https://www.isobudgets.com/sources-of-uncertainty-in-measurement/#bias
This page discusses “bias” as one element of systematic errors and how to convert it to a standard deviation for inclusion in a combined uncertainty, generally by dividing the expanded bias uncertainty by √3.
You keep spouting stuff like you know what you are talking about about. GIVE US SOME REFERENCES WHERE YOU LEARNED THESE FACTS YOU ASSERT. Otherwise you are blowing smoke.
Again, we are not talking about estimating uncertainty – which is properly achieved using probabilistic techniques for GMST estimates, but about the effect of systematic error on the anomaly and trend.
You are so doggedly determined to make every single conversation you participate in about the nuances of error propagation that you can’t comprehend the thought that people might be talking about anything else. You don’t even reply directly to anything I say, just quote me and then start ranting about basic error propagation technique, as though I’ve ever come out against it.
The facts I’m relaying are self-evident, if you take a moment to read and think about what I’m saying instead of steamrolling over it. You are the epitome of the person who “waits for their turn to talk” in every conversation instead of actively listening.
To be fair, systematic error can be assumed to remain constant within a limited measurement range and time frame for an individual instrument.
When calculating differences between measurements, the systematic error cancels out.
Needless to say, there are caveats on this, particularly percentage systematic errors (e.g. thermal expansion), but it’s still fairly close.
If I forgot to zero my micrometer and it’s 0.002″ out, the difference between readings of 0.901″ and 0.797″ is still 0.104″.
No it can’t, all you can do is estimate limits for the size of the effects.
Sorry, this is bullshit, exactly what stokes, alan, blanton etc. claim.
How do you know a true value?
That’s why I constrained it. If it changes that quickly over a small range, it’s hardly systematic, is it?
Within the constraints, it’s regarded as a fixed value or a set proportion of the measurement.
You don’t but you don’t care. 1.901″ – 1.797″ gives the same value as 1.899″ – 1.795″.
If all I care about is removing 0.104″ from the diameter of a shaft, all that matters is the difference.
If I care about the diameter of the final product, you can be sure that systematic and random error do concern me, and I’ll use a calibrated instrument which I’ve cross-checked at both ends of its range.
I said nothing about a time period — but a Type B uncertainty interval can be constructed to span an expected interval regardless.
Don’t confuse calibration with systematic uncertainty in a measurement, and don’t confuse error with uncertainty.
No, but it was one of the constraints I stipulated.
Shouldn’t any systematic uncertainty be part of the general uncertainty covered by the calibration?
That’s why the example had me screwing up with a micrometer which wasn’t correctly zeroed.
Calibration is typically a comparison against a reference, and yes, a calibration lab should provide an expanded uncertainty for the calibration value.
This is different from using a calibrated instrument for a measurement; the uncertainty of the calibration is propagated into the final uncertainty for the measurement result.
That’s your field. My limited exposure is that at its simplest the instrument should read to within the specified accuracy and precision figures. There are potentially additional correction tables.
A summary of what is really involved would be quite interesting.
I pretty much had that. As I understand it, as a general rule the resolution bounds usually cover the calibration uncertainty range.
That is part of the issue. A single monthly average has 30 days of data of various readings taken under reproducibility conditions (changed conditions). You have no good way to define what systematic uncertainty is due to the changing conditions. The baseline average has 30 years of data. The systematic uncertainty in this average is likely much much larger and certainly not determinable.
The analysis of the entire anomaly average is also an issue which is never addressed by the climate science folks here.
Yeah, averaging values from a non-stationary series of averages from non-stationary series is always such a good idea 🙂
Leaving that aside, if that average is to be used as an offset, it should be treated as a constant. It’s just an offset, like 273.15K.
The uncertainty during that baseline period needs to be unchanged whether it’s denominated in Kelvin, Celsius or local Anomaly. So should any other period.
I’m not sure what you are getting at.
The uncertainty for each station and each month can be different.
That was poorly expressed on my part, then.
hat I meant was that any particular uncertainty should be the same whether expressed in Kelvin, degrees C or degrees Anomaly.
Same but different — 273.15 is a constant established international agreement with zero uncertainty. The baseline average for the UAH for example most definitely has a non-zero uncertainty.
Yes, it does, and that’s why the stated value of the average has to be treated as a constant to be useful as an offset.
For example, if the baseline average is 15.1 degrees C +/- 1.8 degrees C, the corresponding anomaly value is (15.1 +/- 1.8) – 15.1, or 0.0 +/- 1.8.
Converting back to Celsius gives (0.0 +/- 1.8) + 15.1, which is the original 15.1 +/- 1.8.
If the offset isn’t treated as a constant, uncertainty is added every time a temperature is converted from anomaly to Celsius or Kelvin, and vice versa.
If you have a micrometer that has a calibrated uncertainty budget associated with it, there will be a combined uncertainty value associated with it. Remember, a zero error is not the only systematic uncertainty you will have when making measurements. In your micrometer things like temperature, gear lash, frame flex, spring or finger pressure, etc. can have systematic effects.
The difference between measurements is not the issue. In your example (where I’ll assume a +0.002) the two measurements should be (0.901 – 0.002 = 0.899) and (0.797 – 0.002 = 0.795). These give a difference of (0.899 – 0.795) = 0.104.
Remember, my point is not about the value of (X – Y). It is about the uncertainty in the measured values. Let’s assume the expanded bias is 0.002 and the standard uncertainty is then (0.002 / √3 = 0.001). (https://www.isobudgets.com/sources-of-uncertainty-in-measurement/#bias). Then by standard statistical theory:
Var(X – Y) = Var(X) + Var(Y)
σ(X – Y) = √(0.001² + 0.001²)
σ(X – Y) = √(0.000002) = 0.0014
This is a small increase, but indicates that uncertainties add and don’t cancel. The measurement of the difference is 0.104 ±0.001 — no cancelation.
Temperatures have a much larger measurement uncertainty. For example NIST TN 1900 Ex. 2 ends up with an 95%CI of ±1.8°C for the monthly average. Assuming the baseline average is similar, with Tmonth = Tbase = 20°C, then
X – Y = 0
σ(X – Y) = √(1.8² + 1.8²) = 2.5
0 ±2.5°C
You’re over-complicating it (or I over-simplified it, or both).
What we care about here is the difference between the measurements. In this particular case, the offset is known. The difference between the offset readings is the same as the difference between the zeroed readings. That would still apply if the offset was an unknown constant.
The key point is that the offset is a constant, so subtracts out of the difference.
Uncertainties just muddy the waters.
In practice, each of the readings will have a measurement uncertainty of at least the resolution bounds, and those do add.
What it if isn’t a constant? Outside of a special case, in general you can’t assume equal systematic uncertainty for both measurements.
Uncertainty is a metric for the limit of knowledge about the results of a measurement. The waters are already muddied when the measurements are performed.
So do combined uncertainties add via RSS when subtraction is performed. The AGW jockeys will never understand this.
True, but I think the usual repeatability conditions meet the requirements for that special case.
Different instruments measuring different samples over a period of years are getting more than a little dodgy.
True, but it muddies the waters regarding the differences between readings where an offset is involved.
and as far as I can determine, resolution limit uncertainties add by simple addition and provide a lower bound.
I get the same value, just from adding the resolution bounds.
The paper reports a 67% hit rate, and a 6% to 20% false positive rate.
The adjustments do decrease the RMSE of the slope, which s hardly surprising when the curve is shifted up or down at the breakpoint.
The systematic issue known since the 19th century is the measurement error of LiGs in naturally ventilated shelters due to irradiance and insufficient wind speed.
Those errors are of unknown magnitude and sign. They are invisible to statistical tests and cannot be removed.
Gawad what a stupid LIE!
He does this a lot. And when his lies are exposed, he repeats them.
Wrong.
Thanks, Walter. You’re exactly right.
“I have little interest in quibbling over semantics”
Yet its all you ever do !!
In science, the precision of language, definitions especially, is critical.
You are disqualified from any physics-related conversation, Alan, until you can satisfactorily explain the relationship between “energy”, “power”, and “radiation”. Ready… set… go!
Steve, if those are concepts you’re struggling with, I’m happy to help you understand, but they have no relevance to the current discussion topic.
No, Alan, I am not the one who is struggling. These are fundamental physics concepts that you have failed to grasp, as you demonstrated earlier, and therefore this physics-based discussion is not one you are qualified to participate in.
If you have a comment germane to the present discussion, I’m happy to engage. A competent counter argument is a more productive way of illustrating a flaw in my position than what you’re currently doing.
Alan, the flaw in your position remains from before, when you ran away from my physics lesson after running out of stupid things to say: what unit do you think “energy” should be denoted in? This is germane to the current discussion, which is about temperature, a form of energy. If you don’t know what “energy” means, then, as I said, this discussion is not for you.
Absolutely pointless until you learn some real metrology, not the bullshit pushed by the AGW shills and hoaxters.
All AlanJ is happy to do is run around flapping his arms.
Science.. not in his remit !
Your position is flawed from the very ground up.
You can’t even show any empirical evidence that atmospheric CO2 causes warming
A complete FAILURE from step zero !
Did you get a call from Stokes to show up?
In other words, it doesn’t matter how bad the data is, if it can be made to support the CO2 myth, it will be used.
Human beings are apparently being crudely divided into two groups, one which diligently follows professional practice and will tell the truth even if and when their funding dries up, and the other who simply cannot wait to rake in all that extra cash telling falsehoods brings.
We can only guess what camp Stokes is in.
Nick is in the camp of common sense and the established science, egged on by misinformation and pseudo-science fuelled by paranioa and DK syndrome,.
As am I.
That it is not seen here is taken as a given.
A phrase from the film “Carry on Cleo” comes to mind ….
“Infamy, infamy – they’ve all got it in for me”.
Nick is in the camp of trying to protect the lies, fallacies, misinformation and non-science of the AGW scam.
He, like you, FAILS TOTALLY, just drawing more light to the fakery.
You and he are paranoid about your part in perpetuating the scam being exposed.
And it has been, by your continued condoning of deliberate data corruption.
The newly invented Stevenson Screen wasn’t adopted by the UK until some time after 1884 FFS!
Being the age of steam it would probably have taken another 50 years before it was meaningfully used by other scientifically sophisticated nations, that principally being the colonies of the British Empire.
“The modifications by Edward Mawley of the Royal Meteorological Society in 1884 included a double roof, a floor with slanted boards, and a modification of the double louvers. This design was adopted by the British Meteorological Office and eventually other national services, such as Canada. The national services developed their own variations, such as the single-louvered Cotton Region design in the United States.” (Wikipedia)
The idea we have an accurate record of temperatures, diligently recorded by dedicated scientists across the world since 1850 is sheer nonsense. The contiguous record is know to be littered with omissions and errors, many of them likely recorded by the office junior, sent out in the rain, snow and blistering sunshine when the responsible scientist (were there such a thing) was schmoozing with local dignitaries.
We don’t have a climate crisis, we have a technology crisis. Strange how improvements in observation and detection methods have been coincident with ‘rising temperatures’, now determined down to 1/100th of a °C when in 1884 judging the temperature displayed by a mercury thermometer in the dark, whilst it’s raining/snowing/windy etc. could barely have been accomplished to within 0.5°C.
When it comes to recording a mercury thermometer in the dark, rain and wind.
I have been there and done it, as l kept my own weather record between 1979 to 1982.
You are correct when you say there is no way that you could get a reading down to a 1/100th of a C. The best you could hope for is to be within a 0.2/0.3 of a C.
Yes I covered that as well with the aid of details from a Met Office observer.
https://tallbloke.wordpress.com/2024/12/31/is-the-meteorological-offices-metrology-as-good-as-they-claim/
There are actually idiots at the Met Office quoting me readings to the 5th decimal place!!!
Significant digit rules are routinely ignored by climatology (to include some very big names).
The JCGM Guide to the expression of uncertainty in measurement (AKA the GUM) is the international standard that covers questions of calibration, measurement, and data reporting. It has multiple examples for temperature measurement. The term “uncertainty” is preferred over “accuracy” (the GUM provides formal definitions for both).
Another common mistake make by climatology is to confuse uncertainty with error: they are two very different beasts.
I strongly suspect AnalJ, Stokes, Banton and the others are merely computer jockeys and have never in their lives actually measured temperatures with their own hands.
Mr Cat:
I was employed by The UK MetO for 32 years 11 years being an assistant to on-the-bench forecasters at RAF stations and then after study became an on-the-bench forecaster myself for a further 21 years.
Both those tasks required required me to take hourly observations of all parameters of the weather.
I have opened a stevenson screen door and read a thermometer more times than you have had hot dinners.
And look at the abysmal mess the Met sites are in now.
You shouldn’t brag about such a farcical situation.
Makes you look incredibly STUPID and INEPT !!
How is it that you have no knowledge of basic measurement uncertainty, dr. dunning-kruger?
If that’s even remotely true, you should already know that it is essentially Impossible to read an LIG thermometer to better than +- 0.2 degrees Celsius.
I would concede +/- 0.1C in my experience.
But the +/- is important.
Random error would result in zero sum on average.
blanton displays his ignorance of metrology, again.
Go read the GUM, fool.
In other words you have pretty minimal “Observers” qualifications which are basically how to read an instruments. Glorified meter reader in other words.
Contrarians: “Bet these guys have never measured temperatures with their own hands.”
Anthony: “I’ve literally spent a career measuring temperatures with my own hands.”
Contrarians: “Hah! Just some meter monkey who reads temperatures with his own hands like a nerd.”
It’s such a fascinating glimpse into the strange depths of the human psyche here. Ya’ll are weird.
What are your qualifications in metrology and measurement uncertainty?
Both you and blanton have demonstrated no understanding of this vital subject.
I’ll show you mine if you show me yours.
I have an ISO 17025 training certificate, and was the technical manager for an A2LA accredited national-level calibration laboratory. Among many other things, this requires writing and maintaining the format uncertainty analyses that are required for accreditation.
Oh look, Alan the Gaslighter-Bullshitter ran away from his own challenge.
Not much of a surprise, as his only qualification is regurgitating the AGW PANIC party line.
Try reading my posts re my qualifications.
And just what are your “qualifications” Mr Sanders?
Yet you display little knowledge about analyzing those readings. Most of those here, that you call deniers, are trained and educated in using measurements to perform a purpose in design, manufacturing, and operation of devices. Commercial and legal requirements assured strict accountability for improper and incorrect use of measurements.
“Yet you display little knowledge about analyzing those readings.”
I don’t need to analyze those readings.
In my job as a meteorological forecaster I had enough on my plate analyzing the entirety of weather data, and then informing the customer, whether it be the RAF or some company/media.
Again it this assumption that the only thing that matters is the exactness of the data (just surface temperature), and it’s supposed abuse by the MetO for climate change attribution.
No.
The principle purpose of the MetO is to serve the UK public, who largely pay the it.
By providing timely and accurate (as the science allows) and warnings.
That is the process I was a part of.
It certainly had nothing to do with real-world metrology.
More gaslighting with your supposed awesome resume.
Hi Hot Scot, totally agree, I sort of covered those issues in reviewing Cambridge Botanic Gardens.
https://tallbloke.wordpress.com/2024/09/19/cambridge-university-botanic-gardens-dcnn-3253-double-standards/
A while back, I came across a paper that found only four stations in Argentina had a long continuous record (and one only since the 40s). All showed a cooling trend of 2-0.5°C per century. Someone debunked me by showing me that there were 77 stations in Argentina according to BEST. Many were AP going back to the 19th C. Strange how the four real records showed cooling and the corrected Frankenstein ones showed warming.
Tony Heller has shown the same thing with temperature series in the Continental US.
Where l think there is a major issue with the long term temperature record is in the switch over from LIG readings to digital readings.
My own research has shown that digital thermometers are subjected to more fluctuations in their readings then LIG thermometers are. Because due to their higher sensitivity they pick up spikes in temperature that LIG thermometers would not record.
So l think the increase seen in the warming tread since around 1980, is in a large part due to this switch over of recording temperatures.
Ah, LIG to digital – another common fantasy here …
https://rankexploits.com/musings/2010/a-cooling-bias-due-to-mmts/
“Since the deployment of MMTS sensors, various groups have been tracking the differences in observed temps between the new devices and the old LiG/CRS sensors. Quayle et al (1991) examined various sites around the country and found that MMTS sensor introduction led to a cooling of the maximum temps by around 0.4 C and a warming of minimum temps of around 0.3 C. Similar results on a smaller scale were found by Blackburn 1993, Wendland 1993, and Doesken et al. 1995. A more recent paper by Hubbard and Lin 2006 found a 0.52 C cooling bias for maximum temperatures and a 0.37 C warming bias for minimum temperature.”
With the research l did earlier this year there is certainly a issue with digital thermometers running warm during winter daylight hours when compared to LiG thermometers. Only during cold clear nights did digital thermometers have a tendency to run cool. While during summertime the difference was mainly during dawn and dusk and max temps.
This has lead me to believe that where there is a issue with digital thermometers due to their higher sensitivity, is when the sun is at a low angle in the sky. As this is when the sun shines more directly into the screen containing the thermometer. Which due to the digital thermometers been more sensitive can cause them to record warm during winter days and also to record warming earlier just after sunrise and later at sunset then LIG thermometers.
Time constant differences are quite important, they try to get around them with averaging gyrations.
There is quantization errors (due to sampling).
The Quayle et al paper is interesting reading.
Oh, my goodness gracious me 🙁
You should read studies closer. Here is some info from Hubbard & Lin 2004, Journal of Atmospheric and Oceanic Technology · October 2004
This study used the USCRN temperature stations as a reference which is what they were designed for.
This tells you that the microclimate is very important and that wind speed is critical. A possible bias of 1°C is not small when trying to convince folks that you know temperature to one-thousandths of a degree.
In fact this study says the following:
Like it or not, CRN shows various bias in both LIG and MMTS station records. Wind speed and solar data is critical in determining the possible biases. If you examine WMO siting criteria, solar exposure and prevailing winds are have exacting specifications.
As a meteorologist you should be familiar with all this.
So some unknown wacko hears something, does little or no investigation, invents a conspiracy theory, and gets published on wuwt without his article being fact checked. This is the typical quality of reporting found on wuwt.
You really should read all the comments before posting and putting your foot in your mouth.
I read the comments.. They support and amplify what I said. The article’s author didn’t do his homework.
The comments support the fact that the Met Office, and their petty operatives, conduct data maleficence and corruption on a regular basis.
Warren I am your claimed “unknown wacko”. Have you even read any of my work? If you had you would discover my work is incredibly well fact checked. But no problem you can exhibit your Dunning Kruger as much and as often as you like. We can all then have a good laugh at you.
I presume you read the fact checks by readers that noted you neglected to consider that the temperature measuring stations were there before the airport?
They weren’t there, they were somewhere else.
Which means that the author’s attempt to claim that the MET Office was lying is, of course, a sham.
No, because the Met office was calling it one location.
I’m so impressed with the serious matters that occupy your time.
I’m unimpressed with your scientific rigor.
beetroot’s scientific rigor, integrity and credibility are all set at ZERO or below.
He is brainwashed that is why he is this stupid.
Ray, you need to understand that beetroot is an extremely “low-information” mini-troll.
His one method is to “argue from ignorance”… because it is all he can do.
“I am your claimed “unknown wacko”
Well, you are rapidly establishing yourself as a known wacko.
Oh look, Nit Pick’s fine plumage has bee ruffled.
shillboi speaks! Y’all better listen up.
As I say above, it is a projected hatred on an organisation that produces GCMs, as though that involvement is all that they do, when it is but a tiny part.
Hence any percieved violation of propriety re gathering and archiving of data is a dog-whistle to pile in with bollocks.
Such is the projection of ideology onto science.
Yes, yes.
They’re all incompetent.
And/or they are all fruadsters.
Quite pathetic
“They’re all incompetent.”
If you are an example.. the YES, they are most certainly incompetent.
Yes, splicing data from disparate places is scientific incompetence, or fraud.
The AGW scam is rife with all sort of data corruption so ends up as a pile of bollocks.
If it is deliberate, it is FRAUD… either that or it is incompetence (only you know which, in your case)
The GCMs are all based on erroneous physics from the ground up.
Tom Shula and Markus Ott : The “Missing Link” in the Greenhouse Effect | Tom Nelson Pod #232
It’s always fun when a random non expert claims they have dissolved fundamental flaws in the body of peer reviewed science. It’s always the case they don’t understand scientific basics.
Take your “peer-reviewed” corrupt climastrology journals and shove them where there is no sunlight.
So you can’t follow or understand basic science….
OK… We knew that. !
And still totally ignorant what peer-review actually does,
Hilarious.
You really haven’t got the remotest clue about anything, have you beetroot. !
“…..from Richard Charles Horton OBE FRCPH FMedSci editor in chief of The Lancet who has published more peer reviewed material than probably anyone else ever –
“Peer review to the public is portrayed as a quasisacred process that helps to make science our most objective truth teller, but we know that the system of peer review is biased, unjust, unaccountable, incomplete, easily fixed, often insulting, usually ignorant, occasionally foolish, and frequently wrong”.
To which he later added:
“The case against science is straightforward: much of the scientific literature, perhaps half, may simply be untrue. Afflicted by studies with small sample sizes, tiny effects, invalid exploratory analyses, and flagrant conflicts of interest, together with an obsession for pursuing fashionable trends of dubious importance, science has taken a turn towards darkness”
https://tallbloke.wordpress.com/2024/12/17/southampton-mayflower-park-dcnn-5642-artificial-unintelligence-spliced-datasets-fake-estimates-disinformation-and-a-1976-record/
Richard Horton’s statement was part of his comments on a recent symposium on reliability and reproducibility of research in the biomedical sciences, not the physical sciences.
roflmao.
If you think the physical science are much better….
… particularly “climate science”.. which is rife with corruption and error..
… you really do have a massive anti-science bent…
… and absolutely zero credibility.
You are joking, right?
Where do you get the idea that biomedical science is not a physical science.
From:
https://go.syracuse.edu/ecs/masters/?utm_campaign=ecs-fy25-ms&utm_medium=search&utm_source=microsoft&utm_content=biomedical&utm_term=biomedical%20engineering%20degree&msclkid=77faecd063d81803fc508ba5845f859c
This is a perfect example of why people want to see you show the resources you use to come to your conclusions.
And it is more projection from the shills: everything they have posted in this thread reenforces the fact that climatology is a liberal art and not a quantitative physical science.
There were two separate statements there from different occasions on different subject. Anything else you want to make up as you seem to be being paid by the fabrication?
Nope.. all accurate
WTF does ideology have to do with this? That’s a voice in your head mate.
Here’s the first sentence from the Betts paper:
“The world is already more than 1 °C warmer on average than it was before industrial times, owing to greenhouse gases released from human activities.”
This is a scientifically fraudulent statement, which you yourself confirmed in your non-answer to me above. You think you can sneak in almost 100 years of warming with no anthropogenic carbon dioxide, and no one will notice.
“WTF does ideology have to do with this? That’s a voice in your head mate.”
Do me a favour.
This is supposed to be a blog for critique of climate science.
Intended for sceptics.
Except by dint of the responses from denizens, which exhibit outright denial of both the correlation and the causation science most prominent.
Then we get references to “scam”, “fraud”, “socialists”….
Clearly those are ideologically motivated.
The psychology of ideological motivation is quite clear:
“subjects who scored highest in cognitive reflection were the most likely to display ideologically motivated cognition. These findings corroborated an alternative hypothesis, which identifies ideologically motivated cognition as a form of information processing that promotes individuals’ interests in forming and maintaining beliefs that signify their loyalty to important affinity groups.”
In other words, the science here is filtered through ideology and as such rejects all evidence contrary to it.
Therefore ideology has a lot to do with it.
In fact everything regarding climate scepticism (read anthro caused climate change denial).
What is the optimum concentration of CO2 in Earth’s atmosphere, blanton?
And even more projection.
Ah, 2025 the year of Warmunists getting madder and madder, the COPE will be epic.
This post and all the comments support the fact that the PROBITY of climate data is shockingly compromised.
Next we should address the PROVENANCE.
Also shockingly compromised.
We already can see that the PRESENTATION and PROSECUTION of climate information are rank amateur sideshow alley barking.
Well said.
If they’d kept the original LiG thermometer, it would have recorded a spurious warming of about 0.6 C between 1873-1937, due to Joule drift alone. Another accuracy factor UKMet neglects.
In climastrology, Everything Bad cancels through the magic of averaging and baseline subtraction.
FM – F’ing Magic!
This goes way beyond weather and climate it is purely political. The WEF/Globalist need to cull the indigenous western masses. They will do this using climate change and pandemics as a trojan horse to harm and cull the population they see as their biggest obstacle. Here in the UK we are careering to energy disaster via a Labour party that like the Tories is controlled by the cabal and last July’s UK election was an illusion of adversarial democracy when in fact its good cop bad cop as these bastards plan our demise via mRNA vaccines, Bovear19 in the western diet staple of dairy produce, energy deprivation and mass illegal immigration and in our case mostly a very hostile virulent religion. They will use a fifth column primarily the white left/liberal middle classes who seem to worship Davos , Klauseand Soros
.UKMO founded by Darwin’s Galapagos chauffeur Captain Fitzroy of the Beagle after he saw the ferocity and importance of understanding the weather/ He was promoted to Admiral and founded UKMO as part of the ministry of defence.. As the political classes and hierarchies are now tools of the elite globalist , it stands to reason they will use all once thought of impartial government organizations, as their propaganda tools and that’s what UKMO has become . We had a storm yesterday so hyped up by UKMO it was laughable Scotland canceled Hogmanay celebrations in the major towns and cities. It was all to link winter weather being caused by global warming . Below an example of their fear mongering
Might, could, possibly, maybe, and so on total hyperbole
May I suggest reading this post of mine (and the linked articles) which demonstrate the fraudulent way the UK Met Office is operating. They have the option of a 60 year climate average from an excellent site with no homogenisation, However they chose instead to offer 5 other conjuring trick sites in lieu.
https://tallbloke.wordpress.com/2024/12/29/cawood-dcnn-4086-class-1-premier-quality-proof-of-met-office-data-misrepresentation/
Yep, they have got away with a huge amount of DELIBERATE data corruption.
That’s what happens when you put rabid leftist AGW-activists in senior positions.
The CORRUPTION becomes deeply entrenched.. Credibility drops to near zero.
The MET is a disreputable outfit, it should be presented with the most outrageous chicanery and given one week to justify their actions. If they can’t fire the top five percent of managers, bureaucrats and administrators and blackball them from ever working for a government funded outfit. Move the next highest ranking employees into the vacant positions and ask them if they are aware of the penalty of not doing a proper job because they to can be replaced.
The UHI effect.
Beautifully clear and unequivocal!
Yes, I thought Hausfather was too.
Horsefather is a data manipulating twit.
Caught out so many times with so many lies its farcical.
Just the sort of scam-artist we would expect to find you licking the boots thereof.
How many bottles of his snake-oil have you fallen for .. gullible.. unthinking.???
“The UHI effect.”
Is accounted for:
https://www.theclimatebrink.com/p/the-most-accurate-record-of-us-temperatures
“Contiguous U.S. monthly average temperature anomalies from the USCRN and ClimDiv relative to a the full 2005-2022 USCRN period of record. Data available from NOAA’s National Temperature Index.”
“Contiguous U.S. annual average temperature anomalies from the USCRN and ClimDiv relative to a 2005-2022 USCRN period of record. Data available from NOAA’s National Temperature Index.”
“If we zoom into the 2005-2022 period when the USCRN is available, we see something surprising: the USCRN actually shows faster warming over the period of overlap than the old weather network. So rather than “hiding” the weather network that shows no recent warming, NOAA’s new USCRN actually shows faster warming than the official US ClimDiv temperature record.”
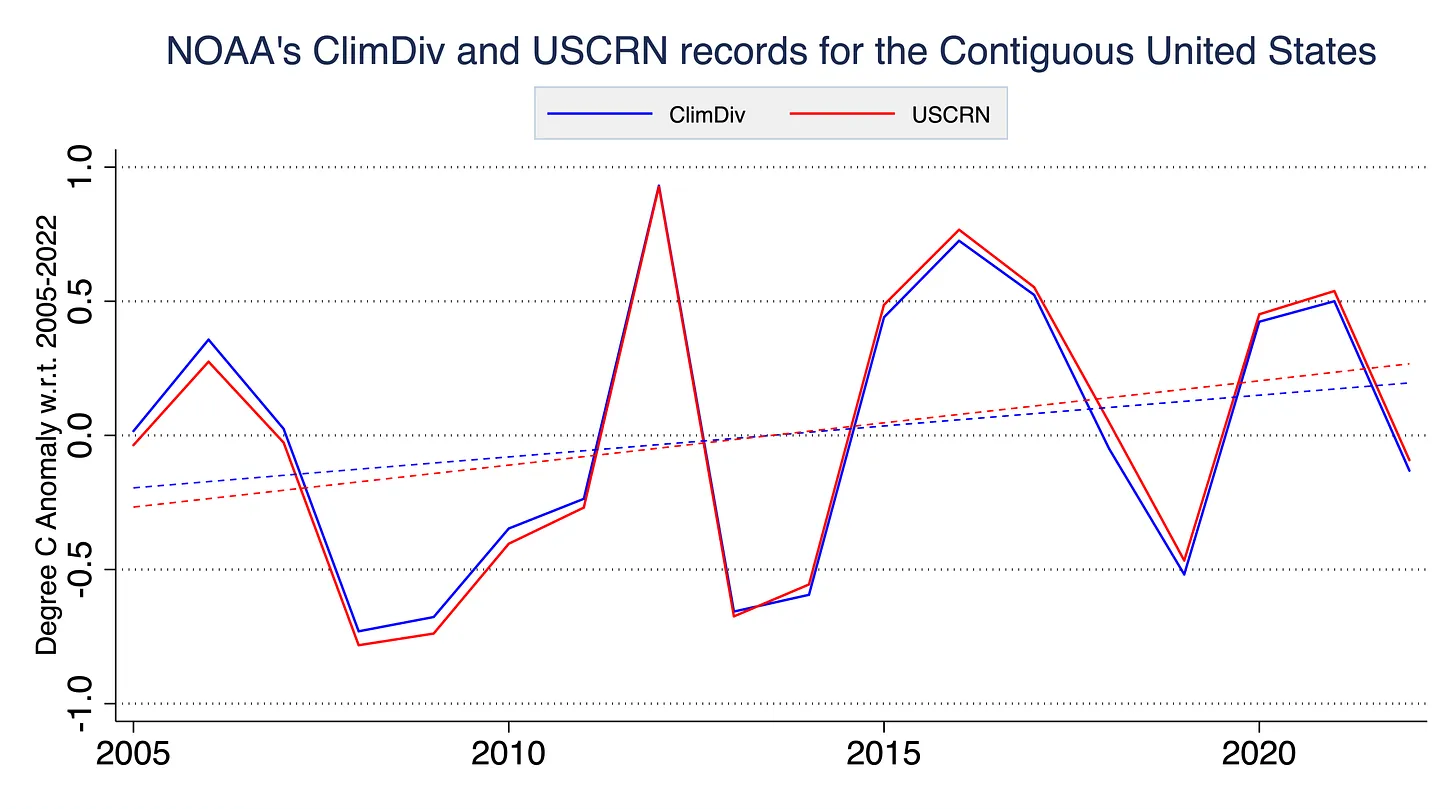
“Contiguous U.S. annual average temperature anomalies and trends from the USCRN and ClimDiv relative to a 2005-2022 USCRN period of record. Data available from NOAA’s National Temperature Index.”
Exactly where in the CONUS does the warming appear?
While you are at it, another random point.
Yes, Stevenson screens record lower maximum and higher minimum temperatures compared with the screens they repaced.
Your point is?
Typical ignorance of meteorology here.
The assumption that the same (GHG) driver as having the exact same response in all locations.
Stornoway and Lerwick are situated in the N/NW Isles of Scotland, surrounded by sea, with the vast expanse of the N Atlantic to the W/SW – where the prevailing comes from.
They are often strong winds to boot (hence ruling out a surface super-adiabat).
Ergo, temperature there are stongly moderated by SSTs, hence the modest warming reflects the mdest warming of SSTs.
Oxford and Sheffield however are inland in the southern half of England and have the diurnal warming that takes place when winds have a land-track. WInds are lighter and a surface adiabat can be formed in the summer.
Typical ignorance of a brain-hose AGW-cultist
CO2 has no effect anywhere. You have already shown there is no evidence it does
Your moronic arm-flapping and kamal-speak is getting more and more hilarious.
And rampant DENIAL of the urban warming effect..
How much dumber can you get !!..
No, that’s not a challenge.. but I’m sure you will try.
Oxford https://tallbloke.wordpress.com/2024/10/19/oxford-dcnn-4522-not-improving-with-age/
Sheffield https://tallbloke.wordpress.com/2024/09/17/sheffield-weston-park-dcnn-4061-implications/
Grow up Tony. Observers like you know sweet FA about meteorology.
Now which is it Mr Sanders.
Are you deficient in reading comprehension, or are you just projecting your own ignorance of meteorology onto the expert here?
I suspect both, with the latter attributable to a DK sufferer.
You appear to be serious case.
Again, I was a meteorologist with the UKMO for 32 years, the last 19 as an on the bench forecaster and 4 of those briefing aircrew of low flying conditions over mountainous terrain among other duties.
So obviously I know nothing mr expert!
The RAF being unconcerned that someone who “knows sweet FA about meteorology” was their Met Officer and briefing their pilots of multimillion fighter jets!
So quit with the aspersions, it reflects a tad badly on you Mr Sanders.
But to be realistic it is par for the course on here when one of you oh-so-cock-sure deniers insults the real expert, having not been met by just the wall-to-wall hugs and kisses of the admiring echo-chamber.
Now : to anyone who is not deep down this rabbit-hole, it is you who “know sweet FA about meteorology”.
Alternatively shall we swap?
Tell me what your profession was and then I’ll proceed to tell you that you “Know sweet FA about …..” and see how you like it.
And you’re welcome, deservedly so.
So No answer to the obvious. You don’t even know what CIMO assessments are do you?
blanton is the king of projection.
The assumption that the same (GHG) driver as having the exact same response in all locations
No one here is talking meteorology, we are discussing the use of temperature to derive climate signals.
However, your admission that CO2 doesn’t have the same effect in all locations ruins the theory that well mixed CO2 should be the control knob of temperature rise everywhere on the globe.
Oops.
Oops to you
You are pathetic as a troll.
“However, your admission that CO2 doesn’t have the same effect in all locations ruins the theory that well mixed CO2 should be the control knob of temperature rise everywhere on the globe.”
Dear God, how on Earth can you have got that opinion?
GHGs regulate Earth’s temperature, the ocean especially as they are 71% of the surface and store ~ 93% of the excess ASR of that warming.
The control knob comes from it impeading LWIR loss to space and not from it’s differential effect on temperature above any surface.
What about Arctic sea-ice.?
Do you propose that because the ice temp never gets above 0C then GHGs are not at work in the atmosphere?
The mechanism Is via the effective emission level, whereby an increase of atmospheric anthro CO2/CH4 raises that level and thus the emission is from a colder level and so weaker.
These basic concepts allude you evidently.
.
Additional GHGs do not have the same warming effect over the ocean vs over landmass.
The Earth is 71% ocean, and water has a Cp 4x that of air.
CO2 is a GHG and more of it in the atmosphere must cause it to lose heat to space more slowly than before.
Oceans heat the air above, just like land does.
As water requires 4x as much as does air to heat it by unit temp then it’s effect is 4x weaker.
Check out the GW response of SSTs vs landmass ……
Hence any location that has a strong prevailing wind from an ocean source will be cooler (usually) than from the land.
So we have warming rates for the likes of Stornaway, Lerwick, Thorshaven, McQuarrie Island, even Valencia (Ireland) etc moderated strongly by that fact.
To look at a location inland and compare warming trends completely ignores that import bit of meteorology.
Then denizens come up with the leap of faith that it is UHI making the difference.
That is due ignorance of meteorological conditions being seized as as something to support your ideological mindset.
So we are indeed talking meteorology in this section of the thread.
“Global land and global ocean surface temperature anomalies. Light lines are 12-month running means and heavy lines are 132-month (11-year) running means.”
Where did those 19th century ocean thermometers come from, blanton? Trees?
What is the provenance of your graph? You should not be posting graphs or other quotes without proper citations. A proper citation allows review of context by others.
Where did you go to university? My professors would have failed me for doing such a thing. Your propensity for making assertions about what others say without a citation is no better.
Look at what Andy has done. Everything has been appropriately cited and quoted. That is how science is properly transacted.
And because of this pseudoscientific noise we have to give up gasoline and diesel?
The only thing “pseudo-scientific” is the bollocks used to counter GHE theory.
The other issue you will have to take up with politicians and not scientists.
Running away from the endpoint of your cherished CO2 panic garbage.
Unlike you, who evidently view AGW entirely through a political lens – I view it through a scientific one.
And in that:
Scientists are not incompetent.
They are not fraudsters.
And importantly …. They know more than you.
BTW: I’m not panicking, that seems to be coming from you – over your imagined socialist take-over.
If you actually had a real quantified theory of AGW Panic, you’d be able to answer the question of the optimum CO2 concentration with ease.
It seems a widespread practice, the time-traveling met stations. I checked NASA GISS today for Spain, there are 5 airports with records starting as soon as 1893, 21 years before the first ever commercial flight. You can check it at: https://data.giss.nasa.gov/gistemp//station_data_v4_globe/