In his paper, “Relative Importance of Carbon Dioxide and Water in the Greenhouse Effect: Does the Tail Wag the Dog?”, Demetris Koutsoyiannis explores the greenhouse effect’s primary drivers, positing that water vapor and clouds vastly overshadow carbon dioxide (CO₂) in terms of their contribution. Using a radiative transfer model (MODTRAN), Koutsoyiannis analyzes downwelling and outgoing longwave radiation and derives macroscopic relationships that express greenhouse gas effects quantitatively. His calculations suggest that water vapor and clouds contribute between 87% to 95% of the greenhouse effect, while CO₂’s impact is only around 4% to 5%. The findings also indicate that recent increases in atmospheric CO₂, from 300 to 420 ppm, contribute negligibly—an effect quantified at just 0.5% for both downwelling and outgoing radiation.
Abstract
Using a detailed atmospheric radiative transfer model, we derive macroscopic relationships of downwelling and outgoing longwave radiation which enable determining the partial derivatives thereof with respect to the explanatory variables that represent the greenhouse gases. We validate these macroscopic relationships using empirical formulae based on downwelling radiation data, commonly used in hydrology, and satellite data for the outgoing radiation. We use the relationships and their partial derivatives to infer the relative importance of carbon dioxide and water vapour in the greenhouse effect.
The results show that the contribution of the former is 4% – 5%, while water and clouds dominate with a contribution of 87% – 95%. The minor effect of carbon dioxide is confirmed by the small, non-discernible effect of the recent escalation of atmospheric CO₂ concentration from 300 to 420 ppm. This effect is quantified at 0.5% for both downwelling and outgoing radiation.
Water and clouds also perform other important functions in climate, such as regulating heat storage and albedo, as well as cooling the Earth’s surface through latent heat transfer, contributing 50%. By confirming the major role of water on climate, these results suggest that hydrology should have a more prominent and more active role in climate research.
Keywords: Greenhouse effect; longwave radiation; water vapour; carbon dioxide; evaporation radiative forcing
Submitted 2024-09-22, Accepted 2024-10-28. https://doi.org/10.53234/scc202411/01
A good rule of thumb to keep in mind is that anything that calls itself ‘science’ probably isn’t.
J.R. Searle (1984)
The paper positions these findings in opposition to the widely held view that CO₂ is the critical driver of Earth’s greenhouse effect. Koutsoyiannis argues that water’s abundance and rapid hydrological cycling allow it to dominate atmospheric temperature regulation, effectively acting as the primary greenhouse gas. He claims that the historical focus on CO₂ has skewed climate research, diminishing hydrology’s role and limiting a complete understanding of climate dynamics.
Koutsoyiannis also critiques the mainstream climate science perspective, which he suggests has become too intertwined with political agendas. He points to discussions in prominent journals that frame CO₂ as the “control knob” of climate, a narrative he finds unsupported by empirical evidence. By applying his model, he challenges the assertion that removing CO₂ would dramatically alter Earth’s climate; instead, he contends that water vapor would continue to regulate temperature through its dominant greenhouse effect and short atmospheric residence time.
The study incorporates data from ERA5 Reanalysis and satellite-based radiation measurements, specifically the CERES project, for validation. These datasets provide insight into radiation profiles and support the author’s argument that water vapor’s regional variability and rapid cycling enable it to exert a powerful greenhouse effect that CO₂ cannot match.
However, Koutsoyiannis acknowledges that the hypothetical removal of CO₂, often discussed in theoretical studies, lacks empirical backing, as CO₂ has consistently been a part of Earth’s atmosphere over geological timescales. He also contrasts the rapid turnover of water vapor with CO₂’s longer residence time, highlighting the latter’s well-mixed nature across the atmosphere as a potential reason why its warming effects appear diffused.
Through his analysis, Koutsoyiannis calls for a reorientation of climate research, urging the scientific community to afford greater attention to hydrology and to reconsider CO₂’s central role in climate models. He concludes that the understanding of Earth’s climate may be limited by the current emphasis on CO₂ emissions, which he argues overlooks the nuanced and regionally specific effects of water vapor.
In sum, “Does the Tail Wag the Dog?” is a critique of prevailing climate science paradigms, advocating for a model that recognizes water vapor and clouds as the foremost greenhouse agents while downplaying CO₂’s overall effect. Koutsoyiannis’s paper encourages a shift in climate research focus toward hydrology and questions the mainstream positioning of CO₂ as the cornerstone of climate change theory.
In addition, Koutsoyiannis has posted reviewers comments from his earlier attempts to publish in other journals.
This file is the Supplementary Information of the paper “Relative importance of carbon dioxide and water in the greenhouse effect: Does the tail wag the dog?” It contains interesting material as it demonstrates the current practices of silencing voices that disagree with mainstream opinions, which are purported to be science. The contained materials include the rejection files from three journals, namely Hydrological Sciences Journal, MDPI Hydrology and Ecohydrology and Engineering. The document contains all reviews and replies to them, as well as key exchanges with the journal’s Editorial Offices. Replies to reviews are contained in the case that the Editor accepted the request to rebut them—otherwise no replies were prepared. [See the paper at: https://www.researchgate.net/publication/385590387]
It seems Willis had something to say about this….
Getting rejected by a MDPI journal is an achievement!
But the case is very unclear. No-one disputes that water vapor is the main contributor to the GHE. The point is, as the article says, “rapid hydrological cycling”. IOW, you can’t just put more wv into the air – it will be rained out in about ten days. You can effectively put CO2 in the air, it lasts for decades.
So what can actually change the GHE – ie warming? Extra CO2 can, and that is what we are doing. Warming itself can, because that can keep extra wv in the air. But the warming had to come first. That is why wv is a feedback (and a strong one) to warming, and in particular to CO2-caused warming.
None of this is new.
“Warming itself can, because that can keep extra wv in the air.”
It can also cause drying of the air. So the feedback is not so obvious.
“in particular to CO2-caused warming”
Oh, so I see that’s the primal cause? Dogma #1?
Overall, the wv in the air is in equilibrium with the sea. And the only thing that can shift that (toward more wv) is warming.
Natural solar warming, you mean.
You can’t seriously think that a tiny change in a tiny amount of atmospheric CO2 can cause ocean warming. !
That would be just DUMB.
Warming increases water vapour in the atmosphere?
But… I thought we were going to be condemned to eternal drought?
Nothing about this sounds bad!
Not exactly. While the oceans are the ultimate reservoir for water, water vapor that precipitates out increases the capacity for the air mass to acquire replacement WV through evapotranspiration. Thus, based on prevailing winds, topography (orographic uplift), and turbulence, the air masses tend to maintain a constant water vapor load that cycles from ground to air. As the air warms, it can hold additional water vapor which is available from many sources. When humans build reservoirs and pump ground water for irrigation, it provides new water vapor to be acquired by unsaturated air masses. As alpine glaciers melt, more water is available in the streams and rivers to be evaporated as well. The Water Cycle has been in a state of disequilibrium at least since the Mesopotamians started irrigation engineering projects.
This article — https://news.yahoo.com/news/climate-change-drying-us-west-165224062.html — suggests that the wv content is increasing with warming; additionally, the CO2 greening should be increasing transpiration as well.
Yes, land creates an exception. But winds blow, the sea is big – it doesn’t take long before any parcel of air has to come into equilibrium with the sea.
Same applies to CO2.
The rate of increase of atmospheric CO2 follows the atmospheric CO2.
… even to the El Nino spikes and steps.
Difference is, that CO2 has zero warming effect in the atmosphere…
whereas WV is a massive transfer of energy upwards.
CO2 has a near zero warming effect? Not quite zero.
Specific heat capacity changes with changes in CO2 concentrations. The effect on changing 1 mol of air with 400 ppm (STP) to 800 ppm and injecting 1 J gives a percentage change that shows up in the 6th decimal place.
An important exception because that is where people live and the specific heat capacity of terrestrial materials and air allow much greater changes in temperature than what happens with water.
So what you are saying is the entire air mass over the oceans is in equilibrium with the sea? I’m not so sure. Maybe the boundary layer right at the surface, but pressure and temperature in the atmospheric column disturb that equilibrium. Oh, and those disturbances are called “weather.”
Yes, it was such an obvious fallacy i didnt even bother to comment..
FTR, below the sea surface is wide variation in temperature. With currents including vertical heat transfer to atmosphere will vary.
So the ocean temp doesn’t impact the “global average temp” very much?
Since “back radiation” doesn’t do much to warm the ocean then how can it warm the atmosphere above the ocean without affecting the equilibrium?
it doesn’t take long before any parcel of air has to come into equilibrium with the sea.
Not true. Conditions are constantly changing. Simplest example: earth’s rotation. When conditions are constantly changing, equilibrium is never achieved.
No. Maybe you are confusing the idea of equilibrium with that of steady state, but if the ocean and atmosphere were in equilibrium there wouldn’t be transport from one to the other. It would present a static situation. There has to be a gradient of water vapor to move it from places where water is abundant to places where it isn’t.
At any one time and over the Earth’s surface, in fact throughout the atmosphere, the local humidity varies all the way from near dry air values up to values near the saturation curve — nonequilibrium.
No, it is dynamic equilibrium. Water is constantly evaporating, as caused by sun and wind. Rate about 1 ton/m2/year.. It is regularly raining, as determined by humidity and temperature. But storage in the air is limited; about 25 kg/m2. So the rain is constrained to be about 1 ton/yr. So the things that determine it – humidity and temperature, are fixed. The dynamics is similar to an acid-base pH buffer.
Yes, humidity and temperature vary in space. But the pattern does not vary much.
The wind is the major force that sweeps enormous amounts of water and water vapor from the oceans into air and onto the land. The winds of recent hurricanes blew mega amounts of water onto the southern states.
Go to “Science of Climate Change” 4.1 and read the review paper:
“Nobel Prize For Climate Modeling Errors” by Roy Clark. In one section he review the papers investigating the effects on water vapor transport into the air.
Now scroll down and read my comment about Death Valley.
Partial pressure is what determines vw in the atmosphere. If you add co2 this increases the partial pressure which will drive WV out of the atmosphere. Negative feedback.
“If you add co2 this increases the partial pressure which will drive WV out of the atmosphere.”
Makes no sense
“Makes no sense”
Only because your understanding is limited.
In a given mol of air at a given temperature and pressure, the number of molecules is fixed. If you add CO2, then yes, some water vapor is pushed out as is many more O2 and N2 (and fewer of others). This changes the partial pressures of all the different gases.
Partial pressure is what determines vw in the atmosphere
Backwards. The concentration of a gas in the atmosphere determines its partial pressure.
The ratio of N2 and O2 to H2O is high, so any molecules CO2 pushes out will be predominantly not H2O
Didn’t you do physics 1.01 Nick?
Then you have convection of latent heat from the surface to the air above, and clouds and cumulonimbus towers, direct LW radiation; formation of stratospheric cirrus clouds -> re-radiation of sw-radiation to space.
All the stuff generally bundled-together as a feed-back – the hotter it gets at the top of the atmosphere between the Tropics of Cancer and Capricorn, the cooler it is at the surface. …
If you claim air-T and SST have warmed, why is there no trend in datasets exceeding 30-years?; what about 25-years, or even 46-years?
All the best,
Bill Johnston,
http://www.bomwatch.com.au
“no trend in datasets exceeding 30-years?” ???
Here is a back trend plot for 3 major land/ocean datasets. It shows the trend from the x-axis year to present. You can go back to 1970 and the trend is still about 2 C/century.
Urban warming, combined agenda driven adjustments.
NOT representative of global anything. !
And starting in the middle of the New Ice Age scare.
Urban density and population started to increase markedly in 1970.
Your graph is totally meaningless and irrelevant.
But Nick, they are crap.
They are all off-the-shelf made-up datasets that bear no resemblance to the loads of actual data that exist in databases.
Why don’t you grab some of those datasets and analyse them for yourself. For instance, some of the BoM’s SST datasets that go back 30 years, Multiple datasets from AIMS dataloggers and weather stations that start in 1995, and the daily SST datseat for Puerto Ayora that starts on 31 December 1964.
If everyone uses the same crappy data, Nick, sure as hell, they will arrive at the same crappy conclusions.
All the best,
Bill Johnston
http://www.bomwatch.com.au
“Why don’t you grab some of those datasets and analyse them for yourself”
I do that regularly. I take GHCN V4 data, which consists of unadjusted thermometer records, and ERSST V5. I integrate as TempLS, and post a new monthly temperature each months (the first one out). But it agrees with the others.Here is the same graph with TempLS added:
Go back 10,000 years
NONSENSE surface temperature.
URBAN WARMING.
GHCN V4 is massively adjusted .
As I said Nick, per-digested crap data leads to pre-empted crap conclusions.
Everyone does it. They grab a graph from somewhere that supports their case without considering if the data upon which the graph depends is any good.
Question for you Nick. How come surface temperature across Australia is said to be warming, when data for hundreds of individual weather stations – the ones used to make the graph, show no warming at all?
All the best,
Bill Johnston
http://www.bomwatch.com.au
If you stay tuned, Nick,I have some research ready next week that uses actual raw data to question your sweeping assumptions. If you do some correlation coefficients of CO2 with the appropriate temperatures you can beat me to part of it. Beware that turning point in 1975!
Geoff S
Tropospheric warming can affect the rate of evaporation and condensation.
It’s not a question or more or less water vapor. It’s a question of change-of-phase-state dynamics and the rate of heat dissipation to space.
Dear Pat,
How does the troposphere “warm”. Next time you fly across it, watch the temperature gauge, or take a thermometer with you and hold it out the window!
Furthermore, how can such “warming”, like, way up there, affect evaporation and condensation, which result from surface energy balance fluxes.
Heat can also only “dissipate to space” via radiation.
Cheers,
Bill Johnston
You have noticed that there is no measurable tropospheric hot spot as demanded by the “physics” programmed into the “hot” CliSciFi models? The Russian INM models have no tropospheric hot spot, hindcast well and have an ECS of about 1.7 – 1.8.
Also, the UN IPCC in its AR6’s Table 12.12 of WGI says there has been no increase in the frequency, intensity nor duration of extreme weather.
Give it up, Nick. The approximate 1% perturbation of Earth’s heat balance estimated by the cultists is immeasurable given the huge energy flows involved. If one cannot measure something how can one say there is an effect of that unmeasurable something?
An increase in atmospheric water vapor would also cause an increase in clouds, which increases albedo and causes cooling. Water vapor also transports significant energy upward in the atmosphere, as it became water vapor through evaporation and releases that energy when it condenses to form clouds, again cooling the surface.
Water is pretty amazing stuff.
“An increase in atmospheric water vapor would also cause an increase in clouds” JZ
You have no data to support that false conclusion.
UP
There has been global warming for the past 48 years
UP
Absolute humidity has increased since 1979 by about 1% every 10 years.
DOWN
The percentage of cloudiness has declined in the past 20 years
A good argument could be made that absolute humidity and cloud coverage data are not very accurate. You made no such argument You merely ignored the available data on global average absolute humidity and global average cloudiness.
Correct, you also need to increase particles in the atmosphere to increase clouds. We have been scrubbing them from the atmosphere for decades.
It depends on where the water vapor is, HT injected substantial amounts into the stratosphere, the surface IR reflected back down by this excess water vapor to the surface would heat the cloud tops at the tropopause boundary and have a negative forcing on convection.
It’s not just a function of clouds and albedo. More water vapor also means more intercepted insolation from the sun which increases the amount returned back to space before warming anything below. It’s been a while since I’ve looked at it but from a high level, the amount of radiation actually intercepted by a water molecule depends on the angle of incidence, some gets absorbed and some gets reflected. So the more water molecules involved the more radiation that gets reflected back to space. It’s not just clouds that impact albedo, water molecules alone have an impact.
A water molecule, due to its geometry, has a dipole moment.
A CO2 molecule, due to its geometry, is dipole neutral.
Molecules with dipole moments interact much more (kinetic) energetically with EMI waves.
Both are affected by EMI wave pressure, but that is minor.
“Extra CO2 can, and that is what we are doing.”
NO IT CAN’T and NO, it is not causing the warming.
WV is NOT a feedback, because there is no signal from CO2
1… Show us some empirical scientific evidence of warming by atmospheric CO2
2… Show us some CO2 based warming in the UAH data.
3… How much warming has CO2 caused since 1979… give actual measurements and scientific evidence to back up your guess.
NONE OF IT IS REAL.
Its been directly measured, in fact the 11 year experiment to do so was featured on WUWT a long time ago. I cannot find a link to the WUWWT article, but here is the paper:
https://newscenter.lbl.gov/2015/02/25/co2-greenhouse-effect-increase/
Note that it arrived at about two tenths of a watt/m2 for a CO2 increase of 22. That’s not far off what I would expect from direct effects.
There are many more experiments I could refer you to, but they all wind up with about the same result. The uncertainty is in the feedbacks.
The study you are referencing is Feldman (2015)
Feldman started at the very base of a La Nina and finished at the peak of a El Nino.
His final result of “forcing” was actual just modelled.
He also talked out “forcing”, not temperature increase, which are two separate things because radiation is only a bit player in atmospheric energy transfer..
A bit more information re studies..
That one study is Feldman 2015 (1) under carefully controlled “CLEAR sky” (ie selected data) conditions.
But then, there is Dong, Xi, Minnis 2006, under “ALL sky” conditions, that found the reverse.
”Similar to the clear-sky study, we also provide the all-sky upwelling SW and LW fluxes to study the surface radiation budget under all-sky conditions. The rates of net SW and LW fluxes are −0.07 W/m^2 [per year] and −0.37 W/m^2 [per year], respectively, resulting in a decrease of 0.44 W/m^2 per year in NET flux at the surface (Figure 3b). The decline of NET flux, however, does not correlate with the increased surface air temperature as illustrated in Figure 3a. The surface air temperature is determined by the sum of NET radiation fluxes (downwelling and upwelling SW and LW fluxes) and nonradiative fluxes (sensible and latent heat fluxes, ground heat flux and energy flux used for melt), as well as the large-scale advection [Wild et al., 2004]. Wild et al. [2004] investigated this counterintuitive result and concluded that it may be due to a decrease of surface evaporation and associated reduced evaporative surface cooling.”
”… using the Stefan-Boltzmann equation indicates that an annual increase of 0.04°C air temperature each year corresponds to an increase of 0.4 W/m^2 per year in upward LW upward surface emission. However, the measured change is a decrease of 0.26 W/m^2 per year as shown in Figure 2e.”
Dong, Xiquan, Baike Xi, and Patrick Minnis 2006. “Observational evidence of changes in water vapor, clouds, and radiation at the ARM SGP site.”
Geophysical Research Letters
http://onlinelibrary.wiley.com/doi/10.1029/2006GL027132/full
Another part of Feldman 2015 says…..
CO2 forcing is derived from temperature and modeled spectra.
PS.. the real stupidity of the whole thing is they he seems to think “clear sky” means there is no water vapour.
The point of using clear sky conditions was to eliminate to the extent possible the influence of factors that can’t be easily quantified, like clouds. So they got a different number under different conditions. So what? In fact, embrace that. It shows that not only are the feedbacks hard to quantify, under some conditions they are negative.
As for the modeled spectra, again, so what? Do you trust the UAH temperature series? Guess what, that’s a model too. Its a calibrated model so we can give it greater trust, but it is a model. ANY experiment of this sort requires modeling of some sort. Why? Because we cannot build an experimental apparatus that is 60,000 feet high. So we find alternatives to arrive at approximations. In this case the approximation about fits theory, which is a rough calibration.
Its a mystery to my why skeptics repudiate studies like this at every turm. Stop and think for a moment, these studies actually bolster the skeptic case.
The study doesn’t even discuss any “warming by CO2”
Yet you put it forward as a study that directly measures CO2 warming
Except when you read the paper…
IT HAS NOT BEEN DIRECTLY MEASURED.
Plus 0.2 w/m2 IS warming. Its the definition of warming.
I’m sorry you don’t understand basic physics and instead of learning become one of those examples the alarmists hold up of people on the skeptic side in order to paint us as incompetant.
Wrong… “forcing” is a theoretical concept, based on radiation only
To get warming you have to alter the cooling rate..
It was the increase in temperature that gave the tiny change in “forcing”,
NOT CO2
OMG NO!
That’s not right, that’s not even wrong.
Cooling is the rate at which the surface loses energy, warming is the rate at which the surface gains energy. The combination of the two are either positive or negative which in turn dictates if the temperature is going up or down respectively.
Nor are we talking “forcing” here. We are talking about a measured 0.2w/m2 which can be directly input to Stephan-Boltzmann Law to arrive at the associated temperature increase. If you wish to dispute SB Law then I suggest you write it up in detail and submit it to a physics journal. You will either be widely ridiculed or win a Nobel Prize.
I’m done here. You are over you head, I’ve been a known hardcore skeptic for literally decades, but if you want to believe in magical thinking then you are no better than the alarmists who do as well. I have no more time for you.
“We are talking about a measured 0.2w/m2”
No we aren’t.
Note that no one is disputing the S-B law. What we are pointing out is that there is no measured downwelling longwave infrared power whatsoever, at Earth’s surface, at ambient temperature, at night. That’s different. But to someone who doesn’t know their physics, it can be tricky to grasp. All of the longwave radiant power at the surface is going upward – from the warmer surface, to the cooler atmosphere. As described by the 2nd law of thermodynamics, and as measured by pyrgeometers. The actual value generally ranges from about 0 to around 100 W/m^2 upward, inversely correlated with humidity, but with no noticeable dependence on CO2 levels.
Why don’t you apply some of that hard-core skepticism to the climate “scientists”‘ claims about DWLWIR? Because those claims are all false. You should be skeptical of them, shouldn’t you?
Otherwise, you should probably sit this one out – the physics seems to be way above your pay grade, decades-long skeptic or not. How much physics education have you actually taken? Do you know the difference between a Watt and a Joule? Do you know what EM radiation is?
I provide this picture from my heat transfer book only to show the temperatures that would be of concern with a WV and CO2 combination.
Where can I measure this 0.2 of a W/m^2 for myself, David? Or any of the rest of the supposed downwelling longwave IR power at the surface?
Did you understand the paper? Yes? Then you have your answer. No? Then go study physics until you can and then you will have your answer.
It is you that doesn’t understand the paper.
So, the linked article isn’t too specific about what spectroscopic instruments they are using, but AERI is one typical instrument that they might be using. (Let me know if you know which one they actually used.) Instruments like that are cooled to liquid nitrogen temperatures or lower in order to measure incoming power from the atmosphere, which is warmer than liquid nitrogen. So those downwelling W/m^2 are being measured as if the surface were the temperature of liquid nitrogen. What is the actual surface temperature where you live? Can you measure any downwelling W/m^2 at ambient temperature?
If you go the paper on the Nature web site, it is paywalled, but you can see the figures which clearly state they used AERI, so good guess. I skimmed the handbook but didn’t see any references to cooling, even in the calibration section.. They do say the detector is:
Detector – The AERI IR detector is a two-layer “sandwich” design (InSb and HgCdTe) manufactured by Infrared Associates.
Instrument details start on page 12 and they have fairly detailed explanations of how they calibrate.
https://www.arm.gov/publications/tech_reports/handbooks/aeri_handbook.pdf
As to your question re measuring downwelling w/m2 at ambient temperature, obviously yes. Otherwise the planet would freeze solid. Have I done this? Again yes, I don’t have that kind of equipment just laying around anymore, but yes.. If you have an instrument that can measure in the infrared spectrum it is interesting to see the difference between a clear sky and various cloud types.
Actually it specifies AERI in the abstract:
are derived from Atmospheric Emitted Radiance Interferometer spectra3 together with ancillary measurements and thoroughly corroborated radiative transfer calculations
As to the temperature of the sensor, this is ultimately irrelevant. The instrument is calibrated, they describe the procedure in the manual. If it is calibrated, it is calibrated. The sensor could be a rock for all I care. If the calibration is valid, then its valid.
AERI sensors are absolutely “cooled to cryogenic temperatures”, from here: https://www.ssec.wisc.edu/aeri/ (scroll down to “Instrument Specifications”, or just search for the phrase I quoted)
You said: “As to your question re measuring downwelling w/m2 at ambient temperature, obviously yes.”
Show me, please. AERI sensors do not do this, as I have demonstrated. What “kind of equipment just laying around” do you not have any more?
You said: “the temperature of the sensor, this is ultimately irrelevant.”
Say what? You don’t think the temperature of the colder object in a two-object system affects the amount of radiant power developed from the warmer one? Now who doesn’t know his physics? And no, you can’t get around this fundamental principle with any amount of “calibration”.
Let’s try a simple physics quiz: see if you can explain to me the difference between radiant energy and radiant power. If not, back to physics class for you! Note that none of the climate “scientists” can answer this question. Their entire field of study is dependent on not knowing the correct answer. It really is a travesty.
Perhaps you should go and read the definition of calibrated.
You can’t “calibrate” your way around the 2nd law of thermodynamics… and you have yet to demonstrate that anyone has actually done so. What evidence have you got for your unsubstantiated claim of positive downwelling longwave infrared power at Earth’s surface at ambient temperature?
You won’t be able to document this. In fact, current theory seems to be that the Tonga volcano put moisture into the air that is affecting weather more than two years later. You put an arbitrary limit on the duration of the hydrologic cycle, based on no evidence.
Nor can you creditably claim to know how long CO2 will be around, since there is no reliable “half-life” for CO2 in the atmosphere. You don’t even usually acknowledge that there is a carbon cycle.
“none of this is new” because all of it is wrong, as usual.
The ‘bomb spike’ of C14 CO2 after the nuclear test ban treaty showed a CO2 half-life of 5 to 6 years.
Do not confuse the atmospheric residence time of a single CO2 molecule (bomb spike C14) with the half life (or almost equivalently efold time) of the bulk in the atmosphere given sources and sinks. The efold time is an order of magnitude longer. Covered here years before by myself and Willis in posts trashing Murray Salby because he made the same basic mistake—in three consecutive different presentations. So not a glitch, a basic scientific error.
You misunderstand my statement – no one can make a reasonable precise declaration of how long water or CO2 lasts in the atmosphere. I admit the use of the term half-life in this sense is unnecessarily confusing, but it referred to the time of the materials in atmosphere, and not the radioactive state of the elements.
No one knows because there is no agreed-upon rate of uptake of carbon, and even this week we’ve seen two of carbon fixing factors get immense upgrades to their uptake rates. Water content, yet alone duration, in the atmosphere is not knowable because it is irregularly dispersed, moving in three dimesions and simultaneously moving between solid, liquid, and vapor states.
You can attempt to draw an average uptake of water from ocean evaporation, as Nick does, but he plugs in the entire surface area of the ocean without regard to sunlight v darkness or to latitude, or to weather, or of the changing warming/cooling effects of water vapor due to precipitation, cloud, or ice. He takes ocean surface as the only source of water vapor.
He ignores the author’s simple idea that the amount of water vapor in the atmosphere is so many orders of magnitude greater than the amount of CO2, that it cannot have as great effect.
“You put an arbitrary limit on the duration of the hydrologic cycle, based on no evidence.”
Well, the article itself says that it is rapid. But it is easily worked out. The average precipitable water is about 25 kg/m2. And average rainfall is about 3 kg/m2/day.
Events that directly inject water vapor into the stratosphere are rare, and yes, that water does persist. But there is very little of it. The volcano injected about 130 Mtons. Total wv in the atmosphere is about 100000 times that.
Compare to WV in the stratosphere it was a very significant amount.
And yes it is still there in significant quantities.
Most WV is in the lower troposphere.
It is the only GHG that has any measurable effect.
Who’s latest theory is this, exactly?
You don’t supply any links to the source of “the current theory”.
Who’s theory is it?
Why did it take ~18 months for the HTE to suddenly start affecting global temperatures?
Because that is how long it has taken to spread around the higher latitudes stratosphere, idiot !
Or are you DENYING that H2O in the stratosphere has a greenhouse effect that slows radiative transfer ??
Yes, NASA monitored the dispersions.
As the water rains, more water evaporates and replaces it. So yes, you can put more water vapor in the air.
True, humidity is not constant, but the atmosphere does not lose all of its water and stay dry forever as the statement infers.
Current guestimates for CO2 residency times range from 5 days to 67 years.
NOAA data 1948 – 2024 show relative and specific humidity falling or constant over most of the atmosphere.
That’s a Humlum plot, and the source he gives is an interactive PSL facility. You have to fill in a rather detailed request, and I don’t know what he supplied. But here is the NOAA original for Precipitable Water – basically the whole mass of water vapor:
Units are kg/m2
Oh look, spikes at the major El Ninos. !!
No trend from 1968-1990..
And look at the 1952 and 1958 (est) peaks, obviously caused by human warming.
So it takes ten days to rain out? How long to re-establish? 😉
leefor,
Exactly!
Rainfall happens at a given time on only a fraction of the ocean area. The rest is available to replenish water vapour. Too little attention is given to explaining that a small % change in water vapour in the troposphere can wipe out the contribution of CO2. But such is the dedication to CO2 control knobs that few will contemplate water vapour controls. Geoff S
71% of the earth’s surface is covered with water. There is too little CO2 in air to cause global warming. Scroll down and read my comment about Death Valley.
‘IOW, you can’t just put more wv into the air – it will be rained out in about ten days.’
So, we can’t put more wv into the air, but CO2 can?
We can’t, because the air is in equilibrium with the sea, which is big. We can’t shift it by boiling water.
But temperature can change the equilibrium constant. And CO2 can raise temperature.
‘And CO2 can raise temperature.’
Like to see some physical evidence of that, Nick. Temps lead CO2 by centuries according to ice cores and the DSDP cores provide absolutely no evidence that CO2 has ever driven temperature during the Cenozoic.
Noone has ever added a huge amount of CO2 by digging and burning, in the Cenozoic. Without a source of new carbon, CO2 just follows variations in ocean solubility, and so follows temperature. But this one is different.
SO WHAT.
All it has done is help boost the crops needed for feeding the world’s population.
“But this one is different.”
Total BS… nothing by mantra regurg.
The rate of CO2 rise FOLLOWS the ocean temperature even now.
Human CO2 is only 4% of the total CO2 flux.
Be Nasty: One false CO2 statement after another. You remain the Climate Buffoon of the WUWT website threads. The dumbest comments I’ve read in 28 years of climate science reading. No evidence of an above average IQ. But you are very consistent. Consistently wrong.
RG absolutely HATES data..
Cannot produce a single thing to support his ignorant mal-understanding of everything.
A scientific NON-ENTITY…
1… Show us some empirical scientific evidence of warming by atmospheric CO2
2… Show us some CO2 based warming in the UAH data.
3… How much warming has CO2 caused since 1979… give actual measurements and scientific evidence to back up your guess.
You are still an ABJECT FAILURE.. and always will be…
… because you CHOSE TO BE
‘But this one is different.’
In other words, ‘special pleading’ – a logical fallacy.
Let me say it again – we have mined and burnt about 600 Mtons C. That hasn’t happened before. This one is different. It’s adding C from a new source, instead of just moving it around.
And yet the Climate changed continually, you disprove your own beliefs every time you touch your keyboard.
WRONG… CO2 cannot raise temperature.
That is baseless AGW mantra. backed by zero evidence.
Nonsense, there have been multiple rapid climate changes over just the last 10,000 years none of which CO2 had any affect on. The over all trend is still down to the next glaciation, any warming man may cause can only help slow this down.
Anthony’s jar experiment shows CO2 doesn’t raise temperature. And if we go to Feynman experiments rule.
The jar involved Cv, not Cp.
Nothing in the atmosphere or the ocean or the land is in equilibrium. Stimuli are constantly changing even if only due to the rotation of the planet.
FYI, rain pulls some CO2 down with it.
One can theorize that warming from CO2 will increase the amount of water vapor in the air but that is not what the data show. Refer to NOAA for the details.
Denis,
I have spent a lot of recent time deep digging into the veracity of NOAA statements and the validity some NOAA data sets, including early CO2.
Be very careful if you assume that NOAA is neutral and above being advocates for global warming, thumbs on scales, etc. Geoff S
There is no evidence for the period from 2000 to 2020 that water vapor is a strong feedback. There is evidence for 1980 to 2000. Those contradictory absolute humidity data make conclusions about the water vapor feedback impossible.
“There is evidence for 1980 to 2000″
Odd.. I can’t see any evidence. !
Less particles in the air from shutting down coal plants, cutting down Forrest’s and all other atmosphere scrubbing laws = less clouds even with more water vapor.
Yet atmospheric water is constantly replenished from the sea and maintains itself as well as seeing some other natural changes. CO2 is variable over the millennia and has seen huge variation in the medium past often without provable concomitant temperature changes. A different take on all this is the simple observation that not one serious forecast of the past few decades relating to global warming has ever come to pass. Be these: that our children won’t see snow again – they do, the Maldives will be overwhelmed – they have not, as Prof Ridd has shown despite his university’s appalling treatment of real science, the corals which were supposed to be dying are cyclically regenerating, the glaciers of the Alps will disappear – they have not, the North pole will be ice free, it is not , its ice is cyclical and currently growing, New York was once supposed to be been under water, it is not. The list goes on and on. Additionally one might usefully ask why is it that the 70’s worry about a forthcoming ice age has also never come about – let alone any sort of apology to the world.
I understand that claim about persistence time of CO2 has been solidly rebutted.
I read catastrophists being of two minds on rain – some say droughts, others say more rain.
Most importantly, you miss the limit on the effect CO2 can have, most of it already realized – its asymptotic to a limit.
I read that the claim of feedback has been rebutted, I point to basic reality that temperature is not increasing rapidly.
You might look at data on water vapour in the air compared to earlier, and at omissions from the theories – aka ‘models’ – that catastrophists use.
“The paper positions these findings in opposition to the widely held view that CO₂ is the critical driver of Earth’s greenhouse effect.”
“the critical driver”
Is that an accurate characterization of the widely held view? Widely held by whom?
It seems A Lacis, G Schmidt, et al 2010 was pretty influential along this line of thought.
https://pubs.giss.nasa.gov/docs/2010/2010_Lacis_la09300d.pdf
“Widely held” by the political Policy Makers” of the IPCC who write the Summary for Policy Makers
From what I remember of reading AR2 a long time ago, they concluded that WV was the #1 contributor to warming in models followed by Clouds. But at that time, and still true today, they don’t know the magnitude of the cloud effect, nor do they know the sign of the factor for clouds. That is a profound failure of modeling when your #2 factor is essentially an unknown and maybe unknowable variable. So much for the impact of CO2.
WV has always been the biggest contributor to the greenhouse effect. No one disputes this (apart from the odd nutter who turns up here at WUWT to deny that there even is a greenhouse effect).
Man-made CO2, CH4, etc emissions warm the atmosphere; this increases its WV content, which creates this ‘positive feedback loop’ thing.
“Man-made CO2, CH4, etc emissions warm the atmosphere”
RUBBISH…
You are regurgitating scientifically unsupportable AGW-mantra .. because that is all you have.
1… Show us some empirical scientific evidence of warming by atmospheric CO2
2… Show us some CO2 based warming in the UAH data.
3… How much warming has CO2 caused since 1979… give actual measurements and scientific evidence to back up your guess.
M
DP…
Not enough to measure. The current warm period is caused by the earlier warming of the ocean by Sol.
‘Man-made CO2, CH4, etc emissions warm the atmosphere; this increases its WV content, which creates this ‘positive feedback loop’ thing.’
The only problem with this statement is that none of it is true. OLR (outgoing long wave radiation) and ASR (absorbed shortwave radiation) are both increasing in contradiction of your tiresome alarmist narrative.
People who use the term feedback really need to take a course in Control Theory, which is part of Systems Engineering.
You have to learn the difference between the actual greenhouse effect and the projected increase of the greenhouse effect in the long run from manmade CO2 emissions.
Water vapor is the primary greenhouse gas
The IPCC claims an increase of the greenhouse effect from CO2 emissions will cause an even larger increase from a water vapor positive feedback amplification. They are claiming water vapor will also be the main cause of the increased greenhouse effect.
The evidence that there is a strong water vapor feedback is weak. That evidence is handicapped by inaccurate global average absolute humidity measurements since 1979.
The claim that manmade CO2 emissions increases the greenhouse effect has been supported by evidence collected over the past 127 years.
The evidence is ignored by te CO2 Does Nothing nitwits such as BeNasty who post ridiculous comment at this website.
WUWT feed them a CO2 Does Nothing article at least every week … like feeding a bone to a junkyard dog.
These junk science articles give the WUWT a bad reputation among leftists who completely ignore all the other good articles here.
The great mystery of CO2 emissions is the long term effect of various feedbacks. The claims range from no net change to an 8x amplification of a small warming effect from CO2. Almost no one is willing to say “we don’t know”
Almost no one is willing to say the past 48 years of actual global warming was very pleasant, in spite of 48 years of scary predictions of global warming doom.
For there to be any validity to your position on this subject Equilibrium climate sensitivity (ECS) would be nailed down by now. But it is not, this parameter is the lynch pin in the theory and by the FACT that there is nothing but guessing about it, after billions have been spent, cast much doubt on the premise. I know it’s hard to believe that mountains of opinions and published literature are all based on an unsupported theory, but that’s what the data shows. Atmospheric CO2 levels are merely a proxy to global ocean temperatures, on monthly to millennial scales, and on proxies as well as on carefully measured datasets.
It should be a much larger concern the amount of thermal energy introduced into the biosphere by energy (electricity) production and that far outweighs the miniscule, micro effects, of CO2 on temperature.
Coal only, used in steam turbine generators to produce electricity added enough thermal energy into the environment to raise the bottom 105 feet of the atmosphere a full 1C.
Indeed. And i wouldnt call it a ‘theory’. It remains a hypothesis if the data does not provide enough evidence to support it. Unless political motivation alters it. In fact THAT is the main ‘forcing’ agent in the whole system. And money swears. I am 99% sure that if there was NO political interference the whole ‘Co2 causes ( significant) temperature changes’ idea would remain an open question. The whole idea of ‘overwhelming evidence’ supported by independent trustworthy, non biased scientists is a construct we should simply abandon, for the mere fact that politics force an issue into a certain direction no matter what the subject. I dont think anybody can refute that. And there goes the trust in ‘the science’.
“The evidence is ignored blah, blah, blah…..”
Pitiful RG…You constantly show you are INCAPABLE OF PRESENTING ANY EVIDENCE.
Shall we try again???? Don’t run away little COWARD. !!
1… Show us some empirical scientific evidence of warming by atmospheric CO2
2… Show us some CO2 based warming in the UAH data.
3… How much warming has CO2 caused since 1979… give actual measurements and scientific evidence to back up your guess.
Richard wrote: “The claim that manmade CO2 emissions increases the greenhouse effect has been
supportedpropagandized byevidencespeculationscollectedfabricated over the past 127 years.”Fixed that for you! You’re welcome.
What do you think is the measurable physical effect of atmospheric CO2 at the surface of the Earth? If you can’t answer that, you should probably sit this one out.
And insulting those of us who know our physics better than you do is not a good look. If you’re worried about “reputation”, you should probably stop doing that.
Harold the Old Organic Chemist Says:
ATTN: Everyone
RE: CO2 Does Not Warming of Air!
Shown in the graphic (See below) are plots of temperatures in Death Valley from 1922 to 2001. In 1922 the concentration of CO2 in dry air was 303 ppmv (0.595g/cu. m. of air), and by 2001, it had increased to 371 ppmv, (0.729 g/cu. m. of air), but there was no corresponding increase in the temperature of the air in this arid desert site. Thus on the basis of the empirical data, it is concluded that CO2 does not cause warming of air in this arid field site, and by extension can not cause “global warming”.
On the basis of this empirical data, the claim by the IPCC since 1988 that CO2 cause global warming is fabrication and a deliberate lie. The purpose of this lie is to provide the UN the justification for the distribution of funds, via the UNFCCC and the UN COP, from the rich donor counties to the poor countries to help the cope with global warming and climate change. The amount of these funds is now many billions of dollars.
This is what all the rhetoric about greenhouse emissions, global warming, and climate change is really all about: the transfer of wealth from the rich to the poor. Hopefully, this fraud cannot go on forever.
NB: The graphic was obtained from the late John Daly’s website:
“Still Waiting For Greenhouse” available at: http://www.John-Daly.com. From the home
page scroll down to the end and click on the tab “Station Temperature Data” to obtain temperature data from weather stations at many sites around the world.
That plot hardly gets into this century. Here is a plot of monthly values to present:
And here are the monthly trends sonce 1970, units C/century
Jan 3.70
Feb 1.55
Mar 3.00
Apr 4.84
May 3.68
Jun 5.23
Jul 6.16
Aug 5.49
Sep 4.91
Oct 3.01
Nov 3.25
Dec 2.44
Plenty of warming there
ROFLMAO
The ever DISINGENUOUS Nick-pick starts in the 1970s. The New Ice Age scare period.
AGW mantra cherry-picking. !!
Most line show it is no warmer now than in 1910.
Where did you get these data? The data for the graphic is from the weather station at Furnace Creek where it was and still is measured to +/- 1 deg. For most of the weather stations in the US historical network temperatures are measured to the near whole degree. Your data looks like the raw data has undergone post measurement homogenization.
There might be another weather station at Badwater, but I don’t know if it is operational. Go to JD’s website and then go the Death Valley data entry. There is a link to his essay about temperature measurements problems Badwater.
here
I stand by what I posted: There too little CO2 to cause warming of
air.
The data is from GHCN V4. It has been converted to deg C. It has not been homogenised.
The station at Furnace Creek moved by about 0.4 miles in 1961.
And over the whole record shows basically no warming.
And if it is GHCN V4.. it has almost certainly been altered from original measurements.
“And over the whole record shows basically no warming.”
�
“a) Average annual temperature in Death Valley, California, as measured at the Furnace Creek meteorological station, (b) satellite image of Death Valley. Circles mark alluvial fan sampling sites (see Table 1 for key). Square denotes National Park Service’s Furnace Creek Visitor Center and meteorological station, (c) satellite image of Sidewinder Canyon alluvial fan, (d) examples of channel and desert pavement sites on alluvial fan.”
https://www.researchgate.net/figure/a-Average-annual-temperature-in-Death-Valley-California-as-measured-at-the-Furnace_fig1_332399096
And Banton the idiot uses just from 1970
That is NOT the whole record.
You are a complete moron, fooling only yourself.
Here is my attempt to show that image
Why does your data show a slight increase in temperature after ca 1970 and JD data does not?
Could you plot the average annual temperature for your data?
Consider this: At the MLO the concentration of CO2 is 422 ppmv in dry air. One cubic meter of this air has a 0.829 g of CO2 and a mass of 1.29 kg at STP.
At 70 deg. F and with 70% RH, the concentration of H2O is 14,780 ppmv. One cubic meter of this air has 14.3 g of H2O, a mass of 1.20 kg and only 0.77 g of CO2. To the first approximation, the amount of the greenhouse effect (GHE) due to H2O is given by:
GHE=molesH2O/molesH2O+molesCO2=0.79/0.81=0.97 or 97%.
This small amount of CO2 can heat up such a large mass of air by a very small amount if at all. H2O is the major greenhouse gas and it covers 71% of the earth’s surface. CO2 is a minor trace greenhouse gas. We really do not have too worry too much about CO2.
There is a plot of annual temperature just above. It shows a trend of about 4C/century.
and “no thermometers were harmed in the making of this graph”?
Nice that you purposefully omitted any negative trendlines.
I am not sure about his final conclusions. It is possible from first principles (curry 2010, Lindzen 2011, Monckton ~2016) to show that the no feedbacks ECS of CO2 is between 1.1 and 1.2 (Monckton’s paper equation using his inputs gives 1.16). With water vapor and clouds, models now say about 3.4. Pretty big tail on a pretty small dog.
.
We can go further using Ceres clear sky/all sky. Dessler first published in 2010 that clouds were about zero feedback, maybe slightly positive. McIntyre in 2011 redid that paper using more like to like data, and concluded about zero, maybe slightly negative. So clouds are zeroish.
Even IPCC says the net of all else is also about zero.
So the feedback multiplier on no feedbacks CO2 is just water vapor.
Observational ECS is about 1.7, so about a (1.16/1.7) 0.7x multiplier. So the dog appears somewhat bigger than the tail on further analysis.
“Observational ECS is about 1.7,”
ISTVAN
Wrong
The ECS of CO2 can not be observed
1,7 degrees C. is a simpleton guess claiming all measured warming since 1975 was caused ONLY by CO2. I believe using UAH data. The ECS would be about 2.4 using the higher surface temperature numbers that likely overstate warming.
The ECS of CO2 can only be estimated using lab spectroscopy with guesses about feedbacks.
The primary error of climate science is wild guessing the ECS of CO2. And you have just made that primary error.
Especially when there is ZERO evidence of CO2 warming in UAH data.
RG has shown that many times.
Only warming comes at EL Nino events.
ECS is likely to be basically ZERO.
It’s worse than zero… it’s based on an incorrect assumption about which is the cause and which is the effect. It should really be an “atmospheric CO2 level sensitivity to temperature”, in ppm/°C, if anything.
They say a picture is worth a thousand words. When you “watch” from space on the “CO2 Longwave IR” band 16, it is readily understood that the formation and dissipation of clouds, the presence of areas of higher and lower water vapor content, and the prevalence of overturning circulation completely dominate the regulation of longwave emission to space.
Here is a still image as an example.

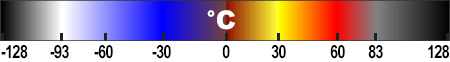
Color scale of “brightness temperature” used for visualizing the radiance. The longwave emission at 50C (red) is 13 times stronger than at -90C (white).
Put it in time lapse motion, and it becomes even more obvious that the radiative effect of incremental CO2 cannot be isolated for reliable determination by any means presently available to us. I don’t mean this as a criticism of the Koutsoyiannis paper, I’m just pointing out how the available satellite images help us see how it all works more directly.
https://youtu.be/Yarzo13_TSE
There’s no way that could be determined by the image you posted.
A warmer atmosphere holds more water vapour. More water vapour means more precipitation.
Ask Spain.
“There’s no way that could be determined by the image you posted.”
Try thinking about it in terms of effective radiating level. The range in the image and in the video is from (near) the surface all the way to the top of the troposphere. The case of 2XCO2 would imply less than a 200m change. This is the proverbial needle in a haystack, and the haystack is constantly being shuffled.
You mean the Spanish floods in the past that have been far larger than the recent one ?
The one with the headline “Deadliest floods in DECADES”
There is no way you can present any evidence that CO2 has caused any warming or affected the weather in any way.
1… Show us some empirical scientific evidence of warming by atmospheric CO2
2… Show us some CO2 based warming in the UAH data.
3… How much warming has CO2 caused since 1979… give actual measurements and scientific evidence to back up your guess.
For your education fungal
Floods in Spain have a LOT of history
Try not to remain ignorant and gullible.
Study of historical flood events on Spanish rivers using documentary data
Looks like your fact check starts and ends with the grauniad:
Eh? Spain is too busy clearing up after the reoccurrence of an extreme weather event that has a long history of happening, the effects of which were magnified by the combination of increasing population and stupid political decisions to remove some mitigation measures. They don’t have time to answer dumb questions.
To show why the Band 16 wavelengths are relevant to the question of incremental CO2, please see this plot of Modtran model outputs of 280 ppmv CO2 vs 560 ppmv. Band 16 is highlighted in magenta.
https://drive.google.com/file/d/175qnVngPPfZJKUPUH13u6t5wolTBl0qi/view?usp=sharing
“The longwave emission at 50C (red) is 13 times stronger than at -90C (white)”
The simple S-B relationship for a “black body” has (323/183^4) at about ten. The measurement of “13 times stronger” means an even greater negative feedback than simple theory. Why are we worrying over trivial temperature changes in the face of such strong evidence?
Good point. And just for the record, my “13 times” value comes from the empirical equation and constants from the imager’s user manual, from which I plotted this curve. https://drive.google.com/file/d/1qy4QnSkaJZeLIeC4R7-600ZuctPEUwaz/view?usp=drive_link
And about the significance of the fourth-power relationship, NASA knew in 2009 that a runaway climate response is therefore not possible. “This large increase in heat loss in response to a relatively smaller increase in temperature—referred to as radiative cooling—is the primary mechanism that prevents runaway heating on Earth.”
Source:
https://earthobservatory.nasa.gov/features/EnergyBalance
It is the radiative heat loss increase that is a primary limit on the growth of daily Tmax values. It seems like climate science doesn’t recognize that the Earth radiates heat away even during the day. And as the daytime temp goes up the radiative heat loss goes up a higher rate, maybe not T^4 but something more than a linear increase. It’s why the “global average” is driven more by an increase in Tmin than in Tmax.
Another case of: learn the basics!!!
https://greenhousedefect.com/
It is so tragic because the whole climate change agenda would be over, if people only knew about the basic physics. It would be easy to communicate the fatal flaws in the “science”, and sure some would find out about these themselves.
Instead we have these kind of “contributions” only prolonging a totally unnecessary struggle..
They yammer on about “downwelling longwave IR” but no one has ever measured or demonstrated any…
Umm… it is easily measured, and just as easily one can show it is not related to the GHE. On top of that even the IPCC debunked it. What are you talking about? What is Koutsoyiannis talking about? It is getting more and more surreal..
I have never seen anyone measure (positive, in case that wasn’t clear) downwelling longwave IR from the atmosphere at ambient temperature at the surface of the Earth (preferably at night, to eliminate stray solar influences). Have you? Also, where did the IPCC debunk the notion of DWLWIR? I missed that. The entire field of climate “science” still relies on it, as far as I can tell. I agree that the whole thing is surreal, for sure.
Just look up the glossary of AR5 (or 6) where they dropped “back radiation”, as opposed to AR4.
They may have dropped the phrase “back radiation”, but their diagrams are still full of this nonsense, e.g. see their Fig. 7.2 in the WG1 report of AR6 on page 934, which purports to show 342 W/m^2 of “down surface” radiant power in the “thermal”, i.e. longwave, band in all-sky conditions (or 314 W/m^2 in clear-sky conditions). You say po-TAY-toe, I say po-TAH-toe…
You didn’t answer my question about measuring this downwelling longwave infrared power, either. Are you going to answer that?
The concept of back radiation and “positive” feedback *should* result in soaring Tmax predictions as CO2 blocks daytime radiation toward space caused by the sun’s insolation during the day. And that *is* what climate science has predicted for more than 30 years – an Earth where the oceans will boil. Yet that does *NOT* track with what the Earth is actually experience where most of the increase in the mid-point global temperature is driven by Tmin growth and not Tmax growth. It’s pretty hard to pretend that CO2 blocks nighttime radiation to space while it doesn’t do the same during the day.
Yes, the nonsense is still all over the place. “Climate science” does not like to address its mistakes, at best they just silently walk away from it.
How to measure it? There pyrgeometers, or simply FLIR cams..
So, you have no clue how either pyrgeometers or IR cameras work, then? Can you explain the two separate terms of the “pyrgeometer equation” to me, and the physical justification for each?
Ok, after going through this 43 pages rant of nonsense I see what I expected to see. There are plenty of basics Koutsoyiannis does not understand. And this incompetence is the basis for his work.
..and I could prolongue the list. And that is despite he could have found so much subject matter, important issues with “the science”, if only he knew what he was doing. Instead, well..
What do you think is the difference between “net” power and “gross” power? Can you define these differences in terms of standard physics concepts of “work” and “energy”? (which themselves do not appear in “net” and “gross” variants, certainly not in any of my textbooks)
It seems to me that Koutsoyiannis knows his physics much better than you do.
GH-agents overlap each other. A good share of the GHE is thus overdetermined and caused by two or even more agents. As with CO2 you therefore need to distinguish between the part CO2 contributes exclusively and the part it contributes overlapped with other agents. Thus net and gross, or “single factor removal” and “single factor addition”.
An accurate attribution looks like this..
So, there seem to be a lot of fictional numbers in that table. Where and how can I measure the “net” and “gross” 19 and 34 W/m^2 RGHE from CO2?
I am not your nanny..
I’m not asking you to be my nanny. I’m asking you to back up your claims with evidence, like some sort of scientist. What have you got?
Water vapor can change the slope of the lapse rate. CO2 cannot.
This is why CO2 is not the driver. Any change in the effective radiation height due to CO2 will be neutralized by a change in the lapse rate slope due to H2O.
If vw was a positive feedback to co2 none of us would be alive to argue the point.
Or from the great RGB if it can happen it would have already happened in the past.
Demetris Koutsoyiannis is and always has been a science denying CO2 does almost nothing fool
The MOTRAN model would predict about +1 degree C. of warming for CO2 x 2, which would take a long time and would be harmless.
Humans can not increase water vapor for more than a few days with irrigation, before returning to Earth as rain or snow.
Water vapor only increases in the long run if the atmosphere gets warmer.
There is evidence that absolute humidity has increased with global warming since 1980. The data are not very accurate but they do support the existence of a water vapor positive feedback theory.
Demetris Koutsoyiannis apparently knows none of this because he is a fool
According to current scientific understanding, water vapor contributes the most to the greenhouse effect, accounting for roughly 50% of the total effect, followed by clouds at around 25%, and carbon dioxide (CO2) at approximately 20%
The root cause of the INCREASE of the greenhouse effect is almost entirely due to manmade CO2 emissions.
Again, RG goes on yet another JEALOUS and mindless Tourettes-style rant..
…. pertaining to NOTHING. And complete AGW-mantra BS. !!
1… Show us some empirical scientific evidence of warming by atmospheric CO2
2… Show us some CO2 based warming in the UAH data.
3… How much warming has CO2 caused since 1979… give actual measurements and scientific evidence to back up your guess.
He continues to be a complete FAILURE by running away from answering these questions.
Koutsoyiannis has at least 2 to 3 MAGNITUDES scientific knowledge and integrity than RG will ever have.
BeNasty loves to follow my science related comments with his usual burst of junk science flatulence
Poor little RG.. continues to be a ranting scientific NON-ENTITY.
His comment was NOT science related.. it was rant related, with zero actual science, just baseless opinion.
And he knows it.
FAILS yet again to answer any of the three questions… uses mindless bluster instead..
Hilarious and Totally PATHETIC.
You are amazingly arrogant! Everyone is a fool or idiot to you. Is it possible you haven’t found the patsy at the poker table yet?
That is why it’s best to ignore him. Dont make eye contact w a drunk! 😊
This paper might be fascinating as far as we can see the “scientific”
elite at their worst suppressing criticism of their pseudoscience, but is
otherwise pointless. Since, as other previous contributors have pointed
out, there is no greenhouse effect, 5% (compared to water vapor’s alleged
95%) or 100% (assuming water vapor readily condensing out from the
atmosphere nullifies its greenhouse effect, which is just plain dumb), if it
is of nothing, both come to . . . nothing. No gas in the atmosphere, H2O
or including, especially, hardly existing CO2 (present in the air usually at
around 1/20 of water vapor levels), appreciably warms the surface of the
Earth through its physical absorption of outgoing, longwave infrared
radiation emitted from the surface of the Earth (which, I presume, is what
is meant by the “greenhouse gas effect”).
When we talk about the warming of the Earth, what we are talking about
is the immediate or ultimate warming of the SURFACE (or near to it) of the
Earth. Any other warming is utterly irrelevant when discussing weather,
temperature, or climate since that warming will have no effect on the
environment from a human perspective. Thus, for instance, warming air
thousands of feet above the surface means nothing for these purposes —
that’s not where people live. The thermosphere’s temperature sometimes
reaches well over 1000°F, but no one is seeming to get too excited about
it.
What warms the surface of the Earth is sunlight making its way down to
the surface where it is absorbed by the condensed matter it encounters there
(liquid water or solid ground — ice reflects this electromagnetic energy
and so essentially has no surface warming effects due to sunlight incident
on it). The actual warming, in this dynamic situation, comes from the TIME
OF RETENTION of the large amount of heat absorbed which could warm the
Earth’s surface if it doesn’t quickly go back into outer space. Most
visible or infrared radiation absorbed by the atmosphere (going in either
direction) doesn’t matter because the atmosphere is too insubstantial or too
far away from the surface to absorb or emit heat on a large enough level
comparative to what liquid water or the ground can do. Since a good deal of
sunlight or reemitted infrared coming through our atmosphere is not absorbed
by that atmosphere (anywhere near Earth’s surface), even that doesn’t
contribute to the warming of the Earth. And any heat radiation leaving
Earth’s surface can only have a secondary effect in retaining the heat that
originally came from the sun. And if that latter heat is not retained for a
long enough time, there is little warming effect on the surface of the
Earth.
The atmosphere contributes greatly only through keeping the heat of the
condensed matter on the surface of the Earth from not radiating back into
space by limiting the convection of that heat into higher altitudes.
Instead, the heat of the surface stays near the surface longer due to the
atmosphere near the surface heating and then not quickly allowing that heat
to convect. But though this is surely an atmospheric effect, it is not a
“greenhouse” atmospheric effect (in the sense defined above of what a
“greenhouse gas effect” is). Ironically, this anti-convective “warming” is
indeed the major warming effect inside an actual greenhouse (the glass of
the roof of an actual greenhouse is the culprit there, not CO2 nor H2O!),
but that is not how the term is used by the global warming wackadoodles —
leave it to them to get everything thoroughly “babelized”.
Therefore, focusing on heat flow imbalances at the top of the atmosphere
is never a wise move — there is no way scientists can understand all these
heat flows up there to sufficient accuracy to come up with informed
predictions down here, which should be our focus of interest.
Getting to what’s happening down here with the anomalous warming of the
surface of the Earth over the last 200 years occurring while our atmospheric
pressure has not changed (and therefore the convective properties of the
atmosphere having remained constant), this is an effect that could be laid
at the doorstep of the oceans of the Earth. I suggest that some of that
warming is coming from a change in the oceans causing them to retain the
heat of sunlight falling on them for a longer time, which I assert derives
from their ever-increasing pollution levels, in turn, caused by human
activities using the oceans as our ultimate dumping grounds (rivers flow
into the oceans, but the oceans don’t flow into anything else) occurring
during those same 200 years.
David Solan
“downwelling and outgoing longwave radiation”
What downwelling longwave radiation? Can you show me this phenomenon?
Experiments show CO2 has a zero emissivity at atmospheric temperature and pressure.
The plot says nothing of the kind. You have no idea how to read it.
It also didn’t answer my question, so I have no idea why he posted it…
Sure, but it is the CHANGE that matters in forcing differences. Did water vapour change as much as CO2 in the last century?
It did, when you combust a gallon of hydrocarbon-based fuel, you get an equivalent number of H2O molecules as CO2 molecules in the exhaust.
The greenhouse effect is simply the lapse rate times the effective radiation height. 6.5 x 5 = 32.5 C
Remove the water the greenhouse effect becomes 9.8 x 5 = 49 C
Add water and the greenhouse effect becomes 4 x 5 = 20 C.
This is a HUGE negative feedback and completely explains the stability of earth’s climate is due to water and the work done by convection.
Water vapor is 5% of the atmosphere, condenses at altitude and cycles in 10 days as rain. CO2 will saturate the rain drop as it forms due to conduction (kinetic collision). As a result rain water is acidic. Ph 5.5. Ocean acidification remember. Carbonic acid.
This suggests a 100% turnover of dissolved CO2 in 10/5% = 200 days. 7 months.
The pH of the open ocean is ca. 7.9-8.1 The buffer is mixture of carbon dioxide (0.5%), bicarbonate (85%) and carbonate (14.5%). All the plants and animals respire, and the emitted CO2 is converted to bicarbonate.
If water vapor is in equilibrium with the oceans how do we have clouds.
H2O vapor is not in equilibrium with the ocean because the winds are constantly sweeping enormous amounts of H2O and H20 vapor into the air. As the H20 vapor rises due to convection it starts to cool, and then form clouds
The lapse rate creates the green house effect, yet nowhere in the formula for the lapse rate does CO2 appear except as a minor role in the heat capacity of air. Water on the other hand has a huge role in the lapse rate.
CO2 is like having a control knob on an amplifier that goes from 0 to 0.0001
Missed by a decimal place (add one more 0) and a percentage sign, but otherwise, yes.
I did the calculations and posted those in an earlier comments page.
Neither CO2 nor water as vapor affect the lapse rate significantly (and neither appear in the formula). Water only has an effect if it condenses, releasing latent heat.
Here is part of my Blogpost https://climatesense-norpag.blogspot.com/Thursday, October 13, 2022The Rules of the Lebensraum game.
1. SUMMARY
A battle for Lebensraum, i.e. energy,land, and food resources, broke out when Russia invaded Crimea.An associated covid pandemic, and global poverty and income disparity increases now threaten the UN’s Sustainable Development Goals. During the last major influenza epidemic in 1919 world population was 1.9 billion. It is now 7.8 billion+/ – an approximate four fold increase.
The IPCC and UNFCCC post- modern science establishment’s “consensus” is that a modelled future increase in CO2 levels is the main threat to human civilization. This is an egregious error of scientific judgement. The length of time used in making the models is much too small .
A Millennial Solar ” Activity” Peak in 1991 correlates with the Millennial Temperature Peak at 2003/4 with a 12/13 year delay because of the thermal inertia of the oceans. Since that turning point Earth has entered a general cooling trend which will last for the next 700+/- years.
The amount of CO2 in the atmosphere is .058% by weight. That is one 1,720th of the whole. It is inconceivable thermodynamically that such a tiny tail could wag so big a dog.There is no anthropogenic CO2 caused climate crisis.
Because of the areal distribution and variability in the energy density of energy resources and the varying per capita use of energy in different countries, international power relationships have been transformed. The global free trade system and the global supply The global free trade system and the global supply chains have been disrupted.
Additionally, the worlds richest and most easily accessible key mineral deposits have been mined first and the lower quality resources which remain in the 21st century are distributed without regard to national boundaries and differential demand. As population grows,inflation inevitably skyrockets. War between states and violent conflicts between tribes and religious groups within states will continue to multiply.
Yes, water vapour beats Co2 by a margin of x and it reacts pretty quickly. The main ‘influencers’ are the oceans. It drives the big wheels of energy transfer and moves in multi decadal cycles. Together they have a monopoly that changes both temperature and humidity if we disgard sun- Milankovic cycles etc.
The proponents of Co2 ‘forcing’ get upset real fast, almost as if they deep down know their case is weak and need to offset that by hammering down a compensatory hammer to drown out their own doubt. ‘Overwhelming evidence’ comes to mind which is always a red flag.