by Frank Bosse
Neither the trend analysis nor the model-observation comparison supports the conclusions of the attribution study that found:
“The combined change, attributable to human-induced climate change, is roughly a doubling in likelihood and a 7% increase in intensity.”
Starting September 11, there was a heavy rainfall event in parts of Austria, Poland and the Czech Republic. First assessments point to a record high value of precipitation in a wide area, as the result of a “Vb weather condition”, named after the historical classification of the tracking directions of low-pressure fields in Europe. In a Vb weather condition, a low pressure area tracks to the Mediterranean Sea, thereafter north-eastward and ends usually in the Baltic region of Europe. A Vb condition is very often associated with much rain in Mid-and Eastern Europa and flood events e.g. 1997 (River Oder) and 2002 (River Elbe).
However, an “Attribution study” appeared only a few days afterwards. It’s Core message about the event (cited in media) was:
“The combined change, attributable to human-induced climate change, is roughly a doubling in likelihood and a 7% increase in intensity.”
To evaluate the robustness of the claim, the full text of the attribution study was downloaded.
The meteorological classification of the event in question involves several atmosphere dynamics features. The triggering event was an “Arctic Outbreak”, an extreme northward displacement of the intertropical convergence zone (ITCZ) was also involved. To make the things worse, there was a stable blocking high pressure field north of the area in question, so the precipitation area was relatively stationary and could not move north towards the Baltic Sea as usual.
The key question is whether the thermodynamic element (related to warming from “climate change”) contributing to the events described can actually be quantified with some robustness, as it was claimed in the attribution study.
The attribution study describes trend analyses of observational data (E-Obs.) and (weather) model-observational reanalysis data (ERA5) for the time 1950-2023 (2024). The data used are available via the “KNMI Climate Explorer” permitting one to evaluate the numbers. The study uses the GMST GISS Dataset to describe the connection of heavy rain in Mid Europe to a warmer world. The attribution study states:
“All datasets show similar trends across the region, with increasing trends…” (see section 3.1)
The same dataset is used here, but averaged over the European area in question rather than globally. The mean temperature anomaly 1950-2023 in the region 20°W-25°E; 35°N-65°N is shown below. This region includes more land (which is faster warming than the ocean) than the roughly 30% global mean land fraction.

Fig.1: The temperature time series (GISS) in the European area. The figure was generated with the KNMI Climate Explorer.
The (not too surprising) observation: From 1950 to about 1981 the temperatures did not show any rise. Anthropogenic warming, manifested in the mean temperatures, started around 1981, not 1950.
To calculate the trends in the “RX4days” precipitation (which is the accumulation of 4 days of precipitation) the data for ERA5 were recalculated for 1950-2024:

Fig.2: The outstanding event in September 2024 is clearly visible. It makes the trendslope 1981-2024 ( green) positive (a “one year trend”), for 1981-2023 (black) it’s zero. The figure was generated with ChatGPT.
The ordinary least square (OLS)-Trend 1950-2024 (blue) is robustly positive (p=0.025) as the attribution study states. However, it did not mention that the trend become insignificant after the late 1960s when calculated to 2024. If the increasing trend from 1950 to 2024 were attributable to the “human induced climate change” after 1981, one would NOT expect that the trend slope to 2024 is completely insignificant (p=0,32) and for 1981-2023 (black) it’s zero. In the light of these findings the OLS-trends to 2024 might be more a result of internal variability. Over the period 1950-1981 with no warming (see Fig. 1), the most positive trend slope (orange) of RX4day was 2 times steeper than in 1981-2024, when the forced warming was observed.
The study evaluates the climate models used for the attribution analysis. Many models belong to the CMIP6 family. It iss well known that those models face substantial difficulties when it comes to atmosphere dynamics owing to their low resolution. The Multi Model Mean shows no skill in the study area (46°N- 52°N; 11°E- 24°E) with respect of the model-observation (E-Obs.) spatial correlation for precipitation.

Fig.3: The spatial correlation between precipitation of the CMIP6 Multi Model Mean with the Observations (E-Obs.) for the warm seasons 1975-2023. The figure was generated with the KNMI Climate Explorer.
A meaningful correlation should be a prerequisite for blaming the anthropogenic warming as simulated in the CMIP6 models, for a distinct extreme precipitation event based on model comparisons with the real world.
In Table 4.1 of the attribution study the models were evaluated, some of them (only a few) were labelled as “good” when it comes to precipitation. The “IPSL-CM6A-LR” model was labelled as “reasonable”. The spatial correlation 1950-2023 to E-OBS observations during months where Vb-events were observed is shown below, also for the “good” model “EC Earth 3”, both with below 20%, indistinguishable from random noise:

Fig. 4: There is no skill (white for the zero- correlation) in selected models of the study. The figure was generated with the KNMI Climate Explorer.
Neither “IPSL-CM6A-LR” (left) nor in “EC Earth3” (right), labelled as “good” in the study, have any skill when it comes to the spatial correlation of precipitation with the real world. Nor does the model MPI-ESM1-2LR (“reasonable” in Table 4.1 of the study), but not shown here.
In the end it seems dubious to attribute an extreme precipitation event to climate change when using the CMIP6 models. The ocean warming is for sure a source for more evaporation and also for more rain, although the proportional rise in precipitation with warming is only a fraction of the rise in evaporation.
However, the influence of atmosphere dynamics is overwhelming and hampers the attribution of single extreme weather events based on thermodynamics arguments.
Conclusion
After a closer look, neither the trend analysis nor the model-observation comparison supports the conclusions of the attribution study.
The issue of unsound extreme weather event attribution studies is not limited to extreme precipitation. As this recent article by Roger Pielke Jr explains, attribution studies for all types of extreme weather event are in general highly dubious, and appear to be undertaken more for “political” than for scientific purposes.
It doesn’t matter a jot provided you accept the global warming is NOT due to man made carbon dioxide. This has been proved scientifically many many times.
The CGW crowd is not interested in reality, they attribute the extremes to “carbon pollution”. Sure, somewhere there is a flood, and somewhere there is a drought, and in between is the perfect porridge for Goldilocks. If you want another example, consider: Oh somewhere in this favored land the sun is shining bright…… But there is not joy in Mudville–mighty Casey has struck out. Get it? MUDville. My apologies to author Ernest Lawrence Thayer.
_____________________________________________________________________________
The IPCC says:
IPCC AR4 Chapter Ten Page 750 pdf4
Mean Precipitation
For a future warmer climate, the current generation of models indicates that precipitation generally increases in the areas of regional tropical precipitation maxima (such as the monsoon regimes) and over the tropical Pacific in particular, with general decreases in the subtropics, and increases at high latitudes as a consequence of a general intensification of the global hydrological cycle. Globally averaged mean water vapour, evaporation and precipitation are projected to increase.
Precipitation Extremes and Droughts
Intensity of precipitation events is projected to increase, particularly in tropical and high latitude areas that experience increases in mean precipitation. Even in areas where mean precipitation decreases (most subtropical and mid-latitude regions), precipitation intensity is projected to increase but there would be longer periods between rainfall events. There is a tendency for drying of the mid-continental areas during summer, indicating a greater risk of droughts in those regions. Precipitation extremes increase more than does the mean in most tropical and mid- and high-latitude areas.
More rain and more drought. Looks like the IPCC wants it both ways.
As far as the United States is concerned it looks like the more rain part is true.
Source saved chart from NOAA’s Climate at a Glance
Europe’s worst flood on record was in 1342.
Here we are nearly 700 years later, and “climate change” still hasn’t caught up.
Everything that the Climate Crusade claims as due to increased greenhouse gas has either happened before or has been happening right along. At least that what I see from my window on the world. Thanks for the 1342 tidbit.
The list of floods in Europe (Wikipedia) begins in 120 to 114 BCE, and there are more than I care to count.
You will always find something if that’s all you’re looking for. And …. “The figure was generated with ChatGPT.”
What do have against a figure with data when it was generated with AI??
It was bone dry in September right up to a few days ago here in Wokeachusetts. So, it rains heavy in one place and dry in another. What else is new?
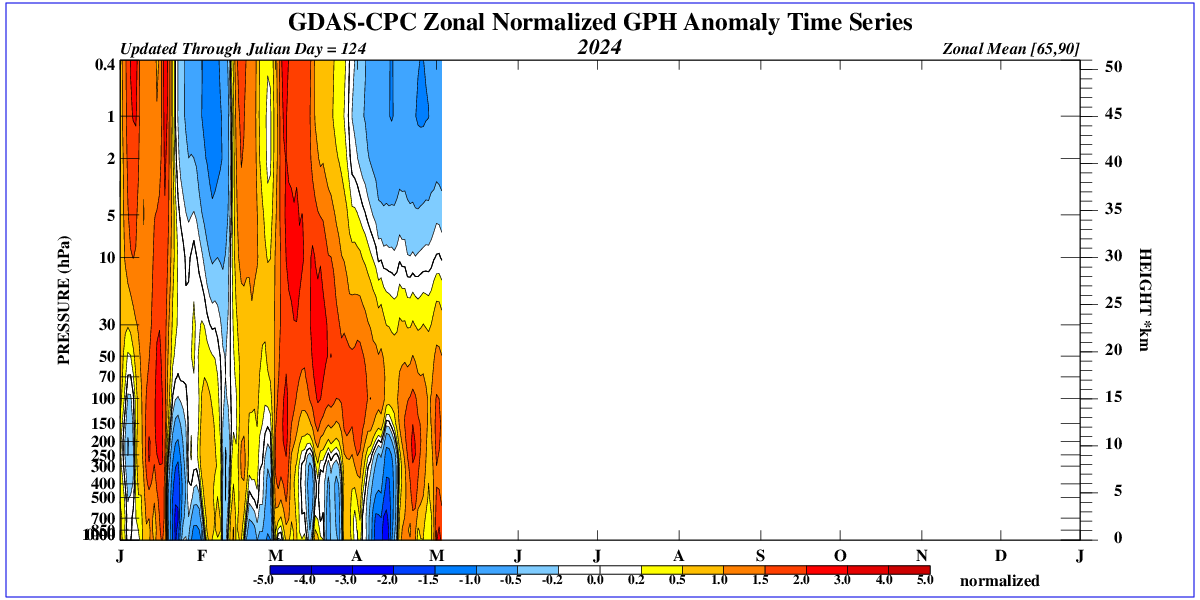
The increased pressure in the stratosphere over the Arctic Circle cannot be linked to CO2 in any way, what’s more it’s not over and heralds the flow of Arctic masses into the mid-latitudes.
Story tip
Reaching people who believe extreme weather events are ‘natural’
The Act of Man initiative reframes climate disasters as human acts and urges a shift in thinking and action.
https://mashable.com/article/extreme-weather-events-not-natural?test_uuid=01iI2GpryXngy77uIpA3Y4B&test_variant=b
The translation of this article in my words: In order for ‘climate change’ have made a particular weather event more likely there must be an increasing trend in that event. That is a necessary (but not sufficient) condition. Since there is no increasing trend (one event is not a trend), we have to go no further to determine that the claim of attribution is not valid. If they ever actually identify an upward trend in one of these events, we can then start discussion of the sufficient conditions to determine if ‘climate change’ ie, human generated CO2, is making them more frequent.
Your translation is incomplete. The claim in the paper is: Also with an insignificant trend we can make attributions: with the help of climate models. We “switch off” the climate change (after the 80s) and compare what we get in relation to what is observed. The difference ( here precipitation) is due to climate change. This assumes, that climate models are somewhat right when comparing the output with “climate change on” and the real world. The main post showed, that this is not the case. Therefore also this “line of evidence” fails when it comes to precipitation.
Best Frank
I thought it was widely known that the Tonga undersea eruption a couple of years ago was responsible. Scientists said at the time, that the millions of tons of water that erupted into the stratosphere would alter the weather for about 4 years, including a lot of rain. 17% extra moisture has to go somewhere, all of it downwards.
Yet more proof that the CAGW crowd have nothing to back up what they say. They are scraping the bottom of the barrel.
model you dont neeed no stinking model all you need is physics
Antarctica is incredibly dry because of a combination of factors:
The tropics are a region of Earth that circles the globe near the equator. It’s known for its lush rainforests, vibrant ecosystems, and, of course, abundant rainfall. Here’s why the tropics are so wet:
Global warming leads to more intense rainfall due to a fundamental principle of atmospheric science: warmer air holds more moisture. Here’s a breakdown of the process:
we absolutely have proof that warmer air holds more moisture! It’s a fundamental principle of atmospheric science and is supported by both empirical evidence and theoretical understanding. Here’s how we know:
1. Empirical Evidence:
2. Theoretical Understanding:
Visualizing the concept:
Imagine a sponge representing air. A cold sponge has smaller pores and can’t hold much water. A warm sponge has larger pores and can hold more water.
This increased moisture-holding capacity of warm air has significant implications for weather patterns, climate, and even our daily lives. It explains why we have rain, snow, clouds, and many other weather phenomena.
Blind copy-paste without attribution
Sure as heck mosh didn’t write that himself. !
Mosh missed that more water vapor in the air actually reduces air density making it more buoyant and driving the atmosphere toward slightly stronger convection. We know this for hurricanes, warmer sea temperatures…blah…blah…but somehow don’t mention this much when clear skies allow warm sea surface temps generate more water vapor which convects upwards…This forms clouds somewhere, often dozens of km.away a day or two later. On a more immediate scale, thunderstorms are an example of this effect that are strong enough to observe “as we watch”.
These clouds then reflect the incoming solar back to outer space during the day. This in much larger wattages per sq.M. than the clouds block the IR transmission to cold outer space at night.
Evaporation forming sunlight reflecting clouds on a very large scale is what controls the Earth’s temperature on average.
As Mosh has stated…the Clausius Clapeyron equation…also cloud formation as it temp drops below dewpoint, air buoyancy with H2O content, lapse rate temperature drop with altitude as air parcels rise, local reflectivity of clouds versus ocean water.
Hi Steven, the thermodynamic issues are true of course, as the main post states:” The ocean warming is for sure a source for more evaporation and also for more rain, although the proportional rise in precipitation with warming is only a fraction of the rise in evaporation.”
The question was, if one “sees” the thermodynamic in the real outcome of one event in September 24. The attribition paper uses trend analyses AND model comparisons to respond: yes. As you wrote: “you dont neeed no stinking model “. It seems that you bolster the outcome of the main post, that the using of models is “stinking” and has no merrit in this case? best Frank
For how many consecutive years has this been occurring? If it’s just for this year, isn’t it premature to concluded this will be an annual event? If drier-than-normal conditions were to occur in the same place or anywhere, would that be conclusive evidence of a major shift in climate? It seems to me that stories like this are a major reason that climate alarmists consistently lack credibility.
The calculation is: Make the sum of 4 contigous days ( Vb events usualy occur during May-September) and look for the Max. fo these amounts. So it’s not premature for 2024.
Given the Hunga-Tonga eruption in 2022, isn’t the weather more likely to be unpredictable or unprecedented over the next few years? Nobody’s weather models account for that event or its lingering effects.
When we have an extended period of warm weather the ‘culprit’ is ‘blocking’ caused by the Jet Stream. When we gat extensive rain it’s Global Warming!
Of course not. Start to learn…