Guest Post by Willis Eschenbach (@weschenbach on eX-Twitter)
I love science because of the surprises. Today I had several. My first surprise today was evidence of strong negative feedback in surface temperature. Let me note that I’m not claiming I’m the first person to make these observations. I’m simply saying, it was surprising to me.
My method of scientific investigation is graphics-based. I take chunks of numbers, sometimes tens of thousands of them, and display them graphically. And at times the result is what I expected, or even hoped for.
Other times, though, my latest graph comes up on the silver screen and I say “Whaaa?” … those are the surprises that make it all worthwhile. And those are where interesting meandering paths start. Come amble with me along one of those paths.
As the result of a series of misunderstandings and coincidences, I ended up taking a look at the month-by-month changes in the net effect of clouds on radiation. “Net effect” refers to the fact that clouds both warm and cool the surface.
Cooling occurs as a result of clouds blocking the sunlight from hitting the ground by reflecting sunlight back out to space or by absorbing the sunlight. Either way cools the surface.
Warming occurs from that part of the thermal radiation emitted by the clouds that hits and is absorbed by the ground.
“Net effect” is the difference between the two opposing effects—including both effects, are the clouds warming or cooling the surface, and by how much?
Unsurprisingly, this is known as the “surface net cloud radiative effect”, or the “surface net CRE”, hereinafter “CRE”. When the CRE is negative, it means the net radiative effect of the clouds iscooling the surface. Correspondingly, a positive CRE means clouds are warming the surface via radiation changes. Figure 1 shows the 24-year average of the CERES satellite record of the net surface CRE.

Figure 1. The effect of clouds on the net total of radiation (longwave and shortwave) absorbed by the earth’s surface. The horizontal dashed lines near the equator mark the edges of the tropics (23.5° N/S). The horizontal dashed lines near the poles are two polar circles (66.5° N/S). Units are watts per square meter (W/m2).
There are some interesting things about Figure 1.
• Overall, clouds cool the surface by about -19 watts per square meter (W/m2)
• The ocean is cooled almost three times as much as the land.
• The areas polewards of the two polar circles are warmed by clouds.
• The only areas warmed on average by the clouds are those polar regions and the deserts.
• The greatest cooling is at the inter-tropical convergence zones just above the Equator and the Pacific Warm Pool north of Australia.
What I’d never looked at, though, is the month-by-month record of the surface net CRE. Of course, to look at that we need to look at the hemispheres separately, to avoid the effects of the opposing seasons in the two hemispheres. Figure 2 below, showing northern hemisphere variation by month, was my first surprise.

Figure 2. Monthly net surface cloud radiative effect, northern hemisphere.
I did NOT expect the effect to vary from slight warming in the winter to -40 W/m2 cooling in the summer. That is a giant swing in the effect of the clouds.
It was also interesting to see the net cooling effect of -0.2 W/m2 per decade. The decadal increase in CO2 forcing was +0.27 W/m2 (95% CI: 0.22 W/m2 – 0.32 W/m2). So over the period of record, the small change in surface CRE is of the same order of magnitude and is acting in opposition (cooling) to any warming effects of the CO2 forcing.
Of course, that got me to wondering how much difference not having the radiative effect of clouds would make in the summer and winter temperatures … which led me to create Figure 3.

Figure 3. Current northern hemisphere summer temperatures (black), and theoretical temperatures without the clouds’ radiative effect (other things being equal, which of course they never are). Values in all instances were done in units of W/m2, and then converted to temperature using the Stefan-Bolzman equation with an assumed emissivity of 0.95.
So instead of northern hemisphere peak average summer temperatures being around 72°F (22°C), without the varying radiative effects of the clouds they would be about 84°F (29°C). Yikes! And winters would be slightly colder as well.
(And yes, I’m aware that without clouds a bunch of other things would change, so my graph is pure theory. I’m just trying to give folks a sense of just how huge a swing of cloud cooling from +5 W/m2 in winter to -40 W/m2 in summer actually is.)
Intrigued, I decided to take another look at the whole globe as in Figure 1, but this time for the northern hemisphere midwinter (December) and midsummer (June) separately. Here are those two graphics.

Figure 4. As in FIgure 1, but showing midsummer and midwinter surface net cloud radiative effect. December and June averages. The horizontal dashed lines mark the edges of the tropics (23.5° N/S), and the two polar circles (66.5° N/S).
Again, more things of interest. In the NH midwinter (December), clouds warm almost all of the area north of about 35°N or so. In the southern hemisphere midwinter (June), the same is true. The clouds warm areas south of about 35°S.
Another oddity. In many cases, the white/ black contour lines outline desert areas where according to CERES, clouds are warming regardless of the season. Why?
Next, I looked at scatterplots of the surface temperature versus the surface cloud radiative effect, utilizing 1° latitude by 1° longitude gridcell data. For each hemisphere there are 32,400 data points. I graphed the data by season and by hemisphere. And in doing so, I noticed a most curious oddity. This was my second surprise.
The graph of the relationship between the midwinter temperature and midwinter cloud radiative effect is very similar in the two hemispheres.
And the same is true of the relationship between midsummer cloud radiative effect and midsummer temperatures. The two hemispheres have similar summer relationships. Here are those comparisons.

Figure 5. Gridcell scatterplots. Upper panel shows midwinters—northern hemisphere midwinter (December) and southern hemisphere midwinter (June). Lower panel shows midsummers—northern hemisphere midsummer (June) and southern hemisphere midsummer (December).
There are some interesting points here. First, the correspondence between the two winters (upper frame) and between the two summers (lower frame) is surprisingly close.
The main difference is in the summers in the low-temperature gridcells. The southern hemisphere has open ocean almost all the way to the ice-covered high Antarctic Plateau. In both winter and summer, the clouds warm Antarctica. So in the summer, the change in the cloud radiative effect at Antarctica’s shoreline area is a sudden and almost vertical change to warming (left end of orange/black line, lower frame). In the Arctic, because the pole is covered with water rather than the high-elevation land of the South Pole, the change to the polar warming is slower and more gradual (left end of blue/black line, lower frame)
Other than that, however, the two hemispheres are quite similar. Most importantly, in both summer and winter, as temperatures go above about 26°C or so, the cloud cooling rapidly strengthens and increases faster with each additional degree of surface warming.
The seasonal similarity of the oceans of the two hemispheres is important to me for a curious reason. I’ve used a gridcell-based scatterplot analysis of the type in Figure 5 above for things like the following look at how temperature and CRE are related over the entire globe. See my post Observational and theoretical evidence that cloud feedback decreases global warming for a discussion of the implications of Figure 6 below.

Figure 6. Scatterplot, net surface cloud radiative effect versus surface temperature, all 1° latitude by 1° longitude surface gridcells.
The main objection that people have raised to my using a gridcell-based scatterplot analysis of the type in Figures 5 and 6 above is their claim that it’s investigating location-based relationships, and thus it does not demonstrate any direct relationships between the two variables.
Another way to state the objection is to say that of course certain locations have some given relationship between temperature and CRE—the relationship is ruled by the location-based characteristics of the gridcells in question. Maybe there are ocean currents or nearby mountains that are ruling both the temperature and the CRE.
Now, that didn’t seem logical to me, because in Figure 6, the CRE values are grouped by the average gridcell surface temperature. And there are lots of gridcells around the planet with very similar average temperatures. But I hadn’t figured out how to counter that objection, to show that it’s not location-based.
However, the similarity of the hemispheric ocean midwinters, and of the hemispheric ocean midsummers, shows that the relationship between temperature and cloud radiative effect is not due to some location-specific characteristics.
It can’t be location-specific, since there are no locations that are common to both hemispheres. These are entirely different gridcells in entirely different oceans in different hemispheres, with different currents, different depths, different adjacent landmasses … and yet the relationship between temperature and surface cloud radiation is surprisingly similar.
So by chance, to my third and greatest surprise of the day, after starting down a totally different path I stumbled across a way to counter the main objection I’ve gotten to my gridcell-based scatterplot analyses.
Funny how life works when I follow random byways with no guide star except my endless curiosity about the wonders of this world.
===
Moon rising up above the redwood trees. Must be time for me to go moon viewing. I just need someone with a uniform and a Glock to come by every few hours and say “Step back from the computer, sir, keep your hands away from the keyboard and nobody gets hurt!”
Onwards, my friends, and my best to you all—may your lives be full of marvels, adventures, and surprises of all kinds.
w.
As Usual: I politely request that when you comment you quote the exact words you’re discussing. Avoids endless misunderstandings.
Very nice, a creative investigation and a very interesting post.
I’ve always maintained that net feedbacks are negative, as is usual in nature. Thus, ECS should be less than 1.1 degrees C.
Milo, a very late comeback. Your statement is simply not correct.
Net feedbacks can be positive, and the natural system will slowly adapt.
Specific example is glacials interglacials. The unmelted snow that accumulates to massive ice sheets cannot be from a negative feedback. The warming that melts them cannot be from a negative feedback.
However, you are correct that they can only be weakly positive. To use Monckton terms, necessarily less than Bode feedback curve 0.65. In reality, per Lindzen and then mynown analysis, something between 0.25-0.3. Quite stable, no amp screetch.
You pretty much describe a regenerative receiver from the early days of radio.
Small amounts of positive feedback, just below oscillation, can result in great amplifier gain. One needed to ride the regen control because the incoming signal could push it into oscillation.
This however requires that the power supply has enough strength to provide the needed power for the change in gain. The sun only supplies a fixed amount.
I posted this comment on the article about sea temperature plunge: When ocean surface temperatures increase there is more evaporation. That should lead to more cloud cover. More cloud cover leads to less sunlight reaching the ocean surface thus causing a decrease in ocean surface temperatures…. Just a thought. It was also pointed out that evaporation is a cooling process
I think that is the basic mechanism. Warming causes clouds to form. Clouds offset warming..
I would like to ask: are we talking actual surface temperatures or just above the surface? Arent they still atmospheric temperatures w a lapse rate depending on altitude? I thought that when i read
‘Warming occurs from that part of the thermal radiation emitted by the clouds that hits and is absorbed by the ground’. I always assumed that clouds basically cools by sunlight blocking during the day and just delayed heat from rising (the blanket theory) during the night and only the sun directly warms the surface ( by day, obviously).
Somebody please explain how clouds exactly emit thermal radiation that gets absorbed by the surface. Afaik the water vapor (clouds) radiate thermal heat in all directions. How much of that ACTUALLY hits the ground? And is there a difference between day and night?
Water vapor, also known as “clear sky”, absorbs and emits IR radiation in well defined spectral bands. Clouds, also known as condensed water, scatter all radiation, more or less irrespective of the wavelength. They also emit IR radiation according to Stefan-Boltzmann equation.
Yes, I didn’t read your comment before posting above.
I have been looking at upward and downward welling IR radiation using SURFRAD data. During day or night, as long as the sky is clear, there is a large difference between upward welling IR (which is set essentially by surface temperature) and downward welling radiation — maybe 150 W/m^2. The clear sky returns IR radiation toward the surface that is some weighted average of atmoshereic temperatures above.
As cloud begin to cover the sky they act as something like radiation baffles. The effect is now a weighted average more weighted toward lower parts of the troposphere where clouds reside. When cloud cover becomes 100% and very low near the surface there is practically no difference between upwelling and down welling IR — very efficient prevention of loss to space. Thick clouds,as far as IR radiation is concerned, are nearly blackbodies at their base temperature. They scatter everything.
Yes, but that doesnt actually answer my question about surface absorbtion or emission after downwelling by clouds. I understand the downwelling aspect and the influence on the atmosphere. The article implied/ stated a surface element..
“Somebody please explain how clouds exactly emit thermal radiation that gets absorbed by the surface.”
Thin clouds can allow some solar radiation to pass through to the ground.
ballynally,
get yourself a copy of “Global Physical Climatology” by Hartmann. These questions need physics, heat transfer and fluid mechanics understanding beyond high school level to contemplate, which is still much less than an answer. Your “sunlight makes things warmer, clouds reflect heat” approach is a good start.
Interesting that 35 deg is the crossover line. I live at 35N (North Carolina) and drive north of my home quite a bit during the winter. I do notice Dec-Feb that its generally cloudy north of the state line but driving back into the state sees the clouds disappear as I get to my house. It happens quite a bit of the time. Don’t know why but it’s noticeable.
WE, nice work.
Your fig. 1 is a real problem for the IPCC. It consistently says (AR4, 5, 6) cloud feedback is uncertain but significantly positive. (In fact, using Lindzen’s Bode feedback curve analysis from 2011 it is possible to show that IPCC has clouds at about half of the positive water vapor feedback.)
Fig 1 says it is not uncertain and significantly negative.
The IPCC statements are not based on Ceres observations. They are based on CMIP climate model outputs. Which is yet another way of showing climate models are bigly wrong.
Rud,
Yes, I thought similarly after reading this well-presented article from Willis. Have to love those global scale scatter plots and the thoughts they trigger.
Because IPCC (models) conflicts on feedback sign with CERES (measurements) then a major rethink has to happen.
Is there any evidence that IPCC are revising? Links to statements of correction?
Geoff S
major rethink – that’s not what IPCC is about. Defund them.
Aren’t clouds modeled in the GCMs via parameters, rather than physics? If so, then cloud affects will be highly related to the parameters chosen by the modelers. Which may or may not have anything to do with reality.
Yes, clouds are one of the things that climate models have to parameterize.
Cloud is a positive feedback if you only consider IR, and ignore reflected SW. You can do this by defining things in your favor. Sort of like ignoring the gorilla on the basketball court….
Nice article. Glad to see you separate the hemispheres instead of relying on “global” averages. My investigations have convinced me that most warming in the mid-latitudes occurs in the cooler months of winter and that occurs with minimum temperatures at night. It certainly makes one critical of CO2 warming and of the GCM’s that handle clouds so poorly.
Jim,
Willis might find it interesting to compare Eastern and Western hemispheres using international dateline to view the scatter that way. Both of us are interested in uncertainty. Geoff S
There are types of clouds – all are not equal. In my neighborhood – generally a cloudy day means sun radiation is blocked and temp is cooler while the opposite at night.
Mine too
yes, clouds block the sun, cooler underneath. Many times we don’t reach predicted highs for the day because unscheduled cloud cover, but clouds at night trap the heat of the day, those first fall frosts usually occur on a clear night.
all about that evil water molecule, lack of it in the air is why deserts are so hot during the day but so cold at night.
Very interesting. It is going to take several readings of this post to really absorb enough to ponder seriously. By coincidence many people seem to be fussing with the radiative effect of clouds this summer; for example Happer and Wijngaarten are developing their 2n Streams algorithm for calculating could effects. I’ve built a portable SURFRAD of sorts simply because I own a number of Eppley radiometers and building instrumentation is fun; I have seriously begun to look at NOAA SURFRAD data to see what I can learn. One thing is that once clouds begin to cover much of the sky at all, the variations in downward welling solar radiation at the surface can be very large…over to under
  — a factor of 10. Clouds are a huge factor.
Clouds can even enhance down welling solar radiation at times because with full direct sunlight at some ground location clouds present in other patches of sky display very white replacing blue — a very noticeable enhancement by scattered radiation.
No matter what a person looks at, atmospheric phenomena are always a bit more complicated than one might have supposed initially.
Under these circumstances, solar panels can produce above their rating when sitting flat and the sun is quite low in the sky. A bit like getting snowburn but from dispersed EMR rather than reflected.
The moored buoys are useful sources for surface sunlight data. A moored buoy in a warm pool will record daily surface sunlight as low as a few W/m^2:
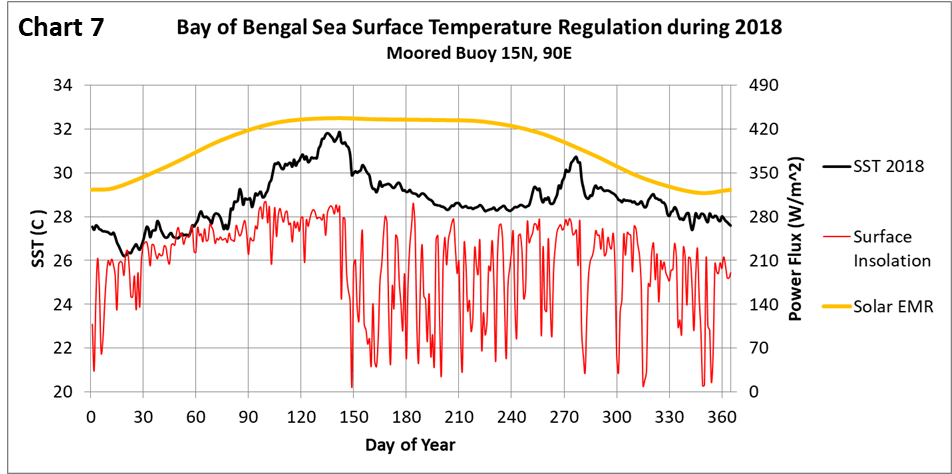 ?ssl=1.
Surprising to me is that absorbed sunlight in the atmosphere is almost constant and near independent of cloud.
Clouds produced by cyclic instability over warm pools regulating at 30C have negative feedback of 2. The increase in reflected short wave is twice the reduction in OLR.
Thanks Willis. I’ve been arguing with alarmists for some time that clouds have a huge daytime cooling effect and an opposite nighttime warming effect and no one really knows just how big the net effect is. I now know better. Thanks again for the enlightening exposition of actual evidence.
Very interesting work, thanks !
Perhaps it’s due to the Sahel’s albedo (mean 36% on bare surfaces) higher than in other locations so that clouds may cool less deserts than non desertic regions with smaller albedo all other things being equal (the URL seems to be OK with 3 dots)
Albedo of the Sahara
[Petit, the link to sahara albedo didn’t work as shown, so I put it in as a proper link using the link button below the text entry space. -w.]
Question:
“Warming occurs from that part of the thermal radiation emitted by the clouds that hits and is absorbed by the ground.”
By thermal radiation, do you mean thermal energy (aka heat) or electromagnetic energy (aka IR)?
I take it it is the former. My question would be about ‘hits and is absorbed by the ground’. And is that than radiated out by IR?
“Thermal radiation is that electromagnetic radiation emitted by a body as a result of its temperature.” From heat transfer book.
Heat could only be recognized at a thermal boundary if clouds are at a higher temperature than the ground.
Could be IR but again if could colder than ground no effect.
Could colder should cloud colder in last sentence.
Thermal radiation = Infrared radiation = electromagnetic radiation.
IR simply indicates the area of the EM spectrum that the wave occupies. Just like microwave designates a portion of the EM spectrum. Or, like HF, UHF, VHF all designate certain areas of the EM spectrum.
Only when an EM wave, or a portion, i.e. quanta is absorbed and creates more kinetic energy in the structure of a substance, does that EM wave become thermal radiation. So thermal radiation describes an effect that an EM wave has, not a different kind of EM wave.
An EM wave that travels out into the universe is still an EM wave. It only becomes “thermal radiation” when something intercepts it, absorbs it, and becomes warmer.
Thermal radiation = Infrared radiation = electromagnetic radiation.
False, although that is how it is commonly used.
I asked the question of the author, not because I understood what he meant, but because I was unwilling to assume or guess.
Having worked in IR electro optic sensors, I fully understand what is going on.
Calling thermal radiation the same as EM or IR conflates the definitions and confuses.
Too many people still think IR and heat are the same. Eunice Foote in 1856 discovered they are not.
In gasses, EM quanta do not “thermalize” the molecule but instead excite the valence electrons. That does not alter the momentum or kinetic energy of the molecule, therefore do not “heat” the molecule.
The effects of EM on solids and liquids is best understood by radar skin depth equations. I am not going to provide a tutorial.
There is also the EM wave momentum that does transfer momentum to the air molecules, albeit a very small amount of energy is involved. Again, I am not going to provide a tutorial.
Thermal radiation is similar to EM radiation in that the intensity follow the spherical 1/r^2. But thermal radiation is much slower than EM. EM in the atmosphere is essentially c. The movement of molecules in air is estimated at 500 m/s on average.
https://chem.libretexts.org/Bookshelves/Physical_and_Theoretical_Chemistry_Textbook_Maps/Supplemental_Modules_(Physical_and_Theoretical_Chemistry)/Spectroscopy/Vibrational_Spectroscopy/Infrared_Spectroscopy/Infrared_Spectroscopy
I must disagree with your thermal radiation paragraph.
”It (thermal radiation) differs other forms of electromagnetic radiation such as X-rays, gamma rays microwaves, radio waves, and television waves which are not related to temperature.” From Thermodynamics an Engineering Approach book.
It is not the effect as you state it is what causes its initiation. Only temperature causes thermal radiation.
This is saying the cause of EM waves from an object can be temperature related rather than the result of other phenomena.
Fundamentally, heat causes electron motion which generates EM waves via a charge in motion. That is no different than an electric field causing charges to be in motion which creates an EM wave also.
From Britannica:
https://www.britannica.com/science/thermal-radiation
thermal radiation, process by which energy, in the form of electromagnetic radiation, is emitted by a heated surface in all directions and travels directly to its point of absorption at the speed of light; thermal radiation does not require an intervening medium to carry it.
From:
https://phys.libretexts.org/Bookshelves/University_Physics/Physics_(Boundless)/23%3A_Electromagnetic_Waves/23.2%3A_Electromagnetic_Waves_and_their_Properties
This article discusses the effects of radiation pressure which Planck used in his analysis of Maxwell’s equations and EM waves in his Theory of Heat Radiation. It is where he made a giant leap to the concept of quanta in an EM wave.
Sorry, Sparta, missed your question.
By “thermal radiation” I mean the longwave infrared radiation that is constantly being emitted/absorbed by everything except monatomic gases, with the amount of radiation being proportional to the fourth power of the temperature.
In particular, significant amounts are emitted by the poorly-named “greenhouse gases” (GHGs) like H20, CO2, and CH4, and by the clouds. Part of this longwave infrared radiation is absorbed by the ground. This leaves the ground warmer than it would be in the absence of the GHGs
w.
H2O is magical, with clouds being a regulating 4th state of matter, otherwise El-Nino would run away.
If the Feedback from CO2 warming was positive we would not be here today.
If the combined feedbacks were net positive, we would not be here today.
Very nice Willis. All of the information you gathered is easily available to the IPCC crowd. How can they continue to say that clouds both warm and cool but mostly they warm?
Because their Leftist political masters demand fealty to the narrative. Its easy to play games with CliSciFi models and it keeps all of the drones employed. Follow the money.
In 2022, WEF claimed they owned the science.
@willis: your peregrinations in the natural world brings to mind one of my favorite aphorisms: “Life not measured by the breaths you take, but by the moments that take your breath away” Keep going down those interesting paths your curiosity takes you my good Sir.
So you have further proof that CO2 has no influence on the energy balance but you still believe there is a “greenhouse effect” controlling Earth’s energy balance.
Earth’s energy balance is controlled by convective instability. Instability forms the clouds that limits the open ocean surface temperature to a sustainable 30C.
Warm pools regulating at 30C exhibit a negative relationship between reflected short wave and outgoing long wave by a factor of 2. A very powerful negative feedback factor. SWR increases twice as much as OLR reduces during the cyclic instability that ranges from brief periods of clear sky to dense reflective cloud that diminishes surface sunlight to a few percent of the ToA EMR.
Clouds act more like a governor or a thermostat controlling the amount of sunlight reaching the ground. That is not a “greenhouse effect.” (Thanks for using quotes1) It almost acts like a very low frequency oscillator.
The convective instability over warm pools is an oscillator. The instability takes typically 5 days to build convective potential and then cloudburst is triggered.
The convective potential has to build due to the OLR solidifying the water vapour to ice to form the cirrus cloud and the pressure profile steepens above the LFC. An atmospheric disturbance, often evening cooling over oceans, will trigger the instability and cloudburst ensues to recharge the water vapour. Then the cycle starts over.
Sparta Nova 4 August 30, 2024 9:26 am
That’s one of the two opposing effects of the clouds. From the head post:
The first of those is what you discuss.
The second of those involves what is called the “greenhouse effect”.
w.
It is the kind mess that occurs when someone just follows “the science” without reflecting on it, or doing his own research. Unlike “the science” falsly believes, clouds are not cooling but rather warming.
The logical fallacy is because of ignoring the cloud/GHG overlap (~45W/m2) in the GHE and attributing it falsely to GHGs only.
Empirically it is easy to show how things work for real. Here the cloud/temperature relation for Hanover, Germany for 1950-2019:
..or more generalized..
..or just two years worth of data from the Aleutian islands (and a different data source):
These and many more data all show a positive correlation between cloudiness and surface temperature. And again, it not a surprise, given we know about the logical fallacy making “climate scientists” believe clouds were cooling instead.
https://greenhousedefect.com/the-cloud-mess-part-2-something-spooky
Thanks, E. I graphed up your Hanover results. Most interesting.
Note that when there are no clouds, winters are colder and summers are hotter.
And when the sky is fully covered with clouds, winters are warmer and summers are cooler.
As I said …
Best to all,
w.
PS—E., do you have a link to the Hanover data? Thanks.
I have the source linked in the linked article.
https://opendata.dwd.de/climate_environment/CDC/observations_germany/climate/hourly/
There you will find data on air temperature and cloudiness. Go to /historical and Hanover has the code “02014”
Thx.
w.
Whilst the NH and SH calculations are based on the geographical equator being fixed at 0 degrees latitude, what difference would there be if hemisphere calculations were based on the meteorological equator as the ITCZ tracks north and south of 0 degrees latitude?
Unknown, by me at least. Does bring up the interesting question of how to identify the location of ITCZ algorithmically … particularly since sometimes there are two of them …
w.
Terrific article! And a very important one. Essentially it trashes global warming, based on measurements not theory. Feynman would have approved. Such a pity no one of his stature and down-to-earth common sense is living at the moment, although a few are close, and all of the same view.
“Terrific article! And a very important one. Essentially it trashes global warming,”
I agree.
Clouds are Mother Nature’s regulator.
I’m going to have to take exception to your comment, John, although you, Willis, Feynman, and I all agree (or in Feynman’s case, would have agreed) that global warming is a scam. But the physics behind it is another matter entirely.
No, Feynman would not have approved of anything Willis has written about physics. Instead, he would be spinning in his grave to see the mess Willis has made of his favourite subject – which I’m going to guess you haven’t studied at all either. Because Feynman was a scientist, while Willis is a charlatan, an arrogant, ignorant, lazy, rude, lying fisherman pretending to be a scientist. He is totally ignorant of physics, logic, sociology, and philosophy, among other fields, and of course completely unteachable. He has a room-temperature IQ and the intellectual and emotional maturity of a 6-year-old. No, Feynman would not have approved of that combination in the slightest. If I or anyone else with a decent physics background can detect that Willis is a charlatan in mere seconds, Feynman would have spotted it in milliseconds, if not sooner.
“Measurements not theory”? What good are measurements if you don’t know what you are measuring? Willis certainly doesn’t.
And the very last thing Willis’ already overinflated ego needs is imaginary accolades from dead physicists. Why don’t you try to find a real accolade from a living physicist first? Take your time. I’ll wait here.
(Feynman would have approved of Willis’ fishing prowess, though, certainly. Credit where credit is due!)
Yes, it would be nice to have another Feynman around. Willis isn’t it. You’ll have to look elsewhere.
If you really want to study climate via a model then the only reliable place to look is planet Earth without prejudice.
Nature knows how to do stuff but human beings do not and are prone to rapid conclusion jumping often with expensive consequences beforel the penny drops..
“My method of scientific investigation is graphics-based. I take chunks of numbers, sometimes tens of thousands of them, and display them graphically.”
This is important and much appreciated, Willis! Excellent food for thought.
Thank you, Willis, for beginning to talk about things that are important in determining the various local climates of the earth, namely the balancing of total radiative energy, inbound and outbound, across the whole surface of the earth. Starting with the simplest, and most effective, “negative feedback” which is that the energy radiating from a surface on a cold winter’s night is roughly 30% of that from a hot summer’s day that is exactly the same instant in time. Potsing around with Global Average Temperatures is of no use at all.
Further, the flow of energy in, out and around the earth is a much better descriptor of “Climate” than any calculation of thermometer readings by itself, as it includes the entire water cycle as well as wind and cloud effects. In fact, while temperature change is a reasonable measure of energy for solid and liquid surfaces, the specific heat of both dry and humid air varies greatly with both pressure and temperature. Therefore, a calculated minuscule change in temperature caused by CO2 somewhere in a column of air says nothing about the energy involved.
I also suspect that the dissipation of energy as the atmosphere moves from the hot, humid tropics towards the cold, dry poles affects local climates, much the way the Gulfstream warms the British Isles.
Willis,
Fig. 2…so awesome to give one a sense of the seasonality involved…your Fig. 6 you have published a couple of times before at WUWT…simply brilliant, especially the % of Earth’s surface secondary axis.
I have learned so much from your articles, more than from various meteo/clima textbooks on my bookshelf. Thank you so much.
Also your comment “…the small change in surface CRE is of the same order of magnitude and is acting in opposition (cooling) to any warming effects of the CO2 forcing….” It seems that anything causing surface warming (does that include CO2, land use, UHI ?)… in Fig 2, it’s seasonal sunshine, results in a very close to equal and opposite cloud radiative/reflective reaction.
WE,
Just a thought, maybe fig 5 would benefit by a supplemental x-Axis showing latitude along with the temp., sorta like you did with the percent of surface in fig. 6
Willis wrote:
“Warming occurs from that part of the thermal radiation emitted by the clouds that hits and is absorbed by the ground.”
No it doesn’t. What do you think “warming” means? And what do you think “radiation” means? And what do you think “absorbed” means? Please define these terms using physics terms you have already defined for us, namely “energy”, “work”, and “power”. Thank you!
Pass. As I’ve pointed out before, discussing these issues with you is more painful than pooping a pineapple … not interested.
w.
I do like your analogy for how painful it is for ignorant fishermen to learn physics. Good one!
Give it up, Steve. Your childish attempts at humor just make you look even more foolish than you actually are.
w.
I’m not the one who’s in excruciating pain trying to learn how to do physics correctly, Willis. That’s you, remember?
Uh-oh! Look out, everyone! Stevie has his panties in yet another twist!
As to “excruciating pain”, nope. I’m here kicked back sipping coffee and laughing at you.
w.
Ah. Well then, why didn’t you say that trying to learn physics was a coffee-sipping laugh, instead of harder than pooping pineapples?
It’s pretty funny that you tried to call me “childish” after your only answer to my simple physics questions was a poop joke. Do you know what the phrase “psychological projection” means, Willis? I know those words are pretty long and complicated, and you probably didn’t see them very often in your fishing career, but you can always look them up in the dictionary if you need help.
And there you have Steve in a nutshell, folks … bitter, vindictive, and vicious.
Ah, well.
w.
More psychological projection, Willis? I politely asked you to defend your words, the ones you constantly lie that you can defend. The most erudite, mature, and intellectual answer you were able to think up was a poop joke. What are you, 6? Who do you think you are impressing with these antics? Your kindergarten fan club?
Said it before, Steve. I’ll say it again.
Discussing issues with you is unpleasant, unproductive, uncollegial, and unwanted.
Go attack someone else. Not interested.
Best of life to you,
w.
“Attack”, Willis? No, I asked you a scientific question. Politely. Indeed, I asked you to do no less than live up to your oft-repeated promise to defend your words. Since that promise was obviously a lie on your part, you refused, as usual, and instead pooped out a poop joke. How are we to conclude that you are anything other than exactly what you look like, an ignorant narcissistic lying fisherman with the maturity of a 6-year-old, pretending to be a scientist? In other words, a charlatan?
If you can’t tell the difference between “attacks” and “polite scientific questions”, perhaps you are in the wrong business? Maybe you should go back to fishing?
It matters not to me whether you think my attempts to teach you science are “unpleasant, unproductive, uncollegial, and unwanted”. Those are all “you” problems, not “me” problems. They are nothing more than your way of telling us that you are an incompetent and recalcitrant student. After all, this is Watts Up With That, The World’s Most Viewed Website on Global Warming, and that’s what’s going to happen to you when you post nonsense around here. Might as well get used to it.
Alternatively, if you don’t want people publicly pointing out that you obviously have no idea what you are talking about, perhaps you should go hang out somewhere where that sort of thing is de rigueur, such as The Conversation, or Skeptical Science?
(That word “uncollegial” is one that no one has thrown at me before, perhaps because, like everything else you have said in response to my physics lessons, it is scientifically irrelevant. But I remember someone else being accused of being “uncollegial”, too. Now who was it? Oh yes, it was Professor Peter Ridd, of James Cook University, in Australia, when he pointed out that his colleagues were full of bovine excrement, after they claimed that anthropogenic CO2 emissions were responsible for damage to the coral reefs. Of course they couldn’t defend their fraudulent work, for much the same reasons that you can’t, so they resorted to calling him “uncollegial”, and sacked him. A fascinating case. You should probably study it before you use that word again. Real scientists have no issue with being called “uncollegial”, or anything else, as long as they are right. But being right or indeed honest isn’t one of your priorities, is it?)
Values in all instances were done in units of W/m2,
======
What is “done”?
The problem is that avg(temp(radiation)) is not equal to temp(avg(radiation)).
Yet, all the major global temperature indexes ignore the problem and happily average temperatures.
Sorry for the lack of clarity, ferd. I meant that all averages and math were done in W/m2, and then converted to temperatures afterwards.
Regards,
w.