From NOT A LOT OF PEOPLE KNOW THAT
By Paul Homewood

An international team of climate scientists have used a 627-year coral record from Fiji to reveal unprecedented insights into ocean temperatures and climate variability across the Pacific Ocean since 1370.
The new coral record shows that the local ocean temperature was warm between 1380 and 1553, comparable to the late 20th and early 21st centuries. However, when combined with other coral records, the Pacific-wide warming observed since 1920, largely attributed to human-derived emissions, marks a significant departure from the natural variability recorded in earlier centuries.
https://phys.org/news/2024-08-fijian-coral-reveals-year-pacific.html
We can safely ignore the usual contemptuous claim that it proves “climate change”. As ever, this study would not have been funded or published if it had not mentioned climate change. Hence the authors’ appeal:

Their graphs show there is no evidence of their attribution:

(D) Annually averaged Sr/Ca-SSTs for coral core F14 from Fiji (red) compared to the Fiji composite
coral record from records 1F and AB (23) (green) over their common period of 1781 to 1997. (E) Annual Fiji composite coral record (red) combining the records shown in
(D) compared to the Ocean2K SST anomaly reconstruction for the western Pacific (24) (blue) and the SST from the PHYDA close to Fiji (17°S, 117°E) (21) (green). Also shown
is the most recent SST data for Fiji from ERSSTv5 (1998 to 2021) shown in (E) (black). SST presented as anomalies relative to the period of 1883 to 1996. It should be noted
that records 1F and AB (23) from Fiji are also included in the PHYDA and O2KWP reconstructions. Triangles in (D) and (E) denote the timing of major volcanic events (<−3.5 W/
m2 values) (Fig. 2) (22) typically associated with a cooling response. Extended warm (cold) periods highlighted in (D) and (E) by red (blue) bars based on the change point
analysis for the Fiji composite shown in (E) are indicated by dark red vertical lines; dark red horizontal lines indicate the mean for each period.
Not only do we see the warmer period before the LIA set in. We can also clearly see that SSTs began rising again in the early 19thC, long before any possible man-made effect.
Plainly natural variability dominates the whole period, something which is hardly surprising, given that a warmer atmosphere cannot significantly increase ocean temperatures.
We should also ignore that black line, showing current SSTs – splicing of data in this way is a strict no-no in any statistical analysis.
Settled science #94
The Atlantic is cooling at record speed and nobody knows why
After over a year of record-high global sea temperatures, the Atlantic is cooling off more quickly than ever recorded, which could impact weather around the world
https://www.newscientist.com/article/2444394-the-atlantic-is-cooling-at-record-speed-and-nobody-knows-why/
Must be global heating…
No, it’s just a cooler anomaly of a natural cycle ….
https://www.climate.gov/news-features/event-tracker/atlantic-nina-verge-developing-heres-why-we-should-pay-attention
I should have added a /sarc…
I was responding to the …..”….and nobody knows why” bit.
You seem to lack a sense of humour. Nevermind.
A very common characteristic among leftists.
and those captured in a certain religion
True, which reminds me of a Family Guy cartoon- where Jesus responds to his dad’s (God) question about what he wants to do when he grows up. He responds, “be a stand up comic”.
Did “leftists” vote for Brexit?
I did.
Go figure.
I’m sure you’ll think of something.
good question- I bet some did
Nobody knows why it is cooling so fast when equatorial trade winds are particularly weak. How are the cold subsurface waters upwelling? Models are no help. And nobody knows what it will mean for hurricane season.
So, yeah. Lots we don’t know about the climate to be so sure we are breaking it.
Mr. Banton should have also.
Banton tells us that cooling is NATURAL.
Very funny,
Of course warming is always human caused 😉
An EN is natural Oxy.
Or had you forgotten?
No, ENSO is not “human caused”
“”No, ENSO is not “human caused”””
And yet some [ludicrously] claim otherwise.
“”Anthropogenic impacts on twentieth-century ENSO variability changes””…
Multiple large ensemble experiments further confirm that the simulated post-1960 ENSO amplitude increase (approximately 10%) is not solely due to internal variability. “”
https://www.nature.com/articles/s43017-023-00427-8
Now, that’s funny. Useless inaccurate, flawed models confirm their bias.
‘further confirm that the simulated post-1960 ENSO amplitude increase (approximately 10%) is not solely due to internal variability. “”’
Natural causes for 20th century ENSO variability include:
In all likelihood, both of these natural causes have had a role to play in the ENSO amplitude increase, and general positive bias since the 1990s.
Running flawed climate models is not conducting experiments.
Yet El Ninos are the only warming in the 45 years of UAH data.
You have just told us there is no AGW.
Unless one is an engineer, it’s difficult to tell the difference between cooling and boiling.
Only if done very slowly and you’re amphibious.
Darn tootin’. The latest UAH satellite data for GLAT (see attached image) indicates all that heat must be going from the oceans into the atmosphere, creating the spike in temperature seen in the last year. That would be, ummm, in accordance with the interpretation of the Second Law of Thermodynamics by some that say “heats always flows from hot to cold”.
/sarc
” … by some that say “heats always flows from hot to cold”.”
How dare they to say that ?
Nice Reality Check. Coral reefs, and reefs generally, are the factories that produce limestone, which is defined as a sedimentary rock with at least 50% calcium carbonate (CaCO3, which is Calcium and Carbon Dioxide combined). Not only was Fiji doing well 600 years ago, but worldwide limestone deposits were best developed in the mid-to-late Paleozoic, ending at about 250 million years ago. Warm ocean water and abundant carbon dioxide, skipping past tipping points, life was good and reefs were spectacular.
geology- the profession I should have gone into!
So there is nothing showing we are facing “unprecedented” pacific ocean temperatures in their data. Saddly they didn’t go further back from 1350 to see what was going on during the MWP apogee (from about 800 to 1000).
According to 2000 years of temperatures reconstruction, the Pacific Ocean may have been warmer during the MWP than nowadays.
Hopefully a further study will verify this hypothesis.
Doesn’t plot E show that current sst were about 0.4°C above the previous maximum in 2021 (3 years on I believe it is even higher)? (Black curve)
latest sst world
Introducing Zamani Islands: The first Maldives superyacht marina
https://www.yachtcharterfleet.com/news/introducing-zamani-islands-the-first-maldives-superyacht-marina
Get in before sea levels rise…
Hope they got all those buildings balanced on the Island..
Wouldn’t want it to tip over 😉
So much money spent.. to disappear in a few weeks due to sea level rise. 🙂
Doesn’t show the SSTs for the much before the LIA , either.
This one using proxy data from the Makassar Strait by Rosenthal does, (historic notes added by Andy May)
There is a clear discomfort that causes climate researchers from The Establishment to
– consider ocean level change that could be caused by movement of the rock walls and floors of the ocean basins
– consider that there could be underwater volcanism on a time scale of years to decades and more that causes local ocean water temperature variation
– consider ocean water cooling and warming in a balanced way, instead of treating cooling as rare but warming as common and likely caused by people
– consider the established chemistry of buffering, which questions whether an alleged claim of 0.1 pH reduction (caused by people) is possible for the oceans
– consider the correct definition of pH, using activity not concentration
– consider that natural biological cycles have the ability to cause natural pH cycles.
Put another way, the aqueous chemistry that I was taught at Uni is not being applied as I expected. I am trying to discover if the confusion is mine.
Geoff S
It is not you.
You’re right. Through buffering, time will take care of ocean CO2 perturbations (and atmospheric for that matter). I can’t wait.
As soon as living matter enters the picture one has to be cautious about applying inorganic aqueous chemistry. I read many moons ago about bacterial mats on the Pacific floor with a pH of -42 — far beyond a solution of pure protons. Quite obviously, as you say, concentration is not always a good guide to activity.
O/T I was intrigued to see if anyone anywhere would tie the Sicilian yacht tragedy to the, er, climate crisis.
“”Climate change amplified storm that sank British tycoon’s superyacht—with expert predicting more catastrophes in Italy
…
Global warming may have contributed to the extreme weather which led to the fatal sinking of a yacht off the Italian coast, the nation’s meteorological society president believes.
…
“So we can’t say that this is all due to climate change, but we can say that it has an amplifying effect.”
https://fortune.com/europe/2024/08/20/mike-lynch-superyacht-storm-climate-change-sicily/
Got to get it in there somewhere, somehow.
NB. Italian weather and meteorology is provided by the Italian Air Force, not the non profit Italian Meteorological Society.
Well, according to some recent WUWT articles, climate change™ has been claimed to be:
— causing anxiety
— causing a rise in child marriages
— causing unrecoverable damage to the Great Barrier Reef
— causing a reduction in vanilla production
—causing Pakistani men to beat their wives.
So, sure, why not?
That explains why I have to change strings on my guitars more frequently – global heating… increased sweating… faster string degradation.
Of course, that almost makes sense.
Try the coated strings. Same bright sound but they don’t corrode from sweat. A little pricey, but they last much longer.
For me it’s Ernie Ball Super Slinky every time. Nickel has that sound…
Climate hasn’t affected my strings in the slightest. See the nonsense you can get away with?!
“But . . . but . . . but we now know that anthropogenic global warming affects only land! . . . trust us . . .”
— the voice of an AGW alarmist crying in the wilderness
From the paper’s abstract:
Further, the study shows that the current Pacific ocean temperature is warmer than any point in the past 650 years.
Painting this paper as a vindication of the contrarian position is… amusing, at best.
There is no climate crisis – outside a select bunch of crania.
Do you really believe there is even the slightest hint of a problem?
Pass the popcorn
And yet it shows a rise in temperature beginning long before CO2 could have had an effect. What caused that?
CO2 is not the only driver of Pacific SST – in fact it could not possibly have been the primary driver prior to the industrial era.
CO2 is not a driver of any Pacific SST in any way whatsoever..
… never has been, never will be.
Rosenthal goes back further.
If you cared to note the y-axis title of the graph that you presented, it states “SST”, an abbreviation of “sea surface temperature”. That parameter does not in any way reflect the bulk ocean temperature. The Pacific ocean has an average depth of about 14,000 feet, and it is well-known—well, to many that actually consider the science involved—that sub-surface ocean currents are continuously moving heat energy around the planet.
Finally, it is beyond-farcical to believe that anyone can establish Pacific ocean average SST to a meaningful precision of ± 0.5 °C, let alone to a resolution of ± 0.1 °C or better, as the parameter variations in the graph you presented claim, especially going back in time more than 600 years from today.
The graph that your presented represents a new low in scientific data malfeasance.
ROTFL.
The output from the Sun has been highest over the last 100 years of any 100 year period in the last 400 years.
Just curious . . . how did humans measure “the output from the Sun” 200-400 years ago?
FYI, the first photometer instruments were invented in the mid-1800’s.
When I first read this paper I noticed a temperature spike just prior to 1900. Yet NOAA and HadCRUT5 global temperature records don’t seem to show a similar increase in temperature. So I’ve globally averaged NOAA SST from ERSSTv5 and this is what I’ve discovered. In the upper graph, SST and global temp anomalies are plotted on individual scales. In the bottom graph I’ve converted SST to anomalies and plotted on the same scale. Notice anything odd?
Anyway, I like the SST result because that more closely matches my temperature prediction from sunspots.
See my github page for more details on the model. A python program to download and plot SST is available on the site.
Correlating with a bogus temperature record says a lot about your theory.
Correlate with this, Hansen 1999:
Tom, why would I do that? The US occupies less than 2% of the earth’s surface, and it’s not anywhere near the equatorial regions that receive the most sunlight.
You should do that because every unmodified, regional temperature chart from around the world has the same temperature profile as the United States, where it was just as warm in the Early Twentieth Century as it is today. Therefore, the U.S. temperature profile is the real temperature profile of the Earth, not the bogus, bastardized Hockey Stick chart profile, which is a propaganda construct meant to sell the human-caused climate change narrative. That’s why.
There is basically no reliable SST data for most of the period of your graphs.
That’s another good reason.
I think if you consider the main point of my post, you’ll appreciate that I do have doubts about the accuracy of the data, both for global temperature and SST, that’s why I asked the question, “Notice anything odd?” However, unlike Tom, I don’t believe that the planet hasn’t been warming. I accept that the shape of the global temperature plots are generally correct, even if they have been stretched a bit.
To help convince you of that, here’s my model in it’s most basic form — a 99-year moving average of sunspot data. This version doesn’t have enough attenuation of the 11-year sunspot signal, but it does allow about a decade of prediction into the future. After this current temperature spike, we’re in for some slight cooling, but we’re at least 200 years from the next cool period.
Here’s the spreadsheet version if you don’t want to read the python code on my github site.
“However, unlike Tom, I don’t believe that the planet hasn’t been warming.”
That’s not what I believe. I do believe the planet has been warming, since the 1970’s. I believe the current warming is part of a cycle of warming and cooling that has taken place since the end of the Little Ice Age.
The temperatures warm for a few decades and then they cool for a few decades and then they repeat, which is obvious if one looks at unmodified, written temperaure records.
What I don’t believe is that the temperatures have been steadily warming since 1850, which is what Climate Alarmists/Hockey Stick creators, want us to believe.
“I accept that the shape of the global temperature plots are generally correct, even if they have been stretched a bit.”
There is a lot of “stretch” in the bogus, bastardized Hockey Stick charts. They show a cooling of about 0.4C from the 1940’s to the 1970’s. The 1970’s were when scientists were wringing their hands over a possible return of a new ice age.
Do you think climate scientists would get that exercised over a 0.4C drop in temperatures? I don’t, either.
The truth is if you look at the U.S. chart I supplied you will see that the temperature drop from the 1940’s to the 1970’s was on the order of 2.0+C. Now *that* will get a climate scientist exercised.
The “Ice Age Cometh!” scare of the 1970’s was real and it wasn’t over a 0.4C drop in temperatures.
So the Hockey Stick chart is stretched so much that it does NOT represent reality. There were no Hockey Stick charts when the Ice Age scare came around. Everybody was using the NASA chart I posted that shows a 2.0C cooling from 1940 to the 1970’s.
The Hockey Stick chart is not just stretched, it is the BIG LIE of climate science..
Well, Tom. I guess we’ll have to disagree on the warming since the 1800s. I think the biggest problem with the hockey stick is that tree-ring data was likely used to minimize temperature changes prior to 1900.
You might also consider this plot which I’ve shared before on WUWT. The red trace is the reconstructed temperature from the Greenland GISP2 ice core. In it the LIA is correctly positioned around 1600.
The blue trace is my reconstruction of the temperature reconstruction using 12 principal components I’ve extracted. Using the PC’s I’ve also extrapolated beyond the end of the ice core records. This type of extrapolation shouldn’t be relied as an accurate projection, but I wouldn’t be surprised if it turns out to be more accurate than IPCC projections.
What you’ll notice is that there is a sudden rise in temperature that almost exactly matches the warming period we’re in now. While my prediction from the existing sunspot data says we’re past a peak in temperature, I don’t know if we’re at the peak in the current warm period, which still have at least a couple of hundred years in it.
I’m curious, if you think the variations are natural, what’s your objection to the sun being the driver of that variability? As you can see, my very simple models produce stunningly accurate predictions.
“As ever, this study would not have been funded or published if it had not mentioned climate change.”
Somebody should make up a climate change story- that sounds sciency- make it total BS. See if they can get it published. Use all the cliches. It might not get into Science- but I bet it could get published in many major newspapers.
Total BS climate papers have been done already. Michael Mann’s hockey-stick papers fit those criteria, and a Steven Sherwood paper with a zero anomaly in bright red also comes to mind. There must be hundreds of them.
How can that be? Back then, ocean temperatures were simply warm, but today they are boiling.
ERSSTv5 goes back to 1854, though I don’t know whether the Fiji SST data goes back that far. I suspect that they truncated the Fiji data so that there was no overlap with coral data. All of the coral data series are shown complete, so there is lots of overlap. I can only suppose that they truncated the ERSSTv5 data because the earlier dates were inconvenient, ie, the same thing that Michael Mann did with Keith Briffa’s data to get his hockey-stick chart.
So it was just as warm in the Pacific more than half a millennium ago, but the warmth of the 20th century is “unnatural”? How do they separate natural from unnatural? Other than by mere assertion.
500 years ago was basically during the cooling period to the LIA.
Rosenthal used proxy data from Makassar Strait (Indonesia) to construct a much longer series. (Historic notes added by Andy May)
Clearly shows that current SSTs in the region are actually very much at the COOLER end of the range.
bnice2000, didn’t you say: “There is basically no reliable SST data for most of the period of your graphs.”?
I fear the only way we can improve the caliber of studies is to go after the organizations that fund them. The tax payers are not getting their money’s worth from government funded studies. I demand my money not be pissed away on nonsense studies and conclusions.
“We should also ignore that black line, showing current SSTs – splicing of data in this way is a strict no-no in any statistical analysis.”
Now who in the world would use such an underhanded ‘trick’? Maybe someone who should be playing with the “Philadelphia Flyers”, or at least providing their equipment.
Yes, the warmer troposphere is not able to raise the temperature near the surface at the equator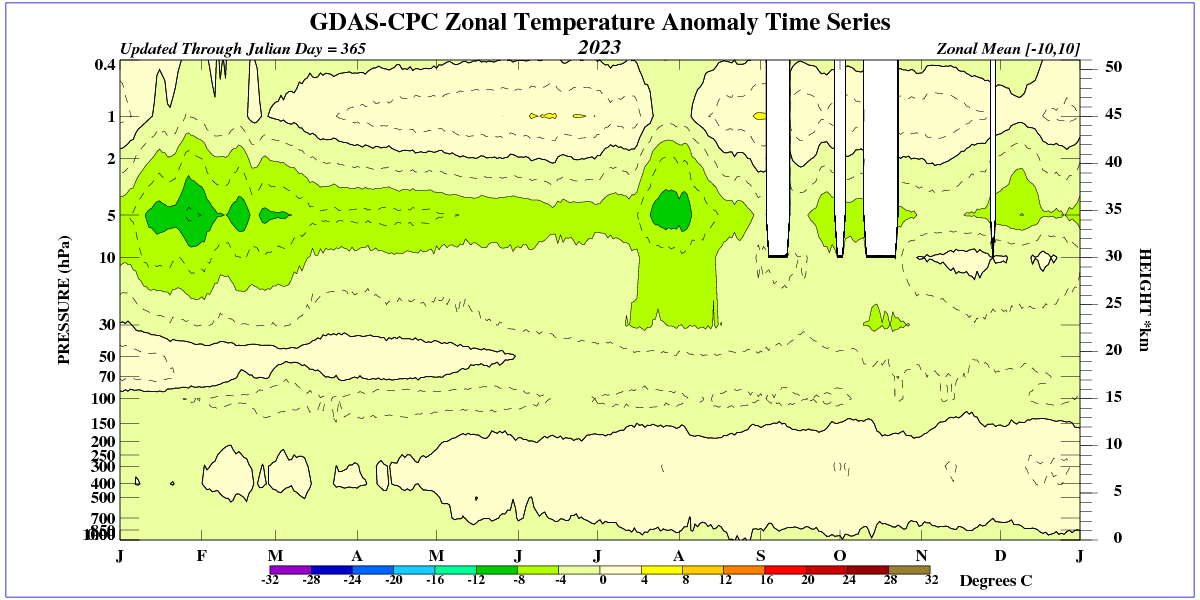
You can see the increased temperature of the troposphere above 1 km above the surface. At the same time, a decrease in ozone production in the upper stratosphere can be seen. It is likely that water vapor over the oceans at the equator is heated by an increase in shortwave radiation (UVB), which should be mostly absorbed by ozone.
There is natural variability in the equatorial Pacific. As you can see, currently ENSO is neutral and will remain so, as the southern polar vortex and atmospheric circulation in the South Pacific are weakened.
http://www.bom.gov.au/cgi-bin/oceanography/wrap_ocean_analysis.pl?id=IDYOC007&year=2024&month=08
SOI values for 21 Aug, 2024
Average SOI for last 30 days -0.96
Average SOI for last 90 days -2.59
Daily contribution to SOI calculation 18.57
Monthly average SOI values
May 3.93
Jun -4.89
Jul -5.83