Via SpaceWeather.com
The monthly sunspot number just hit a 23-year high. The last time sunspots were this numerous, the sun was on the verge of unleashing the Great Halloween Storms, which included the strongest X-ray solar flare ever recorded (X45) and a CME so powerful it was detected by the Voyager spacecraft at the edge of the solar system.
Solar Cycle 25 wasn’t expected to be this strong. When it began in Dec. 2019, experts predicted it would be a weak cycle like its immediate predecessor Solar Cycle 24. If that forecast had panned out, Solar Cycle 25 would be one of the weakest solar cycles in a century.

Instead, Solar Cycle 25 has shot past Solar Cycle 24 and may be on pace to rival some of the stronger cycles of the 20th century. Already in May 2024 we have experienced a century-class geomagnetic storm with auroras sighted in the South Pacific, central America and south Africa.The last time sunspot numbers were this high, the sun was on the verge of launching the Great Halloween Storms of 2003, which included the strongest X-ray solar flare ever recorded (X45) and a CME so powerful it was ultimately detected by the Voyager spacecraft at the edge of the solar system.
Is this Solar Max? The jury is still out. Sunspot numbers may continue to rise in the months ahead and, based on the behavior of previous cycles, we can confidently expect high solar activity for at least 2 to 3 more years. Stay tuned! Solar flare alerts: SMS Text

That’s just great! Another thing to blame on global climate change. Of course caused by man. Can’t wait for the major media reports. /sarc.
> Solar Cycle 25 wasn’t expected to be this strong.
Let’s just admit we aren’t any good at predicting Solar Cycles.
It’s very hard to make predictions, especially about the future
— Old Danish Proverb
Being right is the hard part.
I see lots of money in your future. I’m not sure it’s yours, however.
Was Yogi Berra Danish?
unless it is an absolute absurdity. they are manifest these days.
A bit like weather and climate then.
Leif Svalgaard predicted it would be about 10% stronger than SC#24., which it easily is so far.
Whoa.
The cooling the in the 70s obviously was due to the sun. The pause in the 2010-2020 was obviously due to the sun.
Fascinating correlationships.
Not everyone. I also predicted that SC25 should have activity between that of SC24 and 23 in 2016. I linked to this image in a comment here at WUWT.
https://wattsupwiththat.com/2016/12/21/solar-cycle-25-amplitude-prediction/#comment-1937823
This solar activity prediction is based on the existence of solar activity quasi-periodicities of nearly 50, 100, 200, 1000 and 2500 years. Leif Svalgaard does not believe in the reality of these periodicities and is unable to predict the activity two cycles in advance. According to my projection, SC26 should have an activity between that of SC23 and 22. We should know if this is correct in about 5 years based on the magnitude of the solar polar magnetic fields near the minimum.
My solar prediction has been published in my two books of 2022 and 2023.
Leif’s prediction is based on the sun’s recent physical behavior not your iffy cyclomania.
If SC#26 is in fact stronger than SC#25 won’t even make your prediction “right”. You have about 35 to 75 years to wait for the data to come in to verify your G4 cyclomania “guess”.
After claiming up to 2500 year periodicities, you should have no trouble accurately hindcasting at least some of the recent last 300 years of sunspot activity, but did you?
The glaring issue is why should a consecutive and still higher Modern Maximum be expected?
Heinrich Schwabe could also be accused of cyclomania, and Milutin Milankovitch. The only thing that matters is being right. Then it is not cyclomania but scientific insight.
In 2016 a lot of people were predicting that by SC25 we would be entering a grand solar minimum. Those articles were very popular here at WUWT.
In this figure you have the hindcast from version 2 of my model made over 4 years ago, in 2018, for the first edition of my book:
By the way, accusing somebody of cyclomania is an “ad hominem” attack, not a scientific argument. But when you can’t make a scientific argument you resort to personal attacks, so nothing new.
I remain suspicious of your hindcasted model plot without knowing the exact methodology, which should have first been expressed in mathematical form, along with any parametrization basis to the observed sunspot count (v2), and with documentation of how each mathematical term was determined.
The math model should answer why each solar cycle minima in your activity model lines up perfectly with the actual solar data sunspot minima if your model isn’t specifically tuned to actual sunspot numbers.
The math should answer why there should be a second consecutive Modern Maximum in F4 at all and why there wasn’t such similarly high activity in F1-3.
I was never one of the people pushing the GSM. Just because they were wrong doesn’t automatically accrue special significance to your model.
Cyclo-phobics won’t want to look at this plot where I’ve extracted 11 principal components from Greenland ice core data and projected from 1849 (end of the data) through the next cold period. It seems to capture current temperature trends reasonably well.
I don’t have a lot of confidence in the amplitude of the projection, but the timing seems pretty robust.
Solar activity in nonlinearly encoded in the sunspot data. There’s far too much emphasis on cycle amplitudes.
It doesn’t line up perfectly. My model assumes 11-years for all cycles, so it gets slightly ahead or behind when the actual cycles are shorter or longer. It calculates the total number of sunspots for each cycle and distributes them between the years of the cycle, that is why all the cycles have the exact same shape. Minimum activity for the cycle depends on total activity.
Length and position for all cycles between 50 and 2500 years are calculated from historic sunspot records and 14C records. Each 11-year solar cycle has maximum activity (determined from an average of high activity cycles) that then gets reduced as a function of how close it is to the lows of one of the long cycles.
F3 and F4 have high activity because they are far from the lows of the 1000 and 2500-years cycles. The 200 and 50-year cycles have low effect, so it is basically down to the 100-year cycle to have the bigger effect. As the low of this cycle took place in 2014, SC25 was expected to have more activity than SC24 which is closer to the low.
The model gives valuable information. To reproduce the long cycles, whatever is causing them is actually reducing solar activity, not increasing it. Also the decrease in solar activity is not additive between different cycles when their lows coincide. The one that causes the biggest decrease is the one that manifests. The only ones that show interference are the 200 and 2500-years ones. This interference has been published by other authors. It indicates that changes in solar activity have more than one cause. All this information is extracted from the records, not from the model, but it is required to correctly reproduce the activity.
I don’t care if you are suspicious or not. It is not my goal to convince you or anyone else of anything. I describe what I find. If I am correct and it leads to an increase in knowledge, the better.
Curious though, why use the week long solar overlay instead of the current sunspot image? One could be accused of using Fake Imagery.
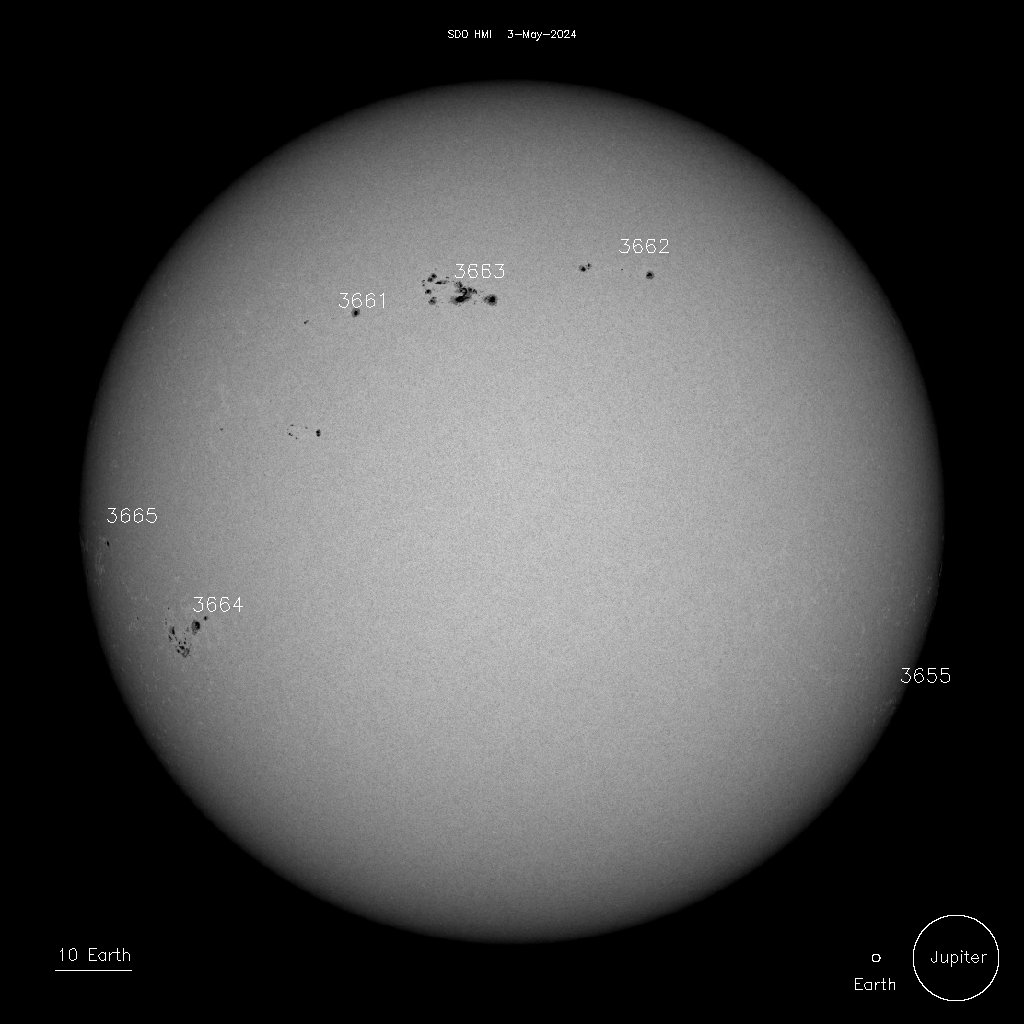
This is the latest SOHO image
I get it…slowly…it is a representation of all the spots of July not any single day (though many still appear repeated)
All those numbers are highly suspicious too.
There’s a little dark spot on the Sun today
In a different place than yesterday
Can’t blame it on Kelvin MacKenzie though!
At first I was expecting some cross eyed stereogram
Yes, I totally agree…not a good way to display this unless you are from the climate alarmism school. The single day image that you show is impressive enough in its own right…no need to exaggerate.
And yet – according to the Church – the Sun has no real impact on Earth’s climate.
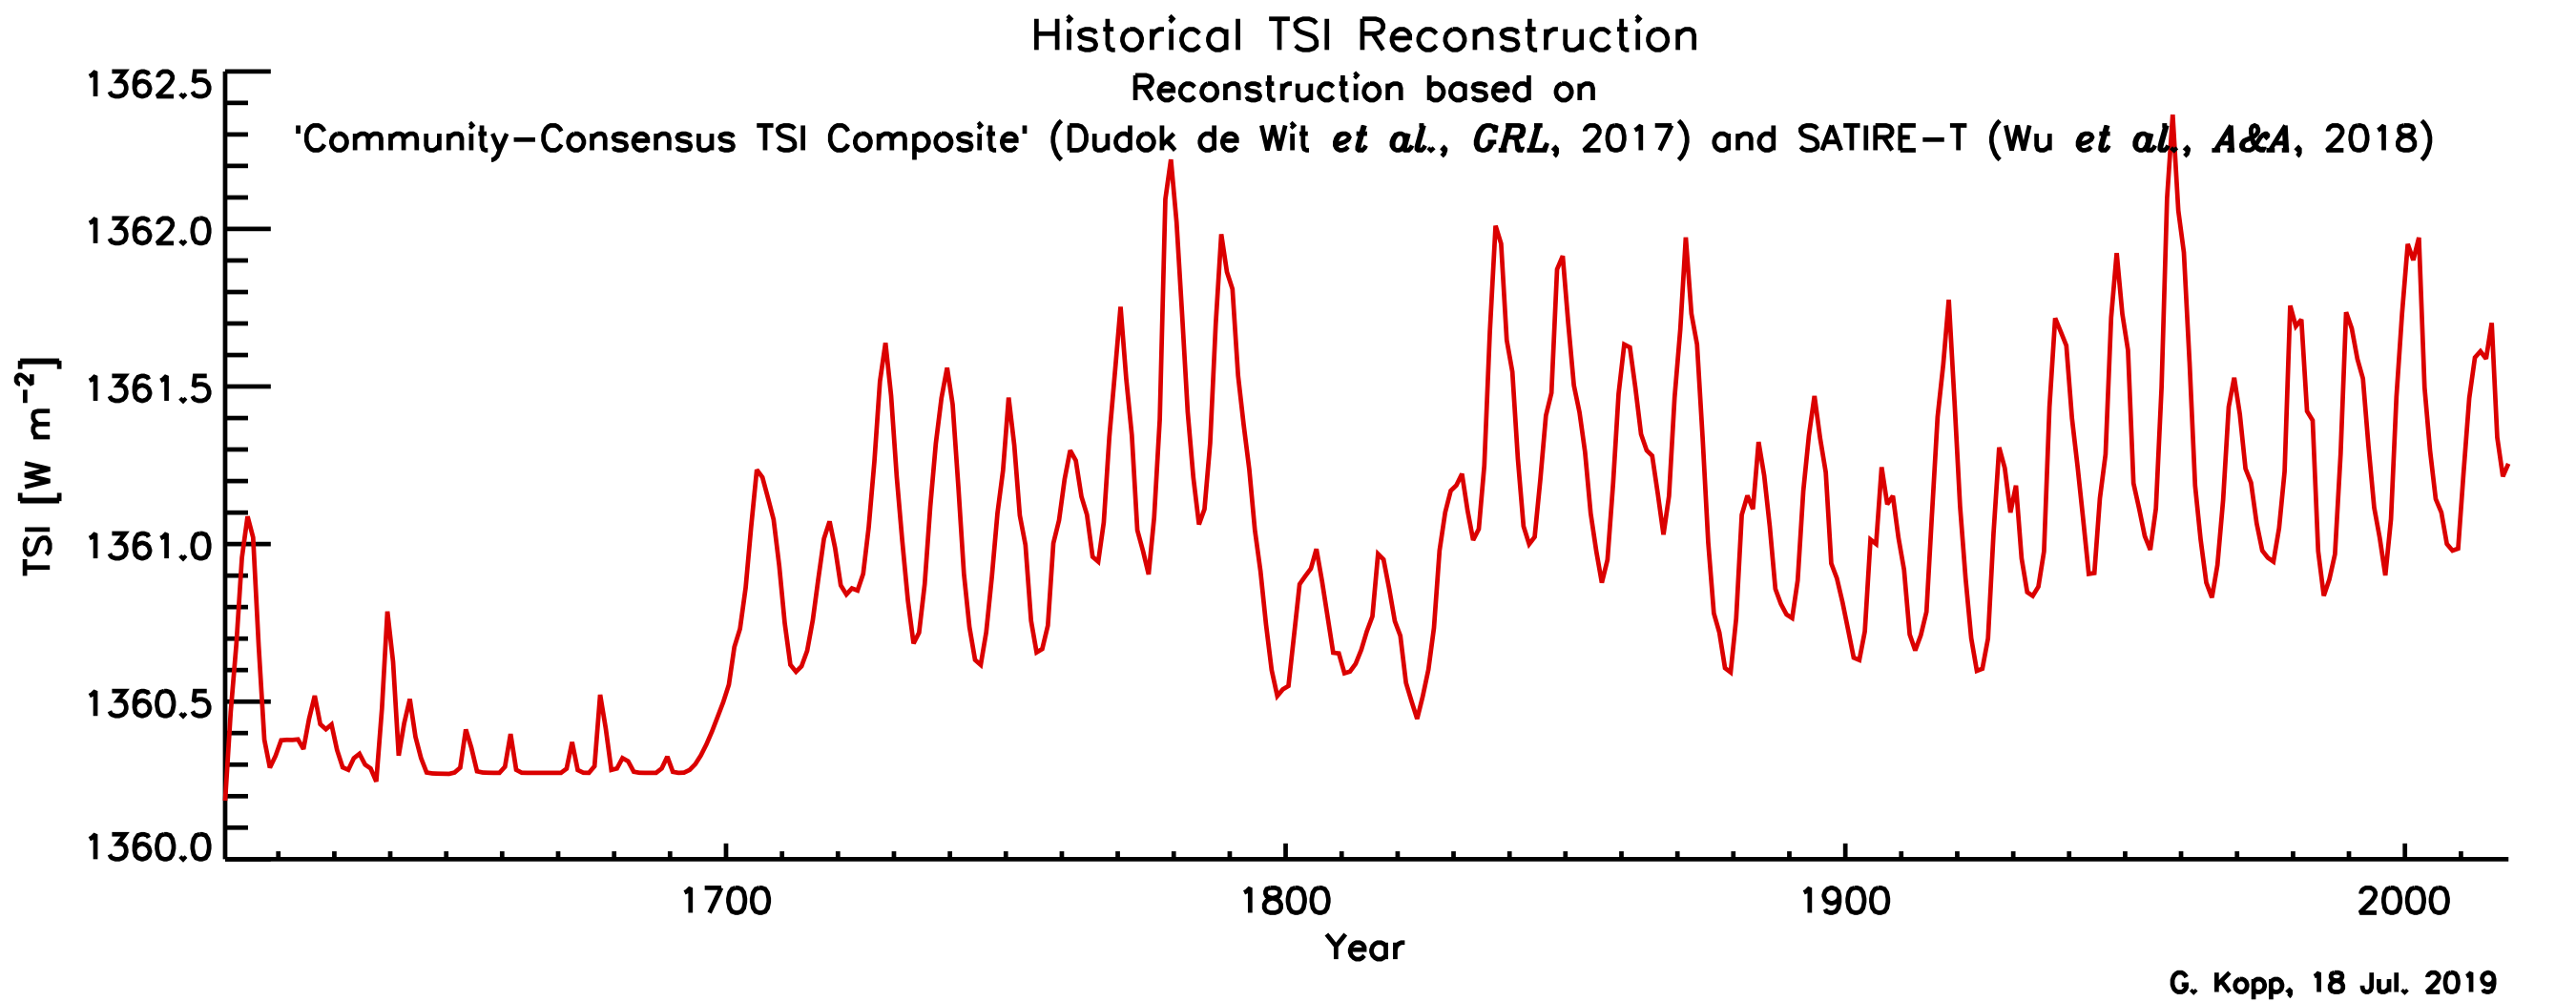
One of the “smoking guns” that tells us the Sun is not causing global warming comes from looking at the amount of solar energy that hits the top of the atmosphere.
https://science.nasa.gov/climate-change/faq/is-the-sun-causing-global-warming/
Well, if NASA says so, it must be political.
I think NASA owes us an Apollo G.
NASA has made estimates of TSI dating back to the 1600s. The estimate that the solar output at 1AU was 1360.1W/m^2 back than. This month is will exceed 1362W/m^2.
On surface average, the 2W/m^2 increase comes back to 0.25W/m^2 but the full 2W/m^2 is still occurring at zenith and it is the strength of the sun that sets the daily maximum temperature.
So a real increase in sunlight of 2W/m^2 is supposed to have done nothing to warm the planet but an imagined 1.3W/m^2 from CO2 is warming the planets.
Off topic. The UK is under new management
Clashes broke out in Liverpool, Manchester and Hull with officers making multiple arrests.
Violent skirmishes also broke out between rival groups in Belfast, while stones and bottles were thrown at police in Stoke and Blackpool.
https://www.telegraph.co.uk/news/2024/08/03/southport-attack-latest-sunderland-riots-spread/
That’s in addition to Sunderland, Southport, and London
You forgot Hartlepool! (where they’ve got form for this sort of thing) –
https://www.youtube.com/watch?v=cQwQ_nPhx-o
(just skip the commercial as soon as you can)
And Bristol
Just send all the White British back where they came from, ie Europe!
Look out Germany and Scandinavia
The Celtic Fringe British came from France and Iberia.
Ultimately, we all came from Africa
True. Everyone in Asia, Oceania, Europe, the Americas and Antarctica should be sent back to Africa.
Even those of us with Neanderthal and Denisovan ancestry are colonists in Eurasia, Oceania and the Americas.
That’s most of us.
There was at least one team of astrophysicists who correctly predicted that cycle 25 would be more active than any of the recent cycles.
Absract to their Arxiv paper.
The Sun exhibits a well-observed modulation in the number of spots on its disk over a period of about 11 years. From the dawn of modern observational astronomy, sunspots have presented a challenge to understanding—their quasi-periodic variation in number, first noted 175 years ago, has stimulated community-wide interest to this day. A large number of techniques are able to explain the temporal landmarks, (geometric) shape, and amplitude of sunspot “cycles,” however, forecasting these features accurately in advance remains elusive. Recent observationally-motivated studies have illustrated a relationship between the Sun’s 22-year (Hale) magnetic cycle and the production of the sunspot cycle landmarks and patterns, but not the amplitude of the sunspot cycle. Using (discrete) Hilbert transforms on more than 270 years of (monthly) sunspot numbers we robustly identify the so-called “termination” events that mark the end of the previous 11-yr sunspot cycle, the enhancement/acceleration of the present cycle, and the end of 22-yr magnetic activity cycles. Using these we extract a relationship between the temporal spacing of terminators and the magnitude of sunspot cycles. Given this relationship and our prediction of a terminator event in 2020, we deduce that sunspot Solar Cycle 25 could have a magnitude that rivals the top few since records began. This outcome would be in stark contrast to the community consensus estimate of sunspot Solar Cycle 25 magnitude.
Why don’t you refer to the paper and its authors?
Overlapping Magnetic Activity Cycles and the Sunspot
Number: Forecasting Sunspot Cycle 25 Amplitude
Scott W. McIntosh · Sandra Chapman · Robert J. Leamon · Ricky Egeland · Nicholas W. Watkins
https://link.springer.com/content/pdf/10.1007/s11207-020-01723-y.pdf
I don’t read the same you do, Alan.
That predictions is already very wrong, as SC25 is so far the 10th lowest out of 30 cycles.
So far….
Ja. Great. Must be due to more CO2 in the atmosphere…
The coincidence of the polar reversal of both the NH and SH may account for the sharp peak.
Much to go before this is fully understood.
Not wanting to imply any causal connection but summer 2003 in the U.K. and Europe was very hot, not sure what it was like in the USA then compared with this year.
While I find the sunspot cycle to be interesting ‘space weather’ in and of itself, I find any connection between it and weather or climate to be very unconvincing.
The SkyLab crashed out of orbit because they didn’t realize that the atmosphere expands
and contracts. All the satellites in orbit need their orbits constantly adjusted due to the
changes. One of the hypothesis behind this is the sunspots produce a large amount of UV
radiation which when it hits our atmosphere it produces ozone. The ozone rises to the
tropopause which expands which in turn has an effect on the storm track. During the solar
maximum the atmosphere expands which in turn makes the jet stream zonal and when it
contracts it becomes meridional eg wavy which slows down the jet with the flows becoming
more north to south or south to north. The head of risk management for Cargill gave a presentation
on this subject a number of years ago and a regular on this board Stephen Wilde has studied
this in depth.
Your points are not accurate:
A. There has been direct measurement of TSI by satellite, and this data used to correlate sunspots and TSI. For example:
B. All tropical regions show a good response to TSI/Sunspots. This is to be expected since the tropics have less annual solar variability so the response to TSI stands out. Other regions exhibit cycles in the 9 to 12 year range that are likely linked to TSI but their latitude causes a frequency shift from what is actually occurring on the sun. The sunspot activity moves across the face of the sun so the observer on Earth is not getting the full view of what is happening.
C. It is easy to show that the Sun was in a period of low gravitational excitation from 1490 to 1660. This is the period of low TSI. Earth observer could get a slightly altered time frame.
I have found very good correlation between the gravitational excitation of the sun and TSI. The basic cycle runs over 1680 years but goes positive and negative so the peak in absolute excitation are 840 years apart. We are right at the peak of the modern optimum. The peak in gravitational energy from the Sun’s perspective occurred in 2019 but there is a phase shift between the peak gravitational acceleration and the generation of sunspots.
 ?fit=1040%2C720&ssl=1
Sorry, but you fail in you figure 1, whose claims are obviously false. If you want to debate climate stuff with me, at least bring things not obviously false on their face.
Don’t be sorry. It makes you sound condescending.
Not my figure but from the SORCE page at LASP.Colorado.
https://lasp.colorado.edu/sorce/data/tsi-data/:
I am pointing out that there have been commendable efforts to correlate measured TSI with sunspots that I am showing in what you term my figure 1..
My TSI comes straight from the gravitationally induced spin of the sun. Which means I can predict it with a high degree of accuracy.
Right now we have similar solar activity to what was occurring during the Roman Warm Period. Anyone with a little curiosity and maths knowledge can derive that using the NASA GISS JPL Horizons data:
https://ssd.jpl.nasa.gov/horizons/app.html#/
You need to have time divisions of 100 days or less to properly resolve the angle of the force because its rotational velocity varies considerably.
Rud:
Story tip
Please would someone critique this paper
https://agupubs.onlinelibrary.wiley.com/doi/10.1029/2020GL091585
I was pointed to it by someone on X and I have my own thoughts but would appreciate other opinions.
By taking a whole set of assumptions they claim they can separate the radiative forcing from the radiative climate feedbacks. If the assumptions are wrong, the paper is wrong. It is highly unlikely that their assumptions are right, so it is highly likely that the conclusions of the paper are wrong.
Has Ol’ Sol been tested for melanomas recently?
Is this happening because I drive a gasoline-powered vehicle?
No. It’s the hydrogen drivers. 😎
With the increase in sunspots and, with it, an expansion of the heliosphere, we should prepare ourselves for decreases in cloud cover and increases in global temperatures.
But, not to worry, the AGW crowd will claim the temperature increases were caused by increases in CO2.
We are at the peak of the modern optimum.
 ?fit=1040%2C720&ssl=1
But it isa a long descent into the next quiet sun. Will not occur until 2400s.
We’ve had the beginning of this discussion before that gravitation, in this case gravitational ‘torque’, is somehow tied to what is driving sunspot and I just don’t see how it’s a productive path to start down on again.
I’ve seen people try to build models of why the Sun goes through these cycles before and it’s clear that nobody really understands how to build predictive models of the chaotic system that the Sun is.
Trusting anyone to predict that the next solar sunspot minimum will occur almost 200 years out, in 2400, seems… naive.
I put 2400 almost 400 years away not 200 years.
It may be naive to some but not for anyone who has looked closely at how the sun moves. You may be surprised to learn that the gravitational force vector on the sun averages 4300 Earth days to cycle around the barycentre The position vector averages considerably slower at 4424 days and the velocity vector just a little slower at 4331 days. This is straight from NASA GISS JPL Horizon data.
Currently the sun has high accumulated gravitational energy. It has been spun up to near its peak with its actual orbit centred well away from the barycentre. It will take 400 years from now for the centre of orbit to be back near the barycentre as it was in the 1600s. It will then go through a power reversal and give up gravitational energy to the planets. The current optimum, aligning with peak power uptake, is similar to the conditions during the Roman Climate Optimum. The Medieval Warm Period aligns with the sun at it maximum loss of power to the planets.
The chart above is only based on the centre of mass around its true centre of orbit, which changes as the gravitational energy transfer changes. The actual axial spin is related but you do not need to undertstand that to understand that the sun gains and loses gravitational energy through interchange with the planets.
Where do you think the energy to increase the spin of the sun comes from? Why is the equatorial zone spinning faster than the higher latitudes? Why is the spin now slowing down?
When the solar system ephemeris was produced, the orbiting bodies were approximated to point masses of infinite density to make for simple calculations. But gravitational force can transfer torque to a body of real dimensions. The Sun and planets do not have infinite density. They have real dimensions, not zero. Most people confuse the approximation as meaning the gravitation field cannot transfer torque. When you look at the axial spin being transferred to the sun from the planets, there is extremely good correlation with measured and reconstructed TSI output and sunspots.
Ever wonder why Venus is a a solid rock despite being close to the same size as Earth but Earth has a molten core. Mars is much smaller than both and has a molten core. Now look at their respective orbital eccentricities.
Well, according to UAH data for GLAT based on satellite observations (see most recent at https://wattsupwiththat.com/2024/08/01/uah-global-temperature-update-for-july-2024-0-85-deg-c/ ), starting in 2001.5 (i.e., 23 years ago) Earth experienced an interval of about 8 years with basically ZERO average rate of rise of global atmospheric temperature.
Just wondering if (climate) history will repeat itself?
What Roy Spencer shows on his graph is by no means the atmosphere: it is the lower troposphere, i.e. a little piece of the troposphere, itself a little piece of the atmosphere.
Do you understand the meaning of the acronym “GLAT” that I used in my post?
Also:
“Most of the mass (about 75-80%) of the atmosphere is in the troposphere.”
— https://scied.ucar.edu/learning-zone/atmosphere/troposphere
The image seems misleading. It seems to be a composite as rotation occurs, very obvious patterning. But I saw nothing about that in the copy.
No one could have predicted except Miles Mathis who has been accurately predicting these cycles for years. Looking forward to the Spaceweather folks finally acknowledging him. Read his articles on mileswmathis.com for his methodology. He publishes everything.
Oh my. When good old Sol gets active, things start going wild. I am of the belief that Sol drives all of the climate in the Solar System.
The sun is not as significant as Earth’s orbit. It is the orbit that will push Earth out of the present interglacial. I expect the sun will have some say in the timing. The next minimum in TSI will be in 2400. With warming oceans in the NH that means much more snow than in 1600 and I predict it will accumulate for thousands of years after 2400.
I’ll be watching for it. 😉
Huh!. And this means, as far as the weather goes…..??????
We need to institute a Solar Activity Control tax immediately!
According to the SILSO data, SC 25 looks pretty good and is far from many “predictions” that placed it below SC 24 – starting with Zharkova’s (but she wasn’t the only one who got it completely wrong).
Daily SSN
Monthly SSN
But the sun has no influence on the climate. It is steady and has no variations.
Since we cannot predict the solar influence on terrestrial climate, we will zero out any natural variations and attribute everything to evil men and women.
Have I got that right?