From Dr. Roy Spencer’s Global Warming Blog
by Roy W. Spencer, Ph. D.
The Version 6 global average lower tropospheric temperature (LT) anomaly for June, 2024 was +0.80 deg. C departure from the 1991-2020 mean, down from the May, 2024 anomaly of +0.90 deg. C.

The linear warming trend since January, 1979 remains at +0.15 C/decade (+0.13 C/decade over the global-averaged oceans, and +0.20 C/decade over global-averaged land).
The following table lists various regional LT departures from the 30-year (1991-2020) average for the last 18 months (record highs are in red):
| YEAR | MO | GLOBE | NHEM. | SHEM. | TROPIC | USA48 | ARCTIC | AUST |
| 2023 | Jan | -0.04 | +0.05 | -0.13 | -0.38 | +0.12 | -0.12 | -0.50 |
| 2023 | Feb | +0.09 | +0.17 | +0.00 | -0.10 | +0.68 | -0.24 | -0.11 |
| 2023 | Mar | +0.20 | +0.24 | +0.17 | -0.13 | -1.43 | +0.17 | +0.40 |
| 2023 | Apr | +0.18 | +0.11 | +0.26 | -0.03 | -0.37 | +0.53 | +0.21 |
| 2023 | May | +0.37 | +0.30 | +0.44 | +0.40 | +0.57 | +0.66 | -0.09 |
| 2023 | June | +0.38 | +0.47 | +0.29 | +0.55 | -0.35 | +0.45 | +0.07 |
| 2023 | July | +0.64 | +0.73 | +0.56 | +0.88 | +0.53 | +0.91 | +1.44 |
| 2023 | Aug | +0.70 | +0.88 | +0.51 | +0.86 | +0.94 | +1.54 | +1.25 |
| 2023 | Sep | +0.90 | +0.94 | +0.86 | +0.93 | +0.40 | +1.13 | +1.17 |
| 2023 | Oct | +0.93 | +1.02 | +0.83 | +1.00 | +0.99 | +0.92 | +0.63 |
| 2023 | Nov | +0.91 | +1.01 | +0.82 | +1.03 | +0.65 | +1.16 | +0.42 |
| 2023 | Dec | +0.83 | +0.93 | +0.73 | +1.08 | +1.26 | +0.26 | +0.85 |
| 2024 | Jan | +0.86 | +1.06 | +0.66 | +1.27 | -0.05 | +0.40 | +1.18 |
| 2024 | Feb | +0.93 | +1.03 | +0.83 | +1.24 | +1.36 | +0.88 | +1.07 |
| 2024 | Mar | +0.95 | +1.02 | +0.88 | +1.35 | +0.23 | +1.10 | +1.29 |
| 2024 | Apr | +1.05 | +1.25 | +0.85 | +1.26 | +1.02 | +0.98 | +0.48 |
| 2024 | May | +0.90 | +0.98 | +0.83 | +1.31 | +0.38 | +0.38 | +0.45 |
| 2024 | June | +0.80 | +0.96 | +0.64 | +0.93 | +1.65 | +0.79 | +0.87 |
The full UAH Global Temperature Report, along with the LT global gridpoint anomaly image for June, 2024, and a more detailed analysis by John Christy, should be available within the next several days here.
The monthly anomalies for various regions for the four deep layers we monitor from satellites will be available in the next several days:
Lower Troposphere:
http://vortex.nsstc.uah.edu/data/msu/v6.0/tlt/uahncdc_lt_6.0.txt
Mid-Troposphere:
http://vortex.nsstc.uah.edu/data/msu/v6.0/tmt/uahncdc_mt_6.0.txt
Tropopause:
http://vortex.nsstc.uah.edu/data/msu/v6.0/ttp/uahncdc_tp_6.0.txt
Lower Stratosphere:
http://vortex.nsstc.uah.edu/data/msu/v6.0/tls/uahncdc_ls_6.0.txt
And if similar to previous el Ninos, will drop to 0.2 or 0.3 over the next year and a half…at which point it won’t be mentioned in the boiling ocean media hysteria….
I’ve got my eye on a new pair of slippers.
Already got mine. The previous pair had worn out, so it has nothing to do with climate or weather.
https://pbs.twimg.com/media/GMqak9PaMAALe9Y?format=jpg&name=small
As the Water vapor, falls out of the upper atmosphere…Just sayin…
Thanks for posting that! I’ve been wondering about the moisture content in the upper atmosphere following the volcanic eruption.
Here is an interesting view of the H2O concentrations by latitude, we are in the last year of significant effects. Also, any data about ppm of H2O in the stratosphere is merely a proxy, we have no idea what the true changing PPM value of H2O in the stratosphere over the years, only relative guesses.
Upper stratosphere concentrations:
Graphics produced by IDL (nasa.gov)
Source Page
The Quasi-biennial Oscillation (QBO) MLS Water (nasa.gov)
Note about the Stratosphere
HT (Hunga Tonga) put 1.2 trillion gallons of water into the stratosphere.
HT raised stratospheric humidity levels by 10%.
Aviation adds 90 billion gallons to the stratosphere annually (7.5% of HT).
Water Vapor takes 3 to 4 years to cycle through the Stratosphere.
And anyone that think HT vapourised all that water, without transferring one heck of a lot of energy to the oceans around it….
.. really doesn’t have a single brain cell in their head.
I am not sure what you are saying, but based on the data and my analysis, stratospheric water vapor and aerosols are the only thing that make any difference in our lives, climatically speaking.
A speck of heat for 1 day in an ocean, matters not.
Except you could look at the Antarctic sea ice response.
And if you really think the HT was just a single day event, you haven’t been paying any attention.
It was rumbling away constantly for more than a month before.
I have looked at Antarctic sea ice, the response is radiative from the HT water vapor.
I have modeled it extensively.
Still active and therefore spewing out heat.
Explosive Tonga volcano ‘surprisingly intact’ (bbc.com)
It could be spewing out heat and augmenting something, but the H2O emitted by it (H2O years ago) still floating around the stratosphere is very much in control of the thermostat of planet Earth right now.
I am not saying the stratospheric H2O is not having a large effect…
I just think we also have to consider the amount of energy put into the ocean itself.
Ocean plus atmosphere.
Should also remember that HT last erupted in 2014/15 just before the last strong El Nino…
related.. maybe, maybe not.
Here is a reference, no doubt the El-Nino was super charged by HT. After more analysis, it is my opinion that El-Nino’s warm the planet by putting more H2O in the Stratosphere. La-Nina’s cannot cause less warming anymore because aviation is constantly adding water vapor. Think about it, the stratosphere is the greenhouse window, sandwiched between the troposphere and the mesosphere, (A volume of gas of ionized atomic elements only on one side), and complex organic molecules of life on the other. Imagine being able to change the chemistry of your double paned windows if you wanted to alter the light coming in. Thats what the stratosphere is, a variable greenhouse window.
?
The El-Nino warming, and Hunga Tonga water vapor event coincided to create an anomalous warming event.
Change your verbiage from greenhouse window to EM filter and I will agree.
Sounds good, drilling down a little more accurately, we are impeding energy, nothing on the surface can cool as fast as pre-HT, because the heat flux of the planet is pushing against a trillion gallons of extra water in the Stratosphere.
Very interesting graph. It’s not much water vapor and it’s very high—only 2g/m2 of air column from 20 to 80 km above sea level. I wonder what effect it has on the troposphere.
We seem to share a similar curiosity, here is a model of:
Top graph: Stratospheric H2O aviation + HT water vapor in Billions of gallons
Middle graph: Estimated temperature increase from known stratospheric H2O delta’s
Bottom graph: UAH Global
This model is a simple Stefan Boltzmann equation, no tweaking, matched observations quite well.
HT may have just proven that global warming is caused by aviation. And my model says that we will continue to see warm summers for some time, and continuing vortex breaches.
Please post the “simple Stefan Boltzmann” equation.
Just run that for each delta in your cause vector. This will return a forcing in Watts M^2, divide by 4 to get forcing anomaly temp in C.
For instance, set c0 to 280 (as in 280 ppm in 1885) and run it for 400 ppm you will see a hatchet approach of determining the effective warming, assuming the gas you are working with is effective.
public static double StefanBoltzman(double c0,double c)
{
const double steffConst = 5.35;
var a = c / c0;
if (!double.IsNaN(a)&& a != 0)
{
return Math.Log(a) * steffConst;
}
return 0;
}
Is that C#?
Yes, I write everything in C#, the plots are ScottsPlot, which has assemblies for a variety of languages, even scripting.
Cool. I’ve been using C# for years.
Wow, yes, it is very powerful high-level language, but you can get down to C level bit fiddling if needed.
This isn’t a “simple Stefan Boltzmann” equation it is computer code.
What emissivity did you use for CO2? If you used anything other than zero you did something wrong. What is zero times any number?
That is nothing like a Stefan Boltzmann equation. Where is the T^4? Or T at all?
It is the equation for log dependence of radiative forcing on [CO2], where 5.35 is Myrrhe’s constant. It is specific to CO2.
Global warming has NO single cause.
In the context of when global decadal temperature trends stopped correlating with solar activity and ocean proxies, I think it does.
Graph from January 2024. Might take another 2.5 years for stratospheric water to drop back to average.
upcontry’s link shows one very steep drop on the water vapor content and then it levels out again.
Was that Northern Hemisphere winter, or some other cyclical event that should repeat again in the future?
Warmest June in UAH data, beating the long standing 1998 record by 0.36°C.
This is the 12 month in a row to be a monthly record, which is itself a UAH record.
Big question now is how quickly will it cool down now the El Niño is over.
Difficult to see 2024 not being a record warm year, which will mean the first back to back records in UAH.
(And yet in the UK, this June was colder than May).
Record year in a 2.5 million year ice age isn’t saying much.
This ice age named the Quaternary Glaciation won’t end until all natural ice melts.
Outside the tropics almost everyone is living and working in heated building, using heated transportation and wearing warm clothes for most of the year..
Yes. Most unusual for June to be colder than May – in fact the first time since 1833, according to the Central England Temperature series
Forgot to add, this is also the warmest June for the US in the UAH data.
We still have to bundle up and use heating most of the year.
Where? Not in the Pacific Northwest. It’s been very cool and wet. By this time it’s typically warm and dry, yet my lawn is still green. You can’t lump everything together.
“Where?”
You’ll have to ask Dr Spencer that, or wait for him to release the map and grid data.
“You can’t lump everything together.”
You sort of have to if you want the overall picture. Otherwise all you have is people complaining about the weather in their own back yards.
How else does one experience weather? Tell me, can an individual experience or feel ‘ global temperature’?
The irrationality of the CAGW is well understood.
Tell us bellboy.
What do you think of people living in Canada that are scared and panicking about a degree or so of warming ?
Are they as moronically STUPID as you are ??
I can tell you in Kansas the grass is still green on July 4th. We have had plenty of rain and no prolonged days of 100F. That is undoubtedly unusual. By July 4th the grass is usually dry and mostly dormant so there is a large fire hazard from fireworks. June was warm, not hot, I would say not unusual, simply weather.
Why do you keep trying to turn this into an argument with me? I am merely pointing out an interesting observation from the published UAH data. If you think the data is wrong, then you could ask Dr Spencer about it.
But remember, UAH is satellite data. It’s the estimate of the lower troposphere, not the ground temperature. As such it is probably a less reliable guide to exact regional variations. Unfortunately it’s also the only data that is trusted here. Also unfortunately, Dr Spencer likes to rush out the headline figure as quickly as possible, but we then have to wait until the gridded data and maps come out.
As to your point about Kansas, I can’t help you. But as with May’s UK temperatures, there can often be a distinction between perceptions of heat, and actual measured temperatures. A lot of rain and few very hot day time temperatures does not mean it hasn’t been warm overall.
“You sort of have to if you want the overall picture.”
The “overall picture” is misinformation. It gives the false impression that temperatures everywhere rise and fall in lock step. Couldn’t be further from the truth.
No. The global average temperature does not give the impression that temperatures everywhere rise and fall in lock step. That impression is solely on you because of the erroneous way in which you interpret it. This should be plainly obvious by looking at the UAH gridded data here. Notice that upward/downward movements in the global average temperature occur simultaneously with opposite movements local temperatures. In fact, it is all of those local temperatures upon which the global average temperature is built. So they are both consistent with each other.
Oh the irony — these are the effects of supposed uniformly mixed gas?
Well spotted!! The Famous Greenhouse Effect should cause a uniform degree of warming at every point on Earth. This has not happened.
The map is now up.
If you think it’s wrong take it up with Dr Spencer and co. I’m just the messenger.
It could be a double El Niño in which case some people will lose sleep and still manage to wet the bed. Such is life.
bellman believes a delta-T anomaly is a real temperature.
I’m only seeing that the current El Nino spanned 1 winter. Prior to that there was a triple dip La Nina. Can you clarify what you mean by “double El Nino”?
OMG.. there has been a double peak on the UAH data.. Open your eyes. !
The trendologists can only see straight lines.
Yep, this El Nino has been a really long, solid El Nino hasn’t it.
But absolutely no evidence of human causation.
“But absolutely no evidence of human causation.”
Oh dear. bnice’s memory is going again.
And that proves?
Well, my Ph.D. ain’t in psychiatry, but I think it might show, and possibly prove that Bellman believes that when temperatures rise on planet earth, not only is it bad, but it’s solely the fault of humans.
You could probably earn a PhD in Psychiatry just by trying to analyse the brain function, if you could find it, of these AGW clowns.
Try not to go insane like them while doing so.
“Well, my Ph.D. ain’t in psychiatry, but I think it might show, and possibly prove that Bellman believes that when temperatures rise on planet earth, not only is it bad, but it’s solely the fault of humans.”
What it actually shows is that when asked to give evidence that CO2 might have caused warming, I provided some evidence. What you are doing, is providing an ad hominem argument to reject the evidence. Nothing to do with the evidence, just an assumption about my motivation for providing it.
Except you have not provided any evidence of CO2 warming.
But don’t let that fact confuse you.
No evidence whatever of Human causation.
Actually, I take that back: contamination of the data by UHI.
Yes, we know that.. and the manic data adjustment by the climate cabal.
But….
The adjustment values are not real temperatures…
And it is NOT GLOBAL… Urban area is some 2-4% of the planet, but that is where most of the surface sites are.
1… NOT GLOBAL… URBAN
2… Other graph warming is infilling and junk data adjustments.
3… Junk model disregarding the real energy source.
4… The whole graph is a meaningless piece of non-science propaganda GARBAGE.
Such an incredibly PETTY and DECEITFUL switch to GISS..
…. which the bellboy KNOWS is a load of massively tainted surface stations garbage.
No-one with even a single operational brain cell would ever call it “scientific” evidence.
Yet bellboy presents it any way. DUMB, DUMB, DUMB !!
Bnice really doesn’t like being shown evidence. Somehow, now, it’s deceitful to use a longer data set.
OK, here’s the same using just the UAH data.
A couple of points here:
Bellman says:”…that CO2 could cause warming,…”
Please be specific and describe how CO2 could cause warming.
It impedes the transmission of energy to space.
NO, it does not impede anything.. You have no evidence of that.
It absorbs then relays it through the atmospheric system in one way or any other.
Any tiny absorption in the CO2 band is passed through the atmospheric window.
There’s this thing called the greenhouse effect. CO2 is a greenhouse gas. It would seem reasonable to me, therefore, that increasing CO2 might lead to an increase in temperatures.
If you want a more detailed explanation of the physics, you are asking the wrong person. I’m sure there are many books on the subject.
Ok, where’s the evidence that it’s capable of driving long-term warming, overriding natural influences? All you guys have are models.
A funny little fairy-story with no evidence.
Warming by atmospheric CO2 has never been observed or measured anywhere on the planet.
The atmosphere is actually controlled by the gas laws, and CO2 is just part of that gas.
The only molecule that has any effect on the gas laws is H2O
Are you sure CO2 traps outgoing radiation? Models seem to be opposite of EBRE satelite measurements.
Plus papers.
https://www.researchgate.net/publication/355122245_Radiative_Energy_Flux_Variation_from_2001-2020
Only the Russian model doesn’t furiously generate a troposheric hotspot by parameterising ocean rainfallto ARGO data.
https://link.springer.com/article/10.1007/s00382-017-3539-7
Here, AR6 models are shown not to mass and energy balance very well at all.
The drifts and systemwide energy leaks approaches or exceeds the estimated current planetary imbalance for a number of models.
https://journals.ametsoc.org/view/journals/clim/34/8/JCLI-D-20-0281.1.xml
The measurement uncertainties associated with *all* of climate science are so large that they make it impossible to tell what is actually happening at the level of precision and accuracy climate science claims.
Most climate science claims are nothing more than the fortune teller at the carnival seeing your future in a cloudy crystal ball. Climate science is just unwilling to admit that their crystal ball is too cloudy to tell anything for sure.
So you don’t understand what you’re defending.
CO2 has no emissivity at normal pressure and below about 30 C. So it can’t do what you think.
NO, it is NOT evidence, not by any shot.
It is pure supposition and conjecture.
You can only make by ignoring the warming steps at El Nino events.
“This is offered as evidence that CO2 could cause warming”
Rubbish… surface data can’t be used for anything. Certainly not to show CO2 atmospheric warming.
Way too tainted and corrupted.
You have a very anti-science view of “evidence”
FAIL !!
The trendologists can’t get it through their heads that their graphs and correlations can’t tell if CO2 is driving temp or whether temp is driving CO2. They just keep repeating their dogma that CO2 is driving temp.
Almost as if correlation doesn’t imply causation.
But in this case there are multiple reasons why temperatures driving CO2 is a lot less plausible than CO2 driving temperatures.
Malarky! As the oceans warm from the sun they outgas CO2. Climate science’s estimate of manmade CO2 has just as much uncertainty as their measurements of temperature. The correlation between the two, CO2 and temp simply can’t be used as proof of *anything* associated with man-caused climate change.
Your religious belief in CAGW is showing.
“It can just be the result of a continuous warming trend and fluctuations”
But don’t expect the one-celled organism to understand that.
That is a good illustration of how a cyclic process can be superimposed onto a long term trend yield a pause-up-pause-up pattern.
Let’s be generous. That shows temps increasing by what, 0.7C over ~50 years? Let’s say 1.4C over the next century. And you think that is a good reason to destroy economies, prevent poor regions from growing their economies with cheap fuel, and to make more people poor due to high energy prices.
Get real. You can’t walk out your door and tell the temperature to within ±1.5C. Every species on earth (except maybe at the poles) experience temp changes far exceeding that every day, let alone every season.
Even if you think a 1.5C or even 3C ΔT will occur, show how that would be a bad thing if it extends the time until the next glaciation.
No one here denies a slight warming, although it is probably occurring because of higher nighttime temperatures and not daytime temperatures. You would do better than simply saying, “See I told you temps were increasing.” by investigating in more detail why they are increasing.
People are trying to tell you that there is more to it than just an increase in CO2, but you continually attempt to convince everyone that is incorrect because temperatures are increasing because of CO2. You even admit it is only correlation, and not a casual fact. Look closely at your model. You include CO2 and that is the only variable that could possibly be anthropogenic unless you think the others are also caused by humans. Good luck with that. What it does is make you a CAGW trendologist freak.
Why these continuous moving goal posts? The question was if I could provided some evidence using only UAH data that CO2 was causing warming. Not, how bad or good the warming is, or what could be done to stop it, or how much it would cost.
I am not getting into those arguments – they are way beyond my pay grade. And they are immaterial to the question of what is causing the warming.
“No one here denies a slight warming”
The person I’m arguing with denies the warming has anything to do with CO2. That’s where I disagree.
“although it is probably occurring because of higher nighttime temperatures and not daytime temperatures.”
And your evidence for that is?
“You would do better than simply saying, “See I told you temps were increasing.” by investigating in more detail why they are increasing.”
That was the purpose of the exercise. Maybe you should read the whole thread before jumping in.
“People are trying to tell you that there is more to it than just an increase in CO2”
No – the person I was replying to, is very clearly saying CO2 has nothing to do with he warming, and that all warming is caused by El Niños.
“but you continually attempt to convince everyone that is incorrect because temperatures are increasing because of CO2.”
Again – correlation is not necessarily causation. The point is to show that warming is consistent with CO2, not to prove that’s the cause. When you are only using the short UAH data, just about anything increasing more or less linearly will have a correlation. That’s why the longer surface data is more useful – but as usual that’s rejected out of hand.
“Look closely at your model. You include CO2 and that is the only variable that could possibly be anthropogenic unless you think the others are also caused by humans.”
As the whole point was to rebut the claim there is no evidence for human causation, I’m not sure how much it helps to include other anthropogenic variables.
“saying CO2 has nothing to do with the warming, and that all warming is caused by El Niños.”
And you have provided zero evidence to counter that.
You have not shown any empirical evidence of warming by CO2
It is still just a fantasy to you. Derived from silly little models that neglect the one main source of energy.
The surface data is totally useless as evidence of CO2 warming. It is too massively corrupted and tainted and unreliable to tell you anything real.
“As the whole point was to rebut the claim there is no evidence for human causation, “
We are talking about UAH atmospheric data.
And you have FAILED ABSOLUTELY.
“The question was if I could provided some evidence using only UAH data that CO2 was causing warming.”
And you have FAILED utterly and completely !
Which shows warming only at El Ninos.
No evidence of any human causation has ever been produced.
“doesn’t like being shown evidence”
You haven’t shown any evidence of atmospheric warming by humans.
A petty and failed attempt to use junk surface data.
Then back to the El Nino forced UAH atmospheric data.
Nice temperature graph, now where is the relevance of CO2 for any source in this?
CO2 is one of the independent variables in the model.
No, it is a force supposition.
“CO2 is one of the independent variables in
the modelmy curve fitting.”Fixed your typo.
For this or any other El Nino for that matter!
H2O rules over CO2 in the atmosphere and oceans, so no cause for AGW.
Still got a ways to go before getting back to the levels enjoyed during the Medieval Warm Period.
Can you post a link to the global average temperature dataset you are referring to when making that statement?
There has been masses of evidence posted, from all around the globe, that the MWP was warmer than now.
Try not to be so deliberately ignorant.
Clown.
There is no global average temperature.
I’m going to let you pick that fight with Dr. Spencer, Dr. Christy, Anthony Watts, Lord Monckton, etc. alone.
The GAT is a meaningless number that cannot describe “the” climate.
The GAT is portrayed as a temperature. It is not a temperature, it is a ΔT, a rate of change. It is moving from 14°C (~57°F) to 15.5°C (~60°F). Brrrrr! That’s an ice age.
Most scientists and the media treat the ΔT as if everywhere on the globe is going to increase by that amount. That isn’t going to happen. I think most agree that the poles will warm the most with decreasing warming as you approach the equater.
It is a meaningless number – Antarctica could be having a warm phase of say 10° while the inhabited areas are chilly, and the powers that be will be asking US (as in Not Them) to make sacrifices because it looks like the world is warming.
Even in a car engine with all its sensors but a much smaller space, no one cares about the average engine temperature. Why would you average the battery temperature with the cylinder head?
Just because it is meaningless to you doesn’t mean it is meaningless to everyone else. And like I said above if you feel strongly about it then I recommend you start the argument with Dr. Spencer, Dr. Christy, Anthony Watts, Lord Monckton, etc.
I’ll argue with them.
“As a ΔT, it should be referenced to a baseline temperature – Always.”
But there is no baseline global temperature. It’s a farce.
This is why I call them trendologists: they don’t study climate, they instead study GAT trends.
Yes, yes, very good, The Arctic circle supported forests for 300 years or more 100 km further north than today however the rest of the planet was cooler or the same as today. Very good. Carry on…….
What about the rest of the planet?
Can you tell us the global baseline temperature that the GAΔT is based on each month? Can you tell everyone what the Tmax temperature ΔT is that is contained in the GAΔT? How about the Tmin temperature contained in the GAΔT?
One needs to know these to adequately assess the change to the planet and to make a knowledgeable conclusion.
What about it?
Try not to remain ignorant.
There are masses of evidence from all around the globe.
Plenty has been posted here time and time again.
If you keep your eyes and mind closed indefinitely, you will always remain in the dark.
Irrespective of the rest of the planet, having that region warm didn’t destroy life there. On the other hand when it cooled, its fair to say life in that region will have suffered and declined.
Your tribe is the one with the zero-data hypothesis. It’s on you to refute it, otherwise it is rejected by the scientific null hypothesis.
While you’re at it, why don’t you refute the Roman Warm Period and the Holocene Climate Optimum?
Did you forget where you were when making that juvenile comment?
OK OK! The average global temperature is an unsound construct, but it can be useful for comparative purposes so we can see data trends. It is correct that regional climate values are a better general metric that arguably is best determined by satellite data, because of its consistency and numbers of measurements that are not as subjective as land surface readings and limited oceanic data.
The current temperature peak – mostly in the northern hemisphere and biased to subpolar regions, appears unusual for an El Nino spike given the Pacific surface waters have already gone down, so something else is keeping the warming going. It may be related to the excess H2O in the Stratosphere. but then why was it not warmer during 2022 after the eruption and water injection?
Time for thermal energy transfer is not quick.
The GAT is not just an unsound construct, it’s measurement uncertainty is so large as to make it impossible to determine delta-T’s in the tenth’s digit let alone the hundredths digit. The measurement uncertainty is certainly in the units digit and likely the tens digit. The uncertainties in climate science are actually only the sampling uncertainty, i.e. how precisely you can calculate the average value. They totally ignore measurement uncertainty propagation which *adds* to the sampling error.
The only problem I see with your conclusion is that these are all averages. One cannot automatically make the assumption that Tmax temperatures are increasing by this amount and then are causing excess heat related deaths. My own investigation leads me to believe Tmin increasing is the big culprit for land temps (along with UHI).
There is nothing to refute. The MWP was the period from 1150 to 1300 in central England. It was never thought to be a globally synchronous event. Refer [Lamb 1965] for details.
See [Kaufman et al. 2020] for a reconstruction of the global average temperature back to the last glacial maximum.
Those are anomalies NOT temperature. You have no idea what the baseline temperatures were at different locations therefore no way to calculate an average absolute temperature.
There is abundant evidence from proxies all over the World that the MWP was a global évent.
Then it should be easy to post a link to a global average temperature dataset showing that.
How do you propose to construct a GAT for a millenium ago? That’s assuming GAT has any physical basis (it hasn’t).
Kaufman et al. 2020 figure out how to do it.
More climate pseudoscience bullshit.
What are the uncertainties for the proxy->temperature conversions for year -10,000?
OMG .. bring out the fake poxy fabrications . Hilarious and desperate.
Based on tree ring, so totally unusable at temperature proxies when there is a CO2 deficit.
Just DUMB. !
The Vikings were in Greenland from about 1000 to 1400 so that was warm. Basing understanding on proxies over actual archaeological evidence is a fail. We already know how misleading proxies can be if they’re not sensitive to temperature. They average out to flat.
bdgwx claims
Well I’ve had a chance to read it now and Lamb says exactly the opposite of what you claim.
For example the world summary is given as
Bdgwx likes hockey
Kindly stop with this drivel about GAT. It is a nonphysical absurdity.
I don’t have the ability to end discussions of the GAT on WUWT. A good place to start may be Anthony Watts who actually does have the ability to ban articles and discussions of it.
Nice cop-out.
What we have here is TELGW (Transient, El Nino Global Warming)
It is not AGW, therefore not “climate change” under IPCC definition.
Will there be a step change as well.. we won’t know for a few years.
Remember that the 2016 and 2023 El Ninos started from basically the same anomaly.
Or an El Niño spike as I call it.
I’m not sure why you would think that the spike is climate change. Of course as you say, due to global warming temperatures in the long term are going to keep warming, which will give the impression of step changes.
Thanks for admitting that there has been NO AGW in the satellite data period.
Hence no “climate change™” (as per IPCC definition) in 45 years.
The step changes come from the warm El Nino ocean water spreading out.
There is absolutely no evidence of any human causation.
“Thanks for admitting that there has been NO AGW in the satellite data period.“
It’s so sad. The poor child actually thinks this is how you win an argument. Hopefully he’ll grow out of it and realize that just making up lies is not helping his cause – either that or he’ll go into politics.
There is no evidence which puts the mild modern warming outside natural variability. You know that and I know that. There really is no point posting charts of co2 and temps going up together. There really is no point in asking for the GAT 1000 years ago or at any other past warm period because it was not measured and there is no point trying to hold a pointy stick against what, comparatively, is tidal wave of evidence of those warm periods being global.
Well said Mike, one can argue about AGW until the cows come home, but in reality, modern global warming could 100% be natural and cyclical as it has been throughout geological and human history. What is there to be worried about?
You said “I’m not sure why you would think that the spike is climate change”
That is an admission that you know that El Ninos are NOT “climate change™” (as defined by the IPCC)
Thank you. !
You haven’t provided a single bit of evidence of human causation.
You cannot point to any evidence of AGW in the satellite data, because EVERYTHING you do relies on the El Nino transients and step changes.
That means you are ADMITTING there is no ‘A’ in the warming GW we have had from the El Ninos.
You have made zero argument… you are a low-level LOSER. !!
“That is an admission that you know that El Ninos are NOT “climate change™”
You are the only one here claiming El Niños change the climate. You’re the one claiming they have caused all the warming over the last 45 or so years.
You are one off several AGW-clownists that is totally incapable of producing any evidence that there is any CO2 or human atmospheric warming.
You have NOTHING.
You have been asked many times to show me the warming in the atmospheric data that is NOT related to El Nino events and their related step change.
You have FAILED UTTERLY to do that.
You have FAILED UTTERLY to show any human causation.
Good grief man, you’re obsessed. That’s at least 10 comments directed just at me in the last couple of hours. All variations of the theme of
“whaa whaa I no like your evidence.”
You’re simple not worth the time arguing with – it’s clearly a matter of faith for you.
Get a life mate. The big questions are who will win the Euros and Copa America. Colombia looking good for the latter. Lovely day in the Bay Area at 24C, 87F for us slow folks. Better than a few years ago when we were getting 100+ degree highs.
You’re wasted on here – go scare yer Mum’s knitting circle.
When the first or second day of the month rolls around, bellman sits at the computer hitting “reload” until the new UAH post appears so he can unload another round of shotgun plots.
“The big questions are who will win the Euros and Copa America”
You cannot conceive how uninterested I am in those questions.
“Get a life mate.”
Says someone who has to post just to say how uninterested they are in my comment.
That is indeed one of the “big” questions, one that nobody knows the answer to (today).
We will all have to just wait and see what the actual empirical data is as 2024 progresses.
.
An alternative way of looking at how “monthly records” are set in the UAH (lower troposphere) dataset is attached below.
One thing that “jumps out” to me is not just how “high” the 2023/4 El Nino “spike” is, but how wide it is compared to 1997/8 (and 2015/6).
It appears “more likely than not” that the July record, set just 11 months ago (reported by Roy Spencer in the first week of August 2023 …), will be reset higher in a month’s time.
Note that using the scientific option of “eyeballing it” I’d put the probability of breaking the August record (in 9 weeks or so) at “less than 50%” … but that’s just my unsolicited opinion …
I keep pointing out that for some reason, most probably a mix of HT effects and increased incoming solar radiation, that this El Nino…..
a… started earlier in the year
b… warmed faster for longer
c… remained high for much longer.
And we still have clowns trying to blame the slightly warmer temperatures of 2023 and now 2024 on human whatever.
Yet not one of them can point to any human causation.
Bizarre !!
Oh dear.. the poor little muppets can only manage red thumbs.
Pathetic. !
So, how does it work that the sensorsystems measuring the IR back radiation from earth are not being affected by the radiation from the sun, which I think is quite terrible lately.
Down over .2 degrees in just two months!
Clearly we are headed for an ice age!
That is a cooling rate of 120 degrees per century.
Clearly, the data proves humanity is doomed!
/Chicken Little, Michael Mann mode off
The pause now starts in October 2023.
Meanwhile, since the start of the original pause, in 1997, temperatures have been warming at the rate of 0.16°C / decade.
And the pause that started in 2014 is now warming at the rate of 0.35°C / decade. (But of course a trend over just 10 years is not very meaningful.)
Why mention it when it’s not meaningful at all ?
He’s obsessed with every little squiggle.
A trend monkey of the lowest caliber.
There’s a clue in the word “pause”.
Indeed, when the pause in rising temperatures went along with a continual increase in CO2 output.
Only to the mind of a jackass. !
It takes a strong El Nino to break each long “near zero trend”
1980-1997, 2001-2015, 2017-2023.. a that’s a lot of “near-zero-trend”
No evidence of any other warming.
“It takes a strong El Nino to
breakstart each long “near zero trend””Corrected your spelling there.
“No evidence of any other warming.”
1980-1997 Average anomaly: -0.24°C
2001-2015 Average anomaly: -0.00°C
2017-(June)2023 Average anomaly: +0.23°C
LOL… Using the step change from the El Nino event again..
Explain how that has any human causation. (apart from in your rancid imagination)
So funny that you are totally UNAWARE that you are proving me correct, yet again…
Well done 🙂
No monkey-mind.. The El Ninos happen at the end of the zero-trend.
They are what breaks the zero-warming.. The ONLY thing that does.
Oh and thanks for putting values to the step change at the El Ninos
Well done. 🙂
They are actually reasonably close to the values I have.. So again.. Well done
You have just admitted to the FACT that the step change is related to the El Ninos.
We are finally in agreement. 🙂
So you can stop your futile and puerile attempts to show human or CO2 warming using baseless conjecture and suggestions..
Use those El Ninos.. They are all you have. !!
They don’t have any human causation, though, do they.
Notice that the 2016 and 2023 El Ninos started at about the same anomaly.
7 years.. yet the same temperature
Where’s all that CO2 warming ??
Now who’s obsessed with every little squiggle.
“7 years.. yet the same temperature”
Oh dear, now you’ll have someone pointing out that anomalies are not temperatures.
At the current warming rate, 7 years would be an increase of about 0.1°C. Do you really think you could prove that there hadn’t been such an increase just by looking at a few random months?
Here’s a graph showing a 12 month moving average. I’ve marked where you might say the start of the 2 El Niños began. I’m using August 2015, and April 2023.
The 12 month average at August 2015 was 0.09°C, and at April 2023 was 0.18°C.
And you choose two point , the second on not at the start of the 2023 El Nino
How much more pathetic can you get
COOLING from 2017 to just before the 2023 El Nino, get over it.
And your graph from earlier concurs with my comment about them starting at roughly the same temperature..
Another total FAIL by the bellboy
And STILL no evidence of any human causation..
… they are EL Ninos after all,…
… and not even the bellboy is dumb enough to pretend they are caused by humans.
“not very meaningful”
Totally meaningless, actually… because it is based on the large 2023 El Nino.
But it starts with the even larger 2016 El Niño. The one Monckton uses to get his pause.
You poor mental muppet !
At least you have now admitted that El Ninos break the long near-zero-trend non-warming periods.
And STILL no evidence of human causation.
The temp in 1997 was the same as it was in 1958 (you told me that!…or was it bmx??)
That was one hell of a pause eh?
As I’ve told you before that is HadAT2 available here. It shows +0.15 C/decade of warming from 1979 to 2012. This compares to UAH which shows +0.11 C/decade of warming. And from 1958 to 1997 it shows +0.13 C/decade which does not meet the criteria for a Monckton pause.
Utterly meaningless drivel. The ”GAT” is always either cooling or warming. It is never static. But for all intents and purposes, the chart shows a flat line for half a century.
Your chart doesn’t show a flat line though. And like it or not this is the method Monckton uses to define pauses. If you have an issue with it I suggest you take that up with Monckton.
I couldn’t give a rat’s what method Monckton uses. I see no global warming over that period and neither, might I say, did Proff. Bob Carter.
He was a geologist. You are a trendologist. Or, if you like, another navel gazer.
Not sure why I would have said that.
Checking with HadCRUT, they put 1958 as 0.05°C, and 1997 as 0.39°C.
But even if it was true, that does not mean there is a pause. A trend is not based on the difference between 2 points.
The warming rate according to HadCRUT between 1958 – 1997 is 0.09 ± 0.03°C / decade.
HadCrut .. again based on junk surface data, highly tainted by massive urban development.
Cannot be used for evidence of anything.
.
God spare me. There are more than 15 points showing the same temp over that entire period.
Overall there is NO TREND. Or, alternatively there is ALWAYS a trend if you look for one.
In other words, it’s NORMAL
The new pause has begun!
The real zero-trend periods happen between El Nino events.
Long periods of no warming 1980-1997, 2001-2015, 2017-2023
Must be the steady build-up of CO2 , hey 😉
Got any evidence of human causation for these long near-zero-trend periods ??
Oh dear, you poor thing.
You can manage a red thumb..
…. but can’t manage any evidence.
Sad and very pathetic.
Wow, it’s cooling fast. That’s a .25 degree global cooling in two months. It looks as if the always globally increasing CO2’s back radiation has stopped working again.
Well, all except for the Southern Carribean Sea where the powerful CO2 back radiation has concentrated to warm the ocean dramatically to form Beryl into a Category 5, the most powerful hurricane ever seen by CNN and MSNBC.
It is the most powerful storm……… this year 😉
Don’t you mean the most powerful storm evah!…this year.
Interesting that the Greenland ice sheet just had a 3+ gigaton accumulation on July 1st. Pretty dramatic for mid summer. It’s probably due to the storms tracking farther north or at least around Greenland. Everyone screams about the ice sheet melting, but when the accumulation keeps up with the melting, its even steven and since the melt season is short, we may end up with a big overall net gain when the freeze season starts at the end of August.
As far as the UAH, it and temperature.global numbers pretty much follow each other.
Here
http://polarportal.dk/en/greenland/surface-conditions/
Careful…the SMB was +3 gigatons on July 1st. That doesn’t mean the Greenland ice sheet gain 3 gigatons. You have to consider the groundling line discharge and basal melt as well.
grounding line and basal melt from geothermal… certainly NOT from human CO2.
Arctic Sea Ice Extent 2024 (blue) crossing over 2007 yesterday, reminded me just how much I miss griff:
?? This what I have, direct from the NSIDC data.
It’s hot….and gettin’ hotter….face it….everything is affected by climate change….the Giant Sequoias are in danger….seems an insect that infests the trees is increasing in numbers along with temperature……..save the trees.
The Earth is still in a 2.5+ million year ice age named the Quaternary Glaciation. Almost everybody outside of the Tropics has to live and work in heated houses and use heated transportation most of the year.
https://en.wikipedia.org/wiki/Quaternary_glaciation
With the Aurora Borealis being visible in the lower 48, it’s obvious that Solar activity is picking up. Just sayin’…
The long expected trend downward finally begins. I wonder where it will settle. Hopefully somewhere less than 0.1 so we con pick up the pause again soon.
Another monthly record in June
12 record breaking UAH months in a row
Warmest June by +0.36C.
The top ten warmest Junes.
Year Anomaly
 1 2024 0.80
 2 1998 0.44
 3 2023 0.38
 4 2019 0.35
 5 2020 0.31
 6 2016 0.21
 7 1991 0.18
 8 2010 0.18
 9 2015 0.18
 10 2002 0.17
It’s also a record June for the USA, beating 2021 by +0.2C.
At least now you will have to admit the El Nino warming.
I admit you are an El Nino Nutter who should be sedated and locked in a mental asylum
Have a Nice Day
Why have you reposted something originally put up here 4 hours ago?
I would also do that … if I was getting paid by the post.
OTOH, if I was just an honest scientist, I would NOT do that.
I think you can now make your own conclusion.
I saw the comment at Climate Etc. and reposted it here before I realized someone else had done the same thing. By then it was too late to delete my post.
But I did not mind because a double post seemed to annoyed you so much.
It’s always fun to annoy the climate Nutters and There is no AGW losers who comment here.
An accurate comment is more important than a accidental repetition of another comment.
Why don’t you pick on the El Nino Nutters with their claptrap All Climate Change is Caused by El Ninos nonsense?
Yawn.. the zero-evidence AGW-zealot has another evidence-free tanty.
So predictable.
Do you have any evidence of warming in the UAH data … except at El Nino events ??
Do you have any empirical scientific evidence of warming by atmospheric CO2 ??
Still waiting !
“It’s always fun to annoy “
Your comments are like a very poor leftist slap-stick skit. !
No-one gets annoyed, they just feel pity for you.. (if they can be bothered)
Poor RG , best he and his AGW-comrades can manage is red thumbs.
So Sad !!
Record highs (in the limited historical record) are to be expected in a warming climate. What’s your point?
It is still so cold that everybody outside of the Tropics that everyone has to own warm clothes to use most of the year.
And most need heating in winter to survive.
What was the baseline temperature this is based on? 14°C?
meanwhile our cool and wet summer proceeds here in the upper midwest
Another chart of Upper Atmosphere Water Vapor Content, and a link too.
https://www.theduckpin.com/p/is-recent-warming-volcanic-and-not
Another fun link.
https://www.nature.com/articles/s41558-022-01568-2
Here is a stacked graph of monthly temperatures showing how much warmer trhe last twelve months have been than any time before. As Bellman mentioned, June 2024 was 0.36°C warmer than the next, 1998. And it shows a complete 12 months of such records. And if you look at the 2024 to date, in the right column, then as Bellman says it is hard to see 2024 failing to replace 2023 as the warmest in the record. By a lot.
Darn good thing you and Bellman are rooting for warmer temperatures – so fewer humans will die from temperature related deaths!
About 4.6 million deaths each year from cold-related causes compared to about 500,000 due to heat-related causes.
https://www.thelancet.com/journals/lanplh/article/PIIS2542-5196(21)00081-4/fulltext
Just in case you’re about to intimate that climate has anything to do with temperature readings, Roger Pielke Jnr explains the relationship between weather and climate –
Let’s correct one pervasive and pathological misunderstanding endemic across the media and in policy, and sometimes spotted seeping into peer-reviewed scientific research:
Neither climate nor climate change cause, fuel, or influence weather.Yes, you read that right.
Climate change is a change in the statistics of weather — It is an outcome, not a cause.
https://rogerpielkejr.substack.com/p/climate-fueled-extreme-weather
Moyhu forecast looking rather cold…
No wonder Nick wants some warming !!
Don’t think his EV would function that well, with the heater on. 😉
forgot the image
You can but you cursor at the right lower corner of your post and an option to edit your post will appear on a PC, using a phone is probably similar.
When you do an edit, it doesn’t appear to let you post or change an image.
Oh really?
Basically 90 – 95% of the last 10,000 years have been warmer than now.
The Earth is in a 2+ million-year long-term ice age until all the natural ice melts.
https://en.wikipedia.org/wiki/Quaternary_glaciation
Another glacial period may start at any time and there better be enough CO2 in the air when it gets colder and more CO2 can dissolve in the oceans and the oceans start sucking the CO2 up. At 150 ppm most plants die and in the last glacial period it dropped to around 180, only 30 ppm above extinction level. If the plants die the animals will die with them.
https://pioga.org/just-the-facts-more-co2-is-good-less-is-bad
Total BS
One or two periods in the Holocene Climate Optimum were probably warmer than 2023
No other decade was warmer than 2023 and there are no global averages of local reconstructions to support that claim
Not that BeNasty ever needs data to make a claim.
His conclusions are a fig newton of his over active imagination.
“Total BS”
Titling your comments again, RG ?
We already know most of what you type will be total BS.
Plenty of evidence that the MWP, RWP and basically all the Holocene before the LIA was warmer than now…
… it just cannot be allowed to penetrate your hard-held AGW religious beliefs/brainwashing.
Poor RG and his AGW-comrades.
Still in DENIAL of the warmer MWP, RWP and Holocene Optimum.
They are the real “climate change DENIERS”
RG says:”No other decade was warmer…”
So you admit that there were period(s) of up to nine years that were warmer than 2023 over the HCO. What caused those periods to be warmer?
“Basically 90 – 95% of the last 10,000 years have been warmer than now.”
You do talk a load of bollocks. Why do you post this nonsense? Do you like looking silly?
https://phys.org/news/2021-11-global-temperatures-years-today-unprecedented.html
https://www.reddit.com/r/charts/comments/15g8aqn/nasa_last_22000_years_of_global_temperatures/
“This reconstruction suggests that current temperatures are unprecedented in 24,000 years, and also suggests that the speed of human-caused global warming is faster than anything we’ve seen in that same time,” said Jessica Tierney, a UArizona geosciences associate professor and co-author of the study.
Oh really?
I believe that’s called navel gazing Lol.
Oh no. Nick’s petty finger paintings again… hilarious !!
Yes NIck.. there has been a strong and persistent El Nino event.
No evidence of human causation, though.
two red thumbs..
….but still no evidence of human causation.. Why is that ??
Albedo drop, according to CERES, is lower than “before” too. Thus increase in surface temperatures other than mythical CO2 driver.
Note the recent drop aligns with the 0.8 anomolie jump since sept 23..
Loeb says the decrease in albedo is caused by anthropogenic factors like CO2.
And of course you believe him…
Without evidence, of course. !!
Based on what? Models? Conjecture? Same thing, honestly.
Evidence. But the reason behind the declining wasn’t really the spirit of my comment.
Why don’t you show the baseline temperature as the start of the y-axis? Is it 14°C (57°F)? That would make the actual temperature divisions 14.2, 14.4, etc.
It would make the graph much more meaningful!
14°C? This is lower troposphere. It’s in the name. Altitudes like 4000 m.
I’m using exactly the same numbers that Roy displays in his monthly plots, echoed in this WUWT post and a fixture on the front page of WUWT. All I do is convert the dots into columns, color them by year, and bin them into months, showing the tallest at the back, shortest at the front.
UAH shows only anomalies. One reason is that they are not showing the temperature of a particular location in space. They have a satellite which observes an incoming beam of microwaves and puts it a filter which is meant to give a result representative of a wide altitude range. You can only do that courtesy of the imperfect homogeneity of anomalies. There isn’t an underlying base temperature. Where would it be the temperature of?
You’ve just explained that the UAH is a sophisticated proxy, not a real temperature measurement.
Good job, I agree.
Yes, I agree too. But many at WUWT prefer it to the real thing (but not RSS!!!!)
“puts it a filter which is meant to give a result representative of a wide altitude range.”
This is no different than using mid-range daily temps. It leaves you totally unable to actually specify what is happening and where. It’s why, when it comes to the GAT, you can’t tell the climate in Las Vegas from the climate in Miami because they can both have the same mid-range daily value.
It’s also why UAH (and RSS) have such a high measurement uncertainty – which somehow never gets mentioned. When using data covering a wide area water vapor, and especially clouds, can have a big impact on the actual measurement – leading to a wide measurement uncertainty interval.
The actual fact is that NONE of the temperature data sets are accurate enough to actually calculate temperature anomalies beyond the units digit. The answer we should be getting from climate science is: “We don’t actually know what is going on!”
At its peak the Monckton pause lasted 107 months starting in 2014/06. Since 2014/06 the warming trend is now +0.35 C/decade.
Somebody correct me if I’m wrong, but I think this was the last update Monckton provided.
Took a very solid El Nino event to break that “zero-trend” period.
Not AGW. !
—
“Since 2014/06 “
roflmao.. so including both major El Nino events. The only warming you will find.
Not AGW. !
A question that is often asked is…are pauses inconsistent with CO2 being a cause of warming? The answer is no. Models that include CO2 can explain both the pauses and the long term warming trend.
Again with your meaningless ASS-umption driven model nonsense.
What a JOKE. !!
Exercise in curve fitting, nothing more.
bdgwx doesn’t seem to realize that the correlation can also support the assumption that temperature drives CO2. Correlation simply can’t be used to determine causal relationships.
Lol.
It really was a completely farcical comment, wasn’t it. !
The model I presented above is not inconsistent with the pauses or the long term warming trend.
It’s a linear model, trying to explain changes for a NON-LINEAR system.
Which is irrelevant. The model is but one example showing that UAH TLT pauses and long term upward trend can be explained using CO2 which is sufficient to falsify the hypothesis that it cannot be done.
It is your model that is irrelevant.. It is based on anti-science conjectures and suppositions.
The model you presented is based on baseless supposition.
It is *YOUR* assumption that CO2 is driving temperature. But the correlation in the graph can also be caused by increasing temperature driving increasing CO2.
This is why correlation can’t be used to support *any* specific causal relationship In fact, there could even be a confounding variable that is at play. Variable A causes Variable B and Variable B causes Variable C. That does *NOT* mean that Variable A causes Variable C even if they are correlated.
Models do not define causal relationships, especially if the models are primarily data matching algorithms. The causal relationships have to be defined first, then the models can implement the causal relationships. I have yet to see any testable hypothesis that can show a causal relationship where CO2 causes temperature increases.
In fact, the existence of pauses should be considered proof that there are probably multiple confounding variables involved.
“If you would debate me, first define your terms.” — Voltaire
Mis-information : Presenting data that someone genuinely believes is true, but which is is fact false.
Dis-information : Flat-out lying.
Mal-information : Mixing true and false statements in a way meant to deceive (and/or confuse) people.
.
The increase in CO2 levels can explain the “long term warming trend” in the UAH dataset.
It cannot explain “the pauses” … AKA the short-term “natural variability” … in the UAH dataset.
Other factors, some of which are still “unknown unknowns” (Rumsfeld, 1983) even today, must be taken into account in order to fully “explain” the latter.
This is a model that includes CO2. It explains both the pauses and long term warning.
Curve fitting is not a “model”.
They ridicule Pat Frank for showing the “model” outputs can be duplicated by a simple linear equation and then turn around and do the same exact thing – curve fitting.
Yep, more irony.
I don’t recall Dr. Spencer ever claiming that CO2 warms the oceans. That means if you want to examine CO2 effects, it must only include land ΔT’s. Then you must examine UHI effects for its attribution AND what ENSO and other ocean currents do to land ΔT’s. Not a simple task and curve fitting won’t cut the mustard.
That isn’t “a model”, it is “the result of a curve-fitting exercise”.
Your “model” contains, by my count (highlighted above), seven “independent / arbitrary parameters” — i.e. multiplication coefficients, offsets and temporal delays — whose values were determined by an unknown (but probably mathematically correct) multi-factorial regression technique.
“With four parameters I can fit an elephant, and with five I can make him wiggle his trunk” — Attributed to John von Neumann by Enrico Fermi
You needed seven … OK, six if you ignore the “-0.08” constant offset seeing as we’re talking about anomalies anyway … and are almost certainly missing several real-world factors which could, under certain specific conditions, have non-negligible contributions to either “the wiggles” and/or “the pauses” in the UAH dataset.
It’s literally a model in every sense in which the term is used in science.
And just because it uses free parameters that must be determined experimentally does not mean it isn’t a model. Afterall, many scientific models, like Newton’s universal law of gravitation, the standard model, etc. have free parameters that must be determined experimentally as well. And no one challenges their ability to explain/predict reality.
I’ll remind you that the standard model has 20 free parameters so 5 or 7 is hardly noteworthy.
Anyway, the model is not trained from arbitrarily chosen parameters. It is trained on parameters known to have a physical causative mechanism that effects atmospheric temperature.
Note what factors the model did not use for training. It didn’t use world GDP, population, etc. which also correlate to global UAH TLT temperatures. But there is no physical causative mechanism with those so there is no logical justification for including those factors.
As I’ve said numerous times the model is definitely missing several real-world factors that influence global UAH TLT temperatures. This is partly the reason why the model only yields an R^2 = 0.76. But those 5 factors alone are enough to explain both the pauses and long term warming trend and provide a limited lead time prediction.
If you check the context of von Neumann’s remark it is that if you choose 5 parameters, however valid the “physical causative” reasoning behind those choices, you can “hind-cast” fit almost any curve.
See also : String theory.
Sorry, but you’re going to have to provide a worked example here.
Let’s “limit” our “lead time” to August and September 2024.
What are the values of “ERFvolcanic”, “ERFaerosol” and “anom(TSI)” that you are going to plug into your “model” in order to generate a “prediction” for the next 2 or 3 (or 6, or …) months ?
If you use a “slow changing, assume no change in the near future” approach for those (+ “average annual cycle” numbers for “CO2” ???), the “ONIlag5” parameter will limit your “prediction” time to 5 months (or less, depending on how long it takes NOAA to report “final” ONI numbers).
Newton’s universal law of gravitation can be used, e.g. by NASA, for slightly longer “prediction” times than that … which is one reason why it is a “useful” model …
.
Re-reading my post it does come across as a bit too harsh.
Not a good excuse, but it probably came from the frustration that led me to include the “… (and/or confuse) …” parentheses in my OP.
I use the Climate Indicators project for volcanic and anthropogenic ERF. For predictions I use the persistence technique.
I use TSIS-1 dataset for TSI. For predictions I use the persistence technique. In the future I may use one the dynamic models provided NASA or other institution.
I use the NINO 3.4 index for ENSO. For predictions I use a blend of statistical and dynamic techniques provided by IRI.
I use the Mauna Loa timeseries for CO2. For predictions I use the persistence technique. In the future I may use the trajectory technique.
The model is trained using multiple regression. All coefficients including the constant offset and ENSO lag are free parameters that are determined experimentally via the training.
The model has limited lead time ability because the skill wanes rapidly for each additional month primarily as a result of the ENSO component prediction.
Note #1… the 1.8 free parameter coefficient for CO2 may naively be viewed as the 2xCO2 warming sensitivity. However, care should be taken when doing so because 1) this term is acting more like a proxy for all GHGs and 2) would most closely resemble the transient (and not equilibrium) sensitivity anyway.
Note #2…the training actually incorporates other factors including AMO, PDO, and many other cyclic values that are known to perturb the ingress and egress of energy to and from the atmosphere. However, the training sets their coefficients to zero meaning they provide no useful skill and so I exclude those from the model equation.
Note #3…the model itself does NOT proof that CO2 is the cause of the long term warming. That is not the intent. What it does is falsify the hypothesis that increasing CO2 is not consistent with the UAH TLT pauses. Or said another way it falsifies the hypothesis that UAH TLT pauses are sufficient to eliminate CO2 as an influencing factor. The intent is demonstrate the plausibility (but not necessarily the certainty) that CO2 has an influencing factor even with the extended pauses in UAH TLT temperatures.
———————-
“It is trained on parameters known to have a physical causative mechanism that effects atmospheric temperature.
Note what factors the model did not use for training. It didn’t use world GDP, population, etc. which also correlate to global UAH TLT temperatures. But there is no physical causative mechanism with those so there is no logical justification for including those factors.”
Of course GDP and population are causative mechanisms for HUMAN generated CO2. If you don’t include them in your model then, as stated, you are doing nothing causative related to CAGW, you are just doing data matching to some points you have cherry picked.
“This is partly the reason why the model only yields an R^2 = 0.76. But those 5 factors alone are enough to explain both the pauses and long term warming trend and provide a limited lead time prediction.”
You are falling back on the “correlation proves causation” meme so common in climate science. R^2 is meaningless in determining causation.
Oh, and don’t for a minute think the irony of you twisting my words to make it sound like I said CO2 and only CO2 explains both the pauses and long term warming trend while simultaneously insinuating that I’m guilty of dis-information, mis-information, and/or mal-information went unnoticed. I’ve always appreciated your posts and thought you’ve presented useful and relevant content to the discussion so I hope you understand why I’m a little disappointed here. Look…I don’t take it as a personal attack or an indication of a change in your posting style. I still think you’ll continue to post useful and relevant content in future so it’s not like my respect for your posts has significantly changed.
Stop whining — its curve fitting, not a model.
https://youtu.be/W7GN96BUCEo?si=rATvCdO-uBHWB6Wd
Tonga volcano caused record warming.
So what?
Here, as usual, is the Australian graph showing the “pause” Viscount Monckton style.
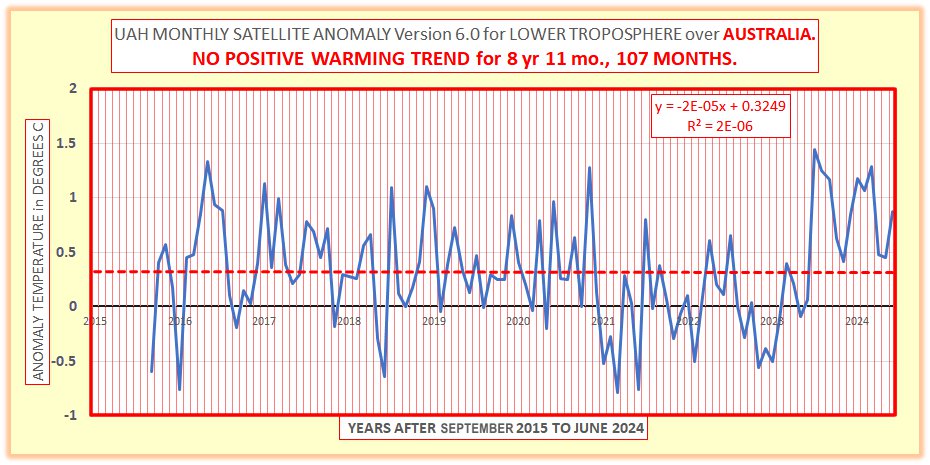
The current peak, speculatively, seems to have a component fron the Hunga Tonga eruption of 20 December 2021, emphasis on speculation.
Geoff SD
And you can clearly see the steady DOWNWARD trend from the 2016 El Nino up until the 2023 El Nino kicked in.
Must be CO2 😉
Can you show a graph illustrating the 2016 – 2023 downslope in temp overlaid with the linear increase in atmospheric CO2 over the same period?
Ta.
I don’t have the CO2 data, because it is unimportant to climate and weather. 😉
OK, I guess I can just draw a square and fill it with an ‘X’ to get a fairly accurate representation.
Good enough for government or climate work. 🙂
You can add your numbers at the end of the green CO2 line.
Cooling causes CO2 rise!
Or – CO2 rise causes cooling!
I should ask Al Gore.
He’s a wiz at presenting graphs.
Here’s what it looks like globally. Of course, you have to use those El Niños.
Yep, El Ninos is ALL you have. !
You have used the transient and step of the 1998, 2016 El Ninos and the Transient of the 2023 El Nino
You do it EVERY TIME, because you know that is the only warming.
Absolutely no evidence of any human causation.
Even by your standards that’s a vacuous argument. How do you think I’ve used any of those El Niños? The liner trend is showing your argument that there was a cooling trend since 2016. The CO2 is fitted across all the data.
You can keep hitting that bold button all you like, you have still offered zero explanation as to how the observed warming overt the last 45 years could be caused by El Niños.
Every post you make is a vacuous argument.
ZERO evidence of human warming.. just yapping like a chihuahua
Bereft of any actual evidence that is all you can do.
Use those El Ninos.. they are the ONLY warming you have.
As the late great Proff Bob Carter said in his lecture, ”after the thermal shock of an El Nino the new temperature often settles slightly higher than it was previously”
That does not mean it’s permanent, and 45 years is the blink of an eye with regards to temperature exchange of something the size of a planet. Not enough time for any measurable change to the ocean temperature by co2 back radiation I would suggest.
That’s an observation, not an explanation. It’s exactly what you would expect if there was an underlying warming trend.
“ still offered zero explanation as to how the observed warming overt the last 45 years could be caused by El Niños.”
Even a blind monkey can see the El Nino transients and step changes. !!
Warm water spreads around the globe and lingers.
Stored solar and wind energy from the oceans…
… certainly NOT from mythical CO2 warming.
Bob Tisdale shows this very well.
Here, once again, are the NOAA ENSO-3.4 Index anomalies versus UAH_TLT, with trendlines.
ENSO Index shows virtually no trend over their joint period of measurement (Jan 1982 – May 2024); whereas UAH shows statistically significant warming.
It follows that ENSO variations do not explain the observed warming trend in UAH over that period.
ROFLMAO !
fungal STILL hasn’t realised that the ENSO region is just a small “indicator” area.
It is a small area in the middle of the El Nino event region.
It is not representative of how much energy is released or how far it spreads.
This has been explained to fungal many times.. but its comprehension level is basically zero.
As Rick has shown many times, the ENSO region is constrained to a stable value by weather feedbacks. (comparison to model ENSO is a real hoot !!)
fungal really has to go and learn some basic facts so it doesn’t keep making an abject fool of itself.
ENSO is the term for the oscillation, not the region.
The region is divided into separate Ninos (1,2,3 4 and 3.4)
Nino 3.4 covers the central Pacific, enclosing large areas of Ninos 3 and 4.
El Nino and La Nina events are determined by the index value in Nino 3.4.
To quote NOAA:
Do not get your information from bnasty; he hasn’t a clue.
And the little monkey thinks this is the only region where El Nino energy comes from… DUMB.
He even puts a description that shows exactly what I said.. that it is the area used to indicate when there is likely to be an EL Nino event
Hilarious.
What exactly does this have to do with the issue of El Nino being a variable length, recurring phenomena, that is not indicative of long term global temperature change?
Here’s the full graph for Australia
The trend up to the start of the pause was 0.15 ± 0.05°C / decade.
The trend for the entire data set including the pause is 0.19 ± 0.03°C / decade.
A distinct change at the 1998 El Nino
And of course, both 2017 and 1998 were warmer than 2023.
Do you include the latest El Nino anomaly in that trend?
“Do you include the latest El Nino anomaly in that trend?”
As I said – up to the start of the pause, i.e. up to August 2015. So not including the 2023/24 El Niño.
Bellman,
And the trend from September 2015 to the present is ZERO degrees C per decade, (extrapolated a little). How does the magical CO2 create this patchy pattern? We all thought it would be a well-mixed gas, did we not, exerting its effect smoothly, unformly in time and space and predictably. But none of these has happened. Might the theory need more development to get it right?
Geoff S
1… It is NOT a theory.. barely even a conjecture, based on 1D erroneous physics.
2… No-one can present any measured atmospheric evidence that it even exists.
3… CO2 increase and temperature regularly go in opposite directions.
4… There is no sign of any atmospheric warming by CO2 in the whole of the 45 or so years of the satellite era.
“How does the magical CO2 create this patchy pattern?”
The same way anything causing a continuous warming (or cooling) trend does, through natural variability.
You have say a linear trend of 0.15°C / decade. that means on average one year will be 0.015°C warmer than the previous one, but the actual temperature will be say 0.015 ± 0.500°C warmer, meaning there’s a good chance it will actually be cooler. Almost inevitably you will be above to find long periods where the trend is flat or even sharply negative, purely by chance.
Bellman,
Nice conjecture, but can you please give an exsmple of a real world system acting ths way?
I have never sought one, purely academic question.
Geoff S
The global average temperature of the atmosphere acts this way.
Yep, It goes up in steps at each major El Nino.
Where is the CO2 warming ?
Where is the human causation?
You still haven’t shown any.
So you claim, without a shred of evidence.
Pure speculation..
And still absolutely nothing that remotely resembles scientific evidence.
“ find long periods where the trend is flat “
Yep, and they just happen to be between each of the strong El Nino events.
Gees.. what a coincidence… not. !
What a mindless little joke you are.
Here is what bellboy’s pathetic little dot graphs hide.
Australia has spikes, then COOLING trends.
No evidence of how CO2 could possibly cause that.
note. Lines are graphically drawn for illustration purposes
Here’s that same data again (i.e. UAH_TLT Australia, starting 1998, as chosen by bnasty), this time with the linear trend running through the entire thing. (Trend calculated by MS Excel, not scribbled in by hand per the above effort).
This is so variable that extrapolating what will occur is a joke. Tell you what, use your linear trend to tell us what December 2024 will be. I’ll put it on my calendar so I can remind you!
Ahh.. the blind monkey with a ruler. Hilarious.
In fact, that’s exactly what would be expected a long-term warming influence, such as increased greenhouse gas concentrations. Weather-driven peaks and troughs superimposed by a long-term background warming trend.
Wait, How does weather cause heating peaks and troughs? Is “weather” an energy source? Does “weather” have back radiation?
Yes. Weather phenomenon perturb the ingress and egress of energy in and out of the UAH TLT layer. Yes. These weather phenomenon can influence back radiation. That’s not to say they only do that. Far from it. There are many ways weather phenomenon influence the flow of energy in and out of the atmosphere.
Again.. just close your eyes and dump a straight line on everything.
No attempt to see what is actually happening.
Just DUMB trendology.
Then invent a baseless supposition , with zero evidence
You have never been anywhere near any real science, have you fungal !!
Now, where is the evidence of CO2 warming or any human causation
Baseless fantasy supposition is NOT evidence.
If you are so confident in your knowledge of what is happening, tell us what December 2024 will be!
“such as increased greenhouse gas concentrations.”
H2O fluctuates all over the place… is it increasing?
It is the only gas that has any measurable “greenhouse effect”.
You could prove me wrong by producing a measured GHE from CO2..
.. but that is something you know you are incapable of doing.
Funny how you like to call me a monkey with a ruler, yet here you are drawing random lines over a graph of highly variable data as if they mean something.
Being blind to what is actually happening to the data .. that is YOUR thing, bellboy.
Do you really DENY that all those cooling section exist.. WOW !!!
Are you really that mentally blind ??
Everyone with two working eyes connected to their brain, can see them.
This is one of the goofier things you’ve posted, bnice.
AlanJ is totally blind too.
Poor muppet !
Hmmm. I wonder if bdgwx’s co2/temp model can explain the nine year Australian pause??
Should we ask him? Lol.
Mike,
Just did. Cheers Geoff S
No. It is trained on global parameters only. As such it won’t explain/predict any local temperature behavior.
” It is
trained on global parametersonly curve fitting.”Fixed your typo.
And it should be pointed out that curve fitting cannot predict anything.
Congratulations, you just verified that you don’t believe everywhere is warming at the global ΔT you calculate or you would be willing to make a prediction.
Yet you and other warmists think everyone on the globe should bankrupt themselves because “climate change” is global based on your calculations and that it is an existential danger.
You might want to reevaluate your concept of what is happening and where.
Here’s a map showing the trends across the globe for this pause period. (Missing June).
It shows how much variation there is across the globe when looking at trends over a short period.
Even Australia has a mixed “pause”. Parts have been cooling, other parts warming over this period.
USA has been cooling, including Alaska which has been one of the quickest cooling areas. Whereas Canada has been warming, along with most other land areas.
Also interesting to note that the tropical pacific areas have been cooling – which suggests the recent El Niño was not as strong as the one in 2016.
And yet your own graph from earlier showed that it started earlier, warmed faster, and lasted a lot longer.
It is almost as if you are desperate to discount a large extended El Nino event to push some mindless little brain-washed fantasy.
We expect DENIAL, but really !!
You can see the massive buildup in this series of charts.
“Also interesting to note that the tropical pacific areas have been cooling – which suggests the recent El Niño was not as strong as the one in 2016.”
Thinking about it some more, that isn’t necessarily correct. More likely it reflects the La Niñas towards the end of the period.
Again the perils of assigning meaning to short term trends.
Here’s the trend in UAH data over the ONI region.
There’s a slight cooling trend caused by three years of La Niña conditions, despite the big rise at the end.
Also interesting how much warmer UAH makes the current rise compared to 2015/16. Whilst sea surface records would appear to be suggesting 2016 was bigger.
In May 2022 in my LASP Sun-Climate Symposium poster I predicted that the 1.5C ‘limit’ would likely be exceeded by the sun’s ocean warming effect in solar cycle #25.
Today by inspection the HadSST4 leads the UAH LT. The recent UAH LT climate response has followed the solar cycle #25 influence on the ocean as expected after TSI ≥ warming threshold:
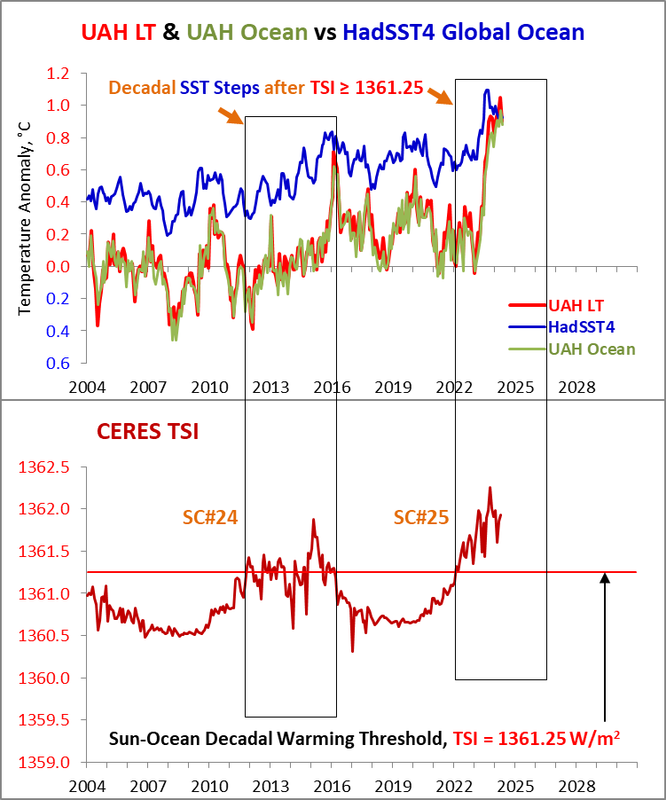
This confirms that the UAH LT lags the global ocean, as was originally established in 2019:
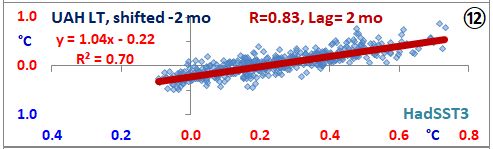
Temperatures that rose with the solar cycle #25 ascension in 2022/23 are now in 2024 following the slight TSI decline from the SC#25 peak.
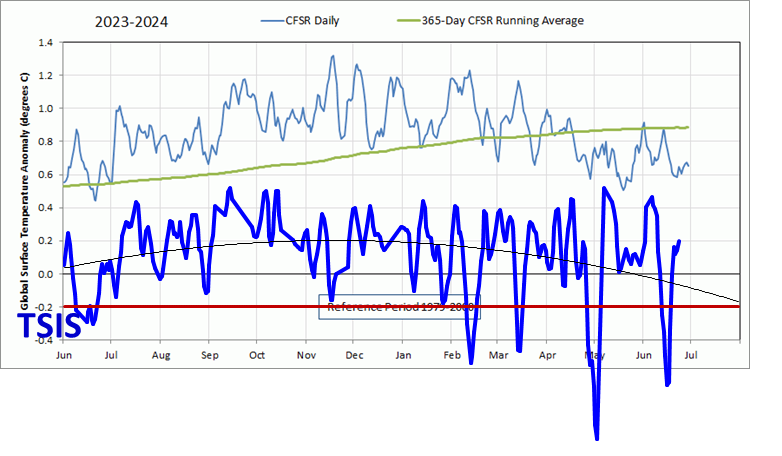
Until May, 2024 CERES TSI was leading 2023 TSI, but larger sunspot areas in past months have driven several TSI downspikes via the sunspot darkening effect, and a lower monthly TSI average.
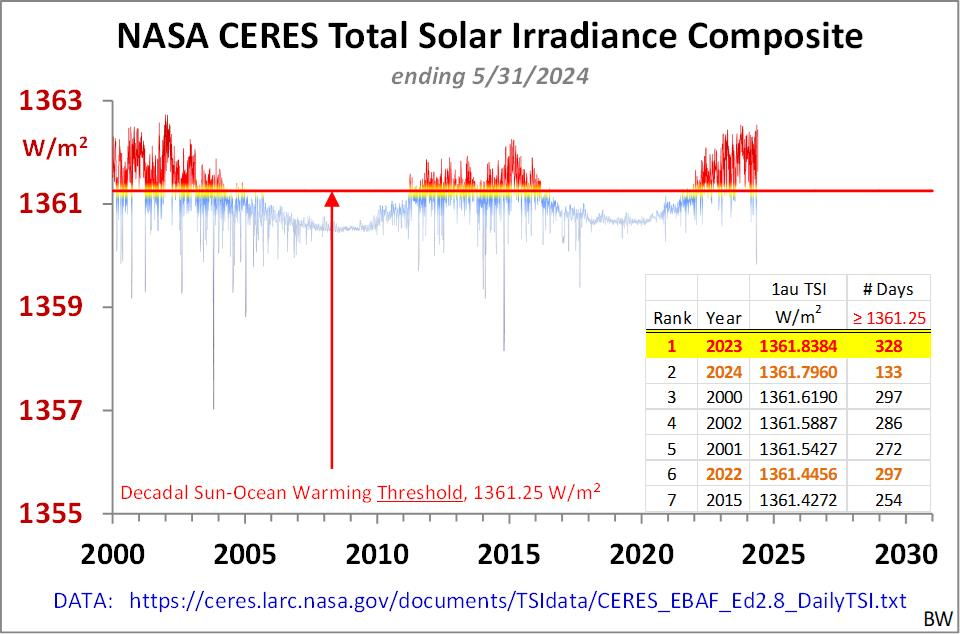
As TSI could float above the decadal ocean warming threshold for a few more years, there could be another solar-driven El Nino spike by ~2027.
Our mountains here could see some winter in July this week. Along the I-25 Corridor it should be pleasant.
https://denvergazette.com/outtherecolorado/news/mountain-snow-possible-during-first-week-of-july-in-colorado/article_b0757e8a-37c6-11ef-9fa8-53eb44d61c1b.html
So it’s been about 0.8 since sept 23. Pretty flat and just a step change like many times really.
Still hanging on to the non-existent “global temperature”. Stop the nonsense already.
It is all trendology has.
It’s not possible to measure the planet wide temperature down to one degree, let alone a tenth of a degree. It’s all a fantasy.
Greenland ice at a record high for the time of year, now that can be measured.
That’s probably why no one does that.
Liar, of course they do. Using Fake Data.
Mr. Nail: You may need to call your letter-salad-for-name friend, because he says somebody is doing it.
Are you joking? Anomalies at every station is calculated to the milli-kelvin and then averaged. That requires temperatures to be known to the milli-kelvin.
Find and show us a METROLOGY resource that allows INCREASING the precision of a measurement by averaging. Believe me you won’t find one in any physical science discipline. Only in statistics withh 100% accurate numbers will you find this is allowed.
Tell us how you will convince a physics professor that you can calculate the force of gravity to six decimal places using a steel ball dropped 5 feet and a stopwatch with 1/10 tenth of a second markings. Tell him all you have to do is perform the experiment enough times.
[Christy et al. 2003] say the uncertainty on UAH TLT monthly anomalies is ±0.20 C.
Can you post a link to a dataset showing Greenland ice at a record high?
And Christy et al are full of it, they don’t understand uncertainty any more than you (don’t).
Instead of UAH mention another published GAT source and their uncertainty.
If you are quoting an uncertainty of 0.20°C, that not exactly confidence inspiring. 0.8 ±0.2°C is a large range. (0.2/0.8 = 25% relative error). That is a monthly interval of [0.6, 1.0].
Even on a decadal of 0.13 ±0.2°C is a large range. That is somewhere in a decadal interval of [-0.1, 0.3]°C. And a century interval of [-1, 3].
And, I expect that 0.2 is NOT an expanded uncertainty to 95% which is recommended internationally.
That gives “±0.2 • 1.96 = ±0.4”. This a monthly interval of [0.4, 1.2]. A decadal interval of [-0.3, 0.5]. And, a century interval of [-3, 5].
Those are large intervals to make nations spend trillions on a certain “increase” in temperature.
“And, I expect that 0.2 is NOT an expanded uncertainty to 95% which is recommended internationally.”
The expanded uncertainty to 95% what they quote in their papers.
The expanded uncertainty of what?
If they can only measure temperature with a +/- 0.3C accuracy (typical Type B measurement uncertainty for the better temp measuring stations) then how do they get an expanded +/- 0.2C measurement uncertainty?
Answer? They don’t include actual measurement uncertainty in their methodology. They use the common climate science meme that “all measurement uncertainty is random, Gaussian, and cancels”. They can then justify using the sampling error as their “measurement uncertainty”.
They measure microwave emissions of O2 to determine the atmospheric temperature, that is what they say they quote the expanded uncertainty of.
No they do no such thing at all.
Really, this is what they say they do: “The MSU and AMSU instruments measure the thermal microwave emission from atmospheric oxygen in the 50-60 GHz oxygen absorption complex, and the resulting calibrated brightness temperatures (Tb) are nearly equivalent to thermometric temperature”
they are not doing a direct measurement. The intervening media (e.g. water vapor) will affect the radiation received by the instruments Thus the conversion from “brightness” to temperature will have significant measurement uncertainty.
It doesn’t matter what they think they are measuring. If water vapor and clouds have an impact on the irradiance they see then they are not measuring the same measurand each time they take a measurement. It’s like trying to measure the length of a spring during its decay period after being stretched. You are never quite measuring the same thing. So what is the correct, accurate measurement?
That’s fine if you want to ignore it. But the ±0.2 uncertainty still gives:
a monthly interval of [0.6, 1.0],
a decadal interval of [-0.1, 0.3]°C,
and a century interval of [-1, 3].
Why does no one ever discuss the fact that the uncertainty allows for cooling within the uncertainty intervals. Not being able to even predict the sign of what is going to occur needs to be shown.
In July 2012, there were 1,418 sq km of ice.
In July 2024, there is 332,000 sq km ice.
National Snow and Ice data center.
Greenland is only 15% covered in ice today?
Greenland was only 0.06% covered in ice in 2012?
Are you sure you’re understanding the data you are looking at?
consonant-man here won’t be happy until the entire globe is frozen over.
According to National Snow and Ice data center there are about 1.7 million sq km of ice on Greenland (about 80% of the total area).