Gabriel Oxenstierna
For the first time, the IPCC’s doctrine of CO2 as a ‘control knob’ in our climate faces a serious challenger in the form of a comprehensive hypothesis about what drives climate and its shifts.[1][2] This article is the third in a series evaluating this new hypothesis of natural climate variability.
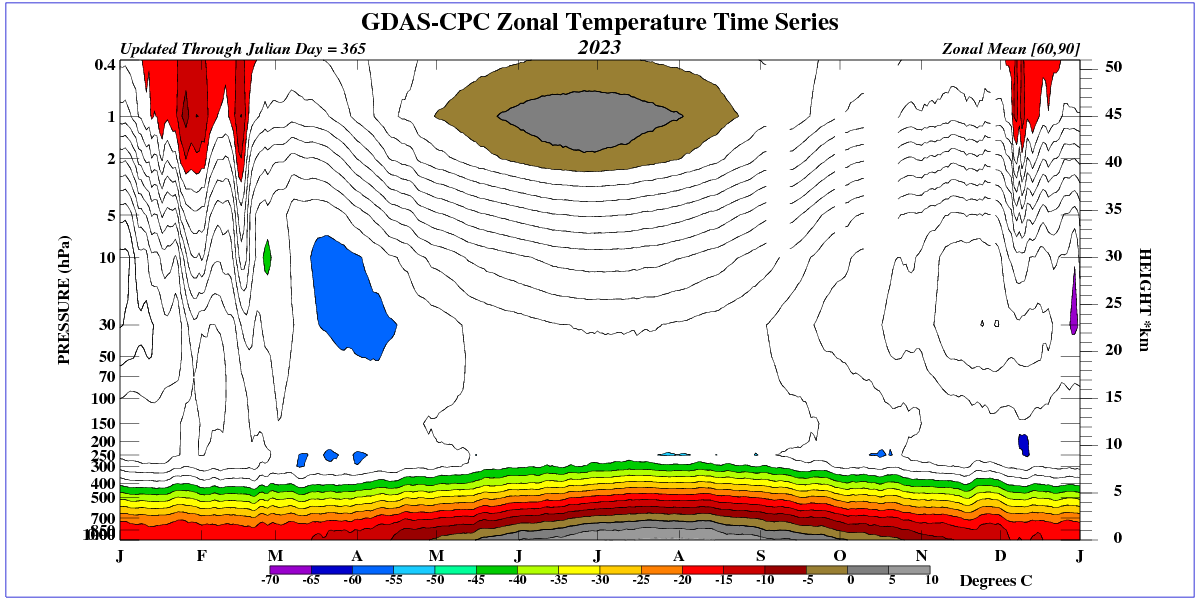
The Arctic [70-90°N] is a real focal point for the climate, as well as for the two competing climate hypotheses. It has warmed 3-4 times faster than the globe since 1979, and is by far the region with the highest rate of warming.[3] This phenomenon started in the late 1990s and is mainly seen during winter:

Figure 1. The AA is mainly a winter phenomenon (blue curve) in the highest latitudes, 80 – 90°N. Temperature anomalies compared to a 30-year comparison period. The ‘1997’ shift period is marked with a yellow bar. Image source: DMI
For the “Winter Gate-keeper hypothesis” [WGH], the Arctic is particularly important: The weak and sensitive polar vortex there allows for large variations in poleward heat transport that it claims regulates the climate, much like a control knob.[1, p.542] Energy is transported to the Arctic in order to get radiated from there, where radiation is as most efficient – not least due to a low green-house effect [GHE].
When heat is moved to a location where it can be more easily radiated to space, the outgoing radiation increases, leading to a reduction in the energy content of the system. Changes in transport of heat and humidity up to the Arctic explain both the strong warming trend in the Arctic and its effects on global warming, according to WGH. This is especially the case during the dark polar winter, which is why we see the pattern in figure 1. Cf. the first post in this series, here.
The Green-house Gas Forcer hypothesis says that Arctic warming primarily is caused by the increased amount of anthropogenic GHGs in the atmosphere (CO2 etc.).[5] These increase the GHE, which is assumed to cause the large temperature increase in the Arctic. The GHE-driven warming in the Arctic has even been given its own name: “Arctic Amplification” [AA]. This is IPCC’s take on the relationships:

Figure 2. The IPCC links the Arctic amplification in panel (e), to anthropogenic emissions of CO2 in panel (f), and provides a projection of the trend towards an ice-free Arctic by 2100 under two of the emission scenarios in panel (g). Source: AR6 WG1 Figure 9.14.[4]
They attribute between 50 and 70 percentof AA to human emissions of GHGs in the atmosphere (CO2 etc.), based on model runsshowing a pattern as in figure 2. IPCC writes: “…Arctic amplification, is a ubiquitous feature of the response to GHG forcing simulated by climate models.”[4] In their models, AA is attributed to a combination of radiative forcing patterns from GHGs and various feedback mechanisms.[5]
Both climate hypotheses thus emphasize the role of the GHE in global and Arctic warming, but in quite opposite ways:
The WGH says that AA is a natural variation, and that the low GHE in the Arctic is essential for its function as the prime location for regulating global warming/cooling.
The IPCC says that AA mainly is due to anthropogenic emissions of GHGs, and that the main factor that causes AA is the GHE itself via radiative forcing.
To see which hypothesis is a better representation of reality, we need to examine the GHE in some detail.
The green-house effect
The GHE is the warming of the Earth’s surface due to the Earth having an atmosphere. The effect is directly linked to the amount of GHGs in the atmosphere, first and foremost water vapour. The GHE is caused by some of the heat radiating from the Earth’s surface warming the air in the atmosphere instead of radiating into outer space. This makes the Earth on average about 33 degrees warmer than it would be if it had no atmosphere at all.
The remaining net radiation has been absorbed by the atmosphere in various ways. The thermal radiation that doesn’t disappear into space must, by definition, remain and radiate towards the Earth.
And this is what the greenhouse effect looks like, measured by satellite and calculated as absorbed radiation as a percentage of surface radiation and animated month by month: (see Appendix 1 regarding how the GHE is calculated)
Figure 3. Animation of the monthly GHE measured as a percentage of longwave (LW) radiation back to Earth. The effect is measured in each individual gridcell 1° × 1° in the unit W/m², expressed as a ratio. All measurements are made at the ToA. Grey fields in East Antarctica have negative values (as low as -6%, which isn’t on the scale). Data from Ceres Ebaf 4, averaged over the entire period March 2000 – September 2023.
The GHE is not homogeneous over the planet mainly due to the unequal distribution of water vapour. It is stronger in the wet tropics and weaker over deserts. The GHE varies between -6% in parts of Antarctica up to 56% in parts of the tropics. The global average is 39.7%.
In the animation we also see that the GHE varies strongly over the seasons, especially in the polar regions. Let’s compare the months of June and December:

Figure 4. The GHE during the months of June measured as a percentage of LW radiating back to Earth. The global average is 39.7%. For the Arctic the figure is 29.5% and for Antarctica 4.8%. Grey fields in East Antarctica have negative values. Horizontal line indicates 70°N. Data from Ceres.
The GHE is at its weakest in the very dry polar regions, which means that heat radiation can reach space most easily there. This is particularly pronounced in winter.
Above the coldest polar regions, the greenhouse gas molecules in the atmosphere are relatively warmer than the surface of the cold Earth. This means that more heat is radiated to space than would be the case if there were no greenhouse gases there.[6, p. 17] The GHE is then negative. This happens when temperature inversions make the surface colder than the atmosphere.
In much of East Antarctica we see this happen. In these areas, the upward thermal radiation is greater than the downward radiation. The extremely dry atmosphere thus makes the outgoing thermal radiation greater than it would be without greenhouse gases.[7] The negative GHE is most noticeable during the polar winter, but is also present on an annual basis (grey fields in the animation, figure 3).
When it is winter in the northern hemisphere, we get the following picture:

Figure 5. The GHE for the month of December measured as a percentage of LW radiating back to Earth. Horizontal line indicates 70°N. Data from Ceres.
During the Arctic winter the GHE becomes very weak. Greenland and northern Siberia, for example, have a GHE that is close to zero in winter, and thus have a particularly strong cooling effect – all the heat radiates out, none is captured by the atmosphere. This is because the atmosphere is both colder and drier. It is during the polar winter that energy is emitted to space most efficiently.
The greenhouse effect is strong in the tropics and weak at the poles in winter. As a result, increased heat transport to the poles makes the planet cooler because they act as cooling radiators.
The Arctic is the most important cooling region of the climate system. This is given by the massive energy import to, and radiation from, the Arctic, combined with its weak GHE. This is especially significant during winter, when the radiative cooling is even more effective than in summer.
Let’s summarize what we know about the GHE as evidenced from the satellite data shown in Figures 3-5:
1. Humidity dependent: the GHE is strong where the air is humid, and weak where the air is dry.
2. Geographically dependent: the GHE is weak over the polar regions, and over deserts. The main reason for this is low humidity. The polar regions are sometimes referred to as ‘ice deserts’.
3. Temperature and seasonal dependence: the GHE varies strongly with the seasons in the polar regions and is weakest in the polar winter. Parts of the Arctic have close to zero GHE in winter and in East Antarctica it is even negative.
Global data show a trend towards increasing GHE over the last 15 years. However, the Arctic shows no increasing trend over the same period, neither in winter nor in summer – see Appendix 2.
The Arctic paradoxes
In winter, the atmosphere in the polar regions is uniquely transparent to heat radiation. It is easier for the climate system to cool down in winter, as less of the heat radiating upwards is captured by the atmosphere. In the Arctic, the outgoing radiation is particularly high in winter because there is so much energy transported there from the south. This leads us to the following two Arctic paradoxes:
- The region with the fastest warming on Earth also cools the climate more efficiently than any other region.
- The region with the fastest warming on Earth has the (second) weakest greenhouse effect.
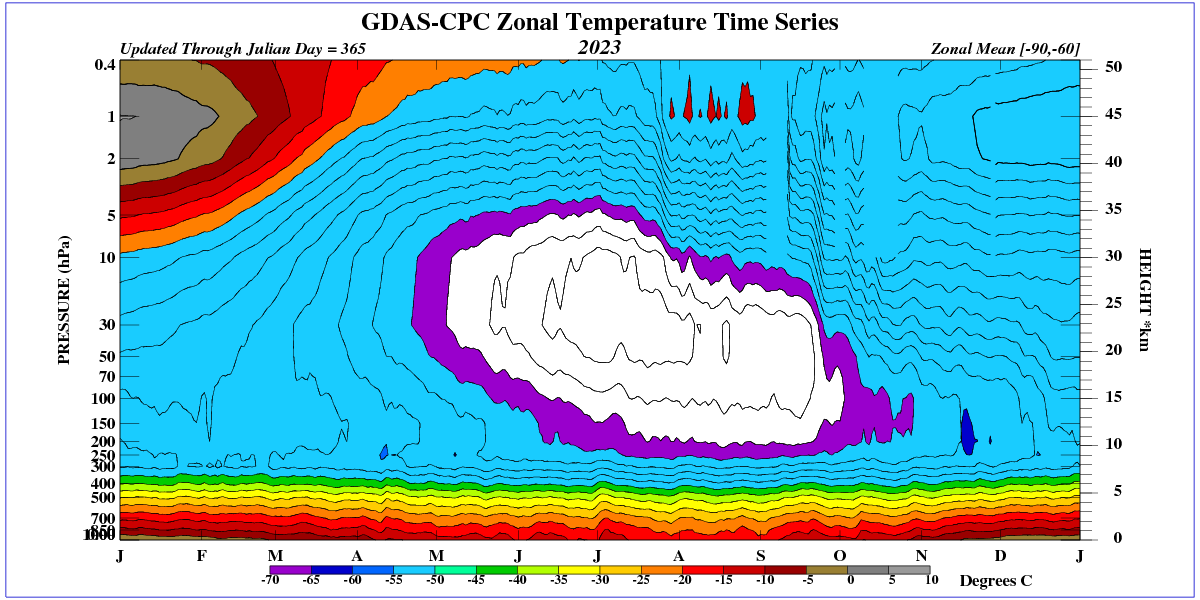
The Arctic’s function to cool the climate system is unique. In comparison, Antarctica has an even weaker GHE than the Arctic. But Antarctica has no warming trend in winter, and also has significantly less energy inflow than the Arctic.
Summing up
Research shows that the Arctic amplification (AA) is linked in time to increased transport of energy and moisture from the south. This explains the AA, and is fully supported by quantitative evidence.[8]
In order to accept the IPCC’s hypothesis that AA is mainly caused by increasing CO2 levels, one would expect to be given a physical explanation of how increased CO2 would lead to increased energy transport from the south. Such a theoretical explanation is not provided by IPCC, or in the literature referenced by them.[4][5] The only support the IPCC provides for its hypothesis are runs with its CO2-rigged models. That is questionable evidence.
Scientists who have analysed the climate history since the last ice age show that the impact of CO2 on meridional energy transport is “negligible”.[9] Satellite data also provide no support for an increasing GHE over time in the Arctic.
In summary, there is little support for IPCC’s hypothesis that increasing CO2 emissions and GHG forcing cause the Arctic amplification:
– There is no theory explaining how increased CO2 levels would lead to increased energy transport up to the Arctic.
– There is no support in climate history for a link between CO2 levels and energy transport to the Arctic.[9]
– There is no support in satellite data that the GHE has increased in the Arctic during the last 24 years, in spite of experiencing a shift to a warmer and wetter winter climate (see Appendix 2). The GHE is also particularly weak in the Arctic during winter.
– There is no explanation for the timing of AA: why did it start around 1997 and not earlier, if CO2 is supposed to cause it? Cf. the previous post on climate shifts.
– There is no explanation for the two Arctic paradoxes: that among all regions on Earth, the place with the strongest warming by far,
a. is the place where the planet cools more efficiently than anywhere else,
b. has the (second) lowest GHE of all regions.
In conclusion, there are good reasons to reject the IPCC’s hypothesis that the Arctic amplification is due to the increasing levels of greenhouse gases.
On the other hand, there is nothing that falsifies the Winter Gate-keeper hypothesis regarding the Arctic’s role in the climate system. There is ample physical evidence, as well as a substantial body of scientific research on meridional heat transport, all supporting its hypothesis regarding the causes of Arctic warming.
Appendix 1: On measuring the GHE
The direct approach is to measure the net of longwave radiation up from the Earth’s surface, minus the longwave radiation that is lost to space:
LWearth surface – LWTOA
Measured that way as an energy flux, the average global GHE is about 159 W/m2. However, there is a fundamental issue with the direct approach to measuring the GHE:the amount of GHE is highly dependent on changes in the surface temperature. As the surface gets warmer, it radiates more (Planck, or blackbody radiation), so more energy is absorbed by the atmosphere, which in turn increases GHE. This problem needs to be addressed wherever we have seasonal changes in temperature between summer and winter. To get around the problem of the temperature dependence of GHE, it is preferably calculated as a percentage of the surface LW radiation.[10]
(LWearth surface – LWTOA) / LWearth surface
Appendix 2. Development of the greenhouse effect in the Arctic
The IPCC and its ilk hypothesize that human GHG emissions and the GHE are responsible for the Arctic amplification (AA) that started in the late 1990s.[5] Let us test for the following:
- How does the GHE evolve over time?
- Has it increased in the Arctic in winter over the last 25 years as the AA has become stronger?
- Does the GHE increase in the Arctic with increasing levels of CO2?
On a global scale, there is a clear trend towards a somewhat higher GHE. This is mainly due to the increase in humidity that is an effect of global warming. As the air gets warmer, it increases its water vapour content, i.e. the amount of the main GHG: [11]

Figure 6. Evolution of the GHE globally, percentage of LW radiating back to Earth. Mean value 39.7%. Green curve is Loess average. 2000:3-2023:9. Calculated from spatial satellite data per gridcell, 1°x1°. Data source Ceres.
But in the Arctic, we don’t have the same trend. This is what it looks like in June and December, respectively:

Figure 7. Evolution of the GHE in the Arctic in June, percentage of LW radiating back to Earth. Mean value 29.4%. Green curve is Loess average with confidence interval (2σ). 2001:6-2023:6.

Figure 8. Evolution of the GHE in the Arctic in December, percentage of LW radiating back to Earth. Average value 23.5%. Green curve is Loess average with confidence interval (2σ). 2001:12-2022:12.
There is thus no support in the data from the period of AA that it has been caused by an increasing GHE in the Arctic.
References
[1] Vinós, Javier, Climate of the Past, Present and Future: A scientific debate, 2nd ed., Critical Science Press, 2022.
[2] Vinós, Javier. Solving the Climate Puzzle: The Sun’s Surprising Role, Critical Science Press, 2023.
[3] The Arctic has warmed nearly four times faster than the globe since 1979, Rantanen and 7 co-authors, Nature 2022, https://doi.org/10.1038/s43247-022-00498-3
[4] Ocean, Cryosphere and Sea Level Change, IPCC AR6 WG1, chapter 9.3, and quote from ch 4.5.1.1.2. See also SPM A.1.5, B.2.5.
[5] The Polar Amplification Model Intercomparison Project (PAMIP) contribution to CMIP6: investigating the causes and consequences of polar amplification, Smith and 14 co-authors, 2019, https://doi.org/10.5194/gmd-12-1139-2019
[6] Dependence of Earth’s Thermal Radiation on Five Most Abundant Greenhouse Gases, van Wijngaarden and Happer, 2020, https://arxiv.org/abs/2006.03098
[7] How increasing CO2 leads to an increased negative greenhouse effect in Antarctica, Schmithüsen and 4 co-authors, 2015, https://doi.org/10.1002/2015GL066749
[8] See chapters 10.3 and 11.5 in [1] for references to the scientific research on meridional transport into the Arctic. A fortcoming post in this series will also present the quantitative evidence.
[9] Heat Transport Compensation in Atmosphere and Ocean over the Past 22 000 Years, Yang and 5 co-authors, Nature 2015, https://doi.org/10.1038/srep16661
[10] Observational determination of the greenhouse effect, Raval and Ramanathan, Nature 1989, https://doi.org/10.1038/342758a0
[11] Revisiting the greenhouse effect—a hydrological perspective, Koutsoyiannis and Vournas, Hydrological Sciences Journal, 2023, https://doi.org/10.1080/02626667.2023.2287047
Technical note
The diagrams were created in R from NetCDF files, see the technical note in the first post.
____________________________________________________
The IPCC says pretty much the same thing.
AR4 Chapter 10 Page 750 pdf 4
As far as I can tell, this is consistent with a warming Earth, whatever the cause.
Sure, the CO2 theory predicts it to be warmer, at night, in winter, in cold locations. And this is observed (like that is a problem for anybody or anything).
But the historical record also shows this ‘extra warming’ at the poles when it cannot be attributed to CO2, even by the IPCC.
since 2000.. zero trend to 2016, El Nino spike then gradual cooling to May 2023
UAH goes to 85N so only misses some 3% of the area above 60N.. the coldest bit.
‘This makes the Earth on average about 33 degrees warmer than it would be if it had no atmosphere at all.’
Wijngaarden & Happer posit ~278.3K for a GHG-free Earth due to the absence of clouds.
What proportion of atmospheric mass do GHGs represent? A few percentage points or so. The consequence is that surface air pressure is primarily due to non-GHGs. To say that the difference in surface temperatures between a no-atmosphere Earth and the current Earth atmosphere is solely due to the GHE makes no sense to me. One would have to believe that if all nitrogen was removed from the atmosphere, surface air pressures and temperatures would not change from what we currently observe strikes me as just plain silly.
Good point Nelson.
Also, the atmosphere is warmed by conduction, its not entirely radiative, the non-greenhouse gases are a considerable “proportion of atmospheric mass”.
So complex, I prefer the simplicity of CO2 as the thermostat. This uncertainty justifying Net Zero is disturbing.
I think another hypothesis, not related to GHE, should be added. I see an issue with downward/back lw radiation fr a physics perspective. Another way of looking at this is to simply take the interactive molecules ( WV/Co2 etc)into consideration without talking about the GHE as such, especially w the questionable ‘back radiation’ in mind. Surely some scientist can jump in here. Marcus Ott perhaps?
Instead of relying on physically unjustified “back radiation power”, i.e. energy being transferred from a colder object to a warmer one, the GHE could be explained by the gravito-thermal effect. That makes a lot more sense to me.
Water vapor is about 1-2% of the mid-latitude atmosphere. Globally, N₂ is gas #1, O₂ is gas #2. Argon is #3 (0.93%). H₂O is #4 (~0.4% globally).
W&H’s idealized GHG-free atmosphere has the same mass as ours so the difference in temperature is not due to a difference in surface pressure. Rather, the higher temperature is due to the absence of clouds, hence (much) less sunlight is reflected to space.
What I was pointing out was simply that the author seems to have mistakenly attributed the oft-quoted 33C to the presence of an atmosphere rather than an atmosphere with GHGs.
Thanks Frank for pointing this obvious omission out, the sentence should read:
‘This makes the Earth on average about 33 degrees warmer than it would be if it had an atmosphere without GHG.’
There is a simple explanation for the Arctic Amplification: The intensity of the solar radiation reaching the arctic regions must have increased.
This increase is as would be expected, given that all of our warming since circa 1980 has been due to decreasing levels of industrial SO2 aerosols in the atmosphere, due to “Clean Air” and Net-Zero activities, as well as the 2020 mandate for low-sulfur fuels for maritime shipping.
Since the major sources of industrial SO2 aerosol pollution all lie in a belt around the northern hemisphere, as they are reduced, the more distant arctic regions, with less pollution to begin with, are affected more rapidly than elsewhere.
For proof that decreased SO2 aerosol pollution IS the cause of our modern warming, see my article
“Scientific proof that CO2 does NOT cause global warming”
https://wjarr.com/sites/default/files/WJARR-2024-0884.pdf
Someone once said, the simplest explanation is usually the best explanation. You may have nailed the AA issue.
D Sandberg:
Occams Razor
There is a much simpler explanation, the Stratospheric / Tropospheric boundary is saturated with water vapor from aviation, and it has a northerly increasing distribution. Stop flying jets for 3 years, and we are back in the LIA.
Wouldn’t that cause more of an effect in Summer (when the Sun is shining in the Arctic) and less, or even no noticeable effect in Winter (when the Sun is largely absent)? Yet, the opposite is observed: Summer temperatures largely unchanged and Winter temperatures being less cold.
MarkH:
Satellite images of the polar ice cap from 1995-present show the ice retreating during the summer and re-growing during the winter months.
There is NO indication of any winter anomaly. All of the ice melt occurs during the summer months.
The opposite situation which you suggest appears not to exist.
(It is possible that the Jet Stream might temporarily drag some warmer air north, during the winter, but it would probably be short term, and no instances of any such warmth causing any melting were observed).
So the solution is to pump all ‘excess’ CARBON (so that would include CO2, climate alarmists and their political enablers) to the Arctic, and the planet would cool off faster!
I suggest the solution is to send all the climate alarmists to the Arctic- until they decide they should stop bitching about a hot Arctic. 🙂
Bitching about a hot Arctic IN WINTER!
It was interesting reading about a warming earth sitting here looking out the window at fresh
snow from last night on the mountains around me. I’m not going to complain about
the moisture but I hope that the chokecherry and huckleberry which are in full bloom
didn’t get frosted the other morning when I found a layer of ice in a bucket with
some water in it on the deck. The wildlife needs those berrys and a no berrys year
makes the grizzlys cranky in the fall.
Just one nit to pick.
Infrared radiation is electromagnetic energy, aka longwave radiation.
Heat is thermal, aka kinetic energy.
They are not the same.
Too often the two are conflated, but they are distinct.
CO2 absorbs IR which causes the molecule to vibrate, that vibrational energy is transferred to the surrounding N2 & O2 molecules in the form of kinetic energy.
Yes, but the Co2 mouse has to fight the elephant WV to eat the IR. Co2 vibrational mode: 1, WV:3. Amount of molecules: Co2:1, WV: 20. Blackbody ( greybody, actually) bandwidth, SB equation. All (or most) of the action close to the surface..
And the mouse wins:
“Too often the two are conflated, but they are distinct.”
Yes, but in the practice of meridional heat transport (MHT), and for the purposes of this text, the difference is made clear when/if needed.
The MHT heat transport consists of the dry static energy (dry air) and latent energy transport (water vapour).
Energy is transported in different ways in the atmosphere and in the ocean, and then the same energy is radiated to space. Usually the measurement of MHT is from that radiation by satellites.
The rate of heat transport to a place must be matched by the rate of atmospheric radiative cooling. Higher rates of radiative cooling are associated with greater heat import.
This includes skyward (max 2-5km) and poleward (to an extent, maximum at 60 lat). The high pole is much too cold for high rates of radiative cooling, in spite of a small GHE.
As an alternative logic, divergence of heat transport balances the net radiative heating.
The greenhouse gas forcing hypothesis can be disproved as follows:
1) Since 1800 the atmospheric concentration of CO2 has increased by about 140 ppm from 280 to 420 ppm.
2) This has produced an increase in the downward LWIR flux from the lower troposphere to the surface of approximately 2 W m-2.
3) At present the average annual increase in the CO2 concentration is near 2.4 ppm per year.
4) The corresponding increase in the downward LWIR to the surface is ~0.034 W m-2 per year.
This is too small to have any measurable effect on surface temperature or surface evaporation (humidity)
Specifically, over the oceans, the penetration depth of the LWIR radiation from CO2 into the ocean surface is less than 100 micron. Here it is fully coupled to the much larger and more variable wind driven evaporation. Within the ±30° latitude bands, the sensitivity of the latent heat flux to the wind speed is at least 15 W m-2/m s-1. The annual increase of 0.034 W m-2 is dissipated by an increase in wind speed near 2 mm per second. The long term average wind speed in the tropics is at least 5 ±2 m s-1 (one sigma standard deviation).
The CO2 hypothesis is based on nothing more than fraudulent climate models.
The modern climate modeling fraud started with Manabe and Wetherald in 1967. They claimed an increase in ‘equilibrium surface temperature’ of 2.9 °C for a doubling of the CO2 concentration from 300 to 600 ppm. There were three main errors in this paper:
1) They used a steady state air column and forced the model to equilibrium
2) They imposed a fixed relative humidity distribution that created a water vapor feedback
3) They used a time integration algorithm on a CO2 warming signal that does not accumulate over time.
These errors were never corrected and provided the foundation for the pseudoscience of radiative forcings, feedbacks and climate sensitivity that is still used in the climate models today.
Later as computer technology improved, the original 1-D steady state models were replaced by atmospheric GCMs and then by coupled ocean-atmosphere GCMs. Starting with the Third IPCC Assessment Report in 2001, the radiative forcings were split into ‘natural’ and ‘anthropogenic’ contributions. A dubious statistical argument was used to claim that the anthropogenic forcing could cause an increase in ‘extreme weather’. This provided the argument for Net Zero. Little has changed since 2001.
Manabe got part of the 2021 Nobel Prize for climate modeling fraud.
I have discussed this fraud in detail in the recent paper ‘A Nobel Prize for Climate Modeling Errors’ published in the open access on-line journal Science of Climate Change 4(1) pp. 1-73 (2024) https://doi.org/10.53234/scc202404/17
Yep–“The role of ocean oscillations in climate change has been neglected.”
The wheel (oceans?) goes round and round and it comes out here, there and eventually everywhere.
“This has produced an increase in the downward LWIR flux from the lower troposphere to the surface of approximately 2 W m-2. ”
No it hasn’t. Energy doesn’t flow in that direction.
Here’s the full quote from the paper:
4. Climate Energy Transfer
Since 1800, the atmospheric concentration of CO2 has increased by approximately 140 ppm,
from 280 to 420 ppm, Keeling (2023). This has produced a decrease near 2 W m-2 in the LWIR flux emitted to space at TOA within the spectral range of the CO2 emission bands. There has also been a similar increase in the downward LWIR flux from the lower troposphere to the surface, Harde (2017). For a CO2 doubling from 280 to 560 ppm, the decrease in the outgoing longwave radiation (OLR) is estimated to be 3.7 W m-2, IPCC (2013). At present, the average annual increase in CO2 concentration is near 2.4 ppm. This produces an increase in the downward LWIR flux to the surface of approximately 0.034 W m-2 per year. The changes in CO2 concentration are shown in Fig. 18a and the changes in total flux are shown in Fig. 18b. More detailed calculations of the change in flux at TOA produced by increases in the atmospheric concentration of H2O, CO2, O3, N2O and CH4 have been provided by Wijngaarden and Happer
(2022).
Figure 18
“the decrease in the outgoing longwave radiation (OLR) is estimated to be 3.7 W m-2″
Except the OLR is increasing !!
Oops !!
I was going to point that out too. A lot of calculations are based on estimates based on assumptions. That’s why you get less TOA while in fact it is more.. A lot of attribution studies are based on the same principles..
So what? .034 W m-2 per year is well within the error estimate of that graph.
Don’t forget to tell Happer…
OLR increasing..
“This has produced a decrease near 2 W m-2 in the LWIR flux emitted to space at TOA within the spectral range of the CO2 emission bands.”
You missed the above qualifier.
“increase in the downward LWIR flux”
No there hasn’t. Prove it.
Even according to the not-very-well-educated-in-physics CERES folks, the average “downward” LWIR flux at the surface is -53 W/m^2; i.e. this is an upward flux. Naturally, that is what one would expect, since the surface is warmer than the atmosphere, most of the time, and as we all know, energy flows only from warmer objects to colder ones. Never the other way around.
I am on your side but I think you mean “heat” doesn’t flow in that direction not energy.
Well, since heat is defined as the flow of (thermal) energy (in the physics terminology), you can’t really say that “heat flows”. Right? (In the vernacular lingo, of course, people use “heat” as a synonym for “thermal energy”, but that’s not the physics definition.)
The extent to which actual temperatures are buried under a deluge of temperature anomalies tells you that perhaps -20° to -17° isn’t a climate emergency.
I said something similar to this in comments 10 years ago. I got a couple of things wrong in retrospect, but that was the gist of it.
I don’t see a conflict between the two hypothesis. Willis had written extensively about thunder storms cooling the tropics. Sea surface hits a certain temp (30 deg?) clouds form, thunderstorm happens, cooling the surface. At the same time, GHE measured in w/m2 is strongest in the tropics because that’s where insolation is strongest. But if the sea surface is regulated to 30 deg, where does the extra energy go?
My expectation is that the transport from tropics to arctic speeds up. It would take very little broadening of the topics plus a slight increase in transport by ocean and air current to transport that heat to the arctic. As P varies with T^4, and T in the arctic is dozens of degrees cooler than the tropics, the effect on temp would be much larger than if that energy has stayed in the tropics. Hence arctic amplification.
Antarctic is a different matter because there are additional factors at play. One is that in some cases because of the temp of the air above the ice sheet, CO2 increase actually causes cooling rather than warming.
In summary, CO2 increase causes some minimal increase in w/m2 + additional w/m2 transported from the tropics, results in an outside effect on arctic temps because the w/m2 in the tropics at +30 barely moved the needle on temp, but those same w/m2 dropped on the arctic at -20 have an outsized effect due to T^4. Presto. Arctic amplification from both hypothesis.
Yep. One of many immortal charts from Willis.
Yes, but you have to answer at least 2 questions:
WGH answers these two questions, IPCC doesn’t.
Further, the two hypotheses aren’t comparable as to what drives climate.
IPCC says CO2 and GHG forcing => enhanced GHE => global warming
WGH says the Sun’s cycles that influence the Arctic polar vortex (via different ‘gate-keepers’), influencing the Mer. Tprt. northwards to the most efficient radiative
cooling region.
“Winter Gate-keeper hypothesis”
vs
“The Green-house Gas Forcer hypothesis”
“Both climate hypotheses thus emphasize the role of the GHE in global and Arctic warming, but in quite opposite ways”
Those 2 “causes” aren’t mutually exclusive.
IE: Not “opposite” at all.
But acting in unison
AA is due to the “local” (WGH) response to globally increasing GHGs.
The OP herself says … “Changes in transport of heat and humidity up to the Arctic explain both the strong warming trend in the Arctic and its effects on global warming, according to WGH. This is especially the case during the dark polar winter”
Ocean temperatures have risen and at the start of the Arctic late autumn/winter, open arctic seas are very much warmer than used to be the case (no ice)- this is leading both to slower sea-ice re-formation and a warmer/wetter arctic atmosphere (higher GHE). As the winter proceeds warm sub-tropical air masses intrude on the forward side of Rossby waves, leading to condensation of moisture and formation of low level cloud (as a consequence of a relatively low-level inversion). It is increasing WV/cloud that is likely negating the negative GHE aloft with a stronger low level GHE.
In other words the presence of more non-condensing GHGs worldwide and the evident warming occurring is causing more WV/low level cloud during the Arctic winter especially, coupled with the feedbacks of thinner/less early season sea-ice with more open/warmer water available for WV generally for the atmosphere before winter proper.
In summer there will also be more cloud due similarly to the transport of more WV from advected air from the subtropics over a mainly ice surface. …. (Hence summer temps will hover near OC as latent heat of melting occurs).
There is a major problem with this article’s arguments that were wrongly framed.
The wrong attribution is being made here by Gabriel (and Vinos). The GHG theory doesn’t claim that AA was only directly controlled by GHGs in the Arctic in situ, no, it is a general theory about global warming, not just specific to one region like the Arctic, and it also relies on circulation.
This wrong attribution is a strawman argument, a red herring because it assumes the GHG theorists don’t also invoke poleward heat transport to explain Arctic changes, and it assumes there must be some unique special claim made about it now (by the WGH) after all this time.
Furthermore, the WGH assumes an unspecified source of warming for the ocean not from CO2.
Since Vinos ruled out changes in irradiance, he has no viable substitute for the OHC increase, other than guesswork.
It is crystal clear the Solar Modern Maximum via solar irradiance caused global ocean warming.
Is it also crystal clear the solar-warmed ocean controlled the Arctic sea ice and T2m temperature.
So really there was no need for a convoluted theory such as the WGH.
“longwave (LW) radiation back to Earth”
What longwave radiation back to Earth?
(If you only put this here in order to ridicule the IPCC’s so-called “greenhouse” effect, then no need to defend it, of course – consider them suitably ridiculed)
See Pat Frank’s comment below, and replies.
https://wattsupwiththat.com/2024/06/18/the-battle-of-climate-hypotheses-the-green-house-gas-forcer-vs-the-winter-gatekeeper-round-3-the-two-arctic-paradoxes/#comment-3927818
Thanks, Gabriel, yes, I saw that. The radiant energy bath is a good description, so you had better not be describing this energy bath in Watts, the way the fake climate scientists do. Right? (in your words, “longwave (LW) radiation back to Earth. The effect is measured in […] the unit W/m²”)
(I write this because it is a bit difficult to tell from your wording whether you actually believe the IPCC’s “greenhouse” description, or whether you are just presenting it as they wrote it so that you can point out that it is false. It feels more like the latter interpretation to me, but you could make that a bit more clear in the article, I would say.)
Please keep emphasis on the uncertainty of relevany measurements of temperature and energy.
Nobel Laureate John Clauser is currently showing not only uncertainty, but bad pennies carried through the important measure of energy in minus out out Top of Atmosphere, TOA. It is damning, read it here on WUWT. Summary, not even the basic sign of this TOA balance is known because all is inside the error bounds when properly calculated.
There are so many criticisms of temperature measurements that there has to be a problem. The Arctic, in particular, has sparse sampling through being remote, has problems with satellite coverage and has been a poster child for adjustments such as Cowtan & Way interpolation. For just a little of the past, see
https://climateaudit.org/2013/11/18/cotwan-and-way-2013/
The whole field is infested with uncertainty, whose outcome can (will) have serious repercussions for most of the global population. That is serious, so should be stressing of what is NOT known.
Arctic problems are so crude that some authors contradict or seem not to know about Archimede’s Principle that leads to melting of floating ice scarcely changing sea levels.
Geoff S
As the planet warms, from CO2 or any other cause, it emits more energy to space.
The easiest route for that energy to escape is advection toward the Arctic, where the greenhouse effect is weakest
This is a negative feedback to cool a warming planet. It is a cooling process that prevents runaway warming.
The Stefan-Boltzmann law plays a crucial role. It suggests that as the planet warms, it should emit more radiation into space, exponentially, potentially creating a negative feedback loop that could offset some effects of global warming.
A sensible comment Richard.
You’re right, it is a negative feedback, and there is an important corollary to it, energy that is lost to cooling must be replaced by a warming source for the global temperature to remain constant.
This idea is the basis of my decadal sun-ocean warming threshold system of climate change, where the amount of absorbed solar radiation is modulated by clouds & by the long-term evolution of solar activity.
When solar activity is higher than the decadal threshold over many cycles, temperatures increase.
Yes, the S-B law plays a crucial role in climate change as you said, as my use of it indicates solar activity (and orbital dynamics) can explain all of climate change without the need for CO2 forcing. This is in line with findings of CO2 saturating a long time ago, having little effect on the GHE now.
I accidently left off the subtotal line for the second set of tables, but they are included in the total.
Yup. CO2’s warming effects are logarithmic and cooling response from the planet is exponential.
This whole d@mn debate about run away warming should have died on those two points alone.
There is a couple of things the author got wrong. First all no one claims the AA was caused by CO2. CO2 along with other GHGs would be a general forcing heating the planet, but the AA (or polar amplification in general) would then be a localized feedback. And that feedback would be caused by certain mechanisms, not mentioned once in this article.
These mechanism would be..
a) the albedo effect as sea ice melts and gives way to darker water
b) a positive lapse rate feedback. As the surface warms, while the atmosphere does not so much, the lapse increases and that would in this instance cause a positive feedback
That is what the science claims. As I have pointed out a while ago, both is wrong. I also explained the true reason for the AA..
https://greenhousedefect.com/basic-greenhouse-defects/the-mysterious-polar-amplification
Anyway, I do not get the point over the intent of this “WGH”. As the arctic warms the rest of the planet should be cooling?!? That is not what it does. The planet is warming, the arctic is just warming faster.
Thanks for your comment.
Well, the IPCC make that claim with their models, and in the figures (fig 2 above) and quote from WG1.
The science claims many different things as causations of AA. Most of them, like the albedo effect as sea ice melts and a positive lapse rate feedback that you mention are at best only partial explanations. See e.g. Goose’s article with its long catalogue of factors, where every factor has to be condensed to a radiative forcing:
Quantifying climate feedbacks in polar regions, Goosse and 13 co-authors, Nature 2018, https://doi.org/10.1038/s41467-018-04173-0
WGH says that meridional transport is the main factor behind AA, and is well supported by data.
In your linked article, you’re on the right track when you bring up changes in humidity and the so called ‘Atlantification’ of the Arctic, that’s been observed esp. in the autumns.
This approach has strong support in recent research, see e.g.:
Horizontal Moisture Transport Dominates the Regional Moistening Patterns in the Arctic, NYGÅRD and 2 co-authors, AMS 2020, https://doi.org/10.1175/JCLI-D-19-0891.1
Changes in atmospheric latent energy transport into the Arctic: Planetary versus synoptic scales, Rydsaa and 3 co-authors, 2021, https://doi.org/10.1002/qj.4022
I just read the article. Thank you.
But:”the alternative theory-builders out there it shall be said, a) the polar amplification is real, it happens at the poles (and beyond), and it is not masked by climate insensitivity in the tropics. And b) it does not contradict the theory of GHG induced AGW, not per se. Once more a relatively simple issue is subject immense speculation and theory building, representing different interests, rather than sober analysis.” End quote.
well, i would say a sober analysis does not in any way prove AGW based on higher Co2 levels, esoeciallyvat the poles. If it cannot be proven we have speculation. And at that point proportion comes into play, and temperature. Not only is the amount of WV small at the poles so is Co2. And it’s, well, cold. We have 1 vibrational mode of Co2 (bending). I dont see, fr a physics point of view, a sufficient influence of Co2 on temperature.
This is not a critique of yr mainly excellent article but an ( i think) important side note..
“We have 1 vibrational mode of Co2 (bending). I dont see, fr a physics point of view, a sufficient influence of Co2 on temperature.”
There are two CO2 bending modes and they absorb right at the center of the Earth’s emission spectrum.
https://wattsupwiththat.com/2024/06/18/the-battle-of-climate-hypotheses-the-green-house-gas-forcer-vs-the-winter-gatekeeper-round-3-the-two-arctic-paradoxes/#comment-3928124
The WGH explains when and why the Arctic warms or cools, and the effect it has on the planet’s energy balance. But it does not say what the rest of the planet should do, because many factors intervene in determining global surface temperature evolution.
For example, let’s say since 1997 the Arctic is warming so the Earth is losing more energy. You might detect a Pause between 1998 and 2014 due to a strong reduction in the rate of warming. But then you might get a strong transfer of heat from the ocean to the surface in 2015-16 due to a very strong El Niño, and then you can get a very strong warming due to a 1-in-a-1000-year underwater volcanic eruption that puts a huge amount of water vapor in the stratosphere in 2022.
Obviously my hypothesis cannot predict those events.
Very nice work.
“The thermal radiation that doesn’t disappear into space must, by definition, remain and radiate towards the Earth.”
All of the radiation absorption bands seen from space represent IR radiant energy that was captured by resonant molecular vibrations and transformed into kinetic energy.
The kinetic energy is responsible for the general blackbody radiation bath of the atmosphere, which radiates in all directions. The blackbody radiation is nothing more than the radiant energy associated with the kinetic energy of the atmospheric gas molecules.
We know kinetic energy as heat, because it changes the volume of mercury columns and alters the resistance of metals..
The bit that radiates off into space is replaced by new energy radiating up from the surface, courtesy of the sun.
So, it’s not that the surface of Earth is warmed by down-radiating IR. It’s that the blackbody radiation bath is the warm atmosphere.
Yes, that assumed down radiating IR is usually a red flag to me. It seems to fill a hole in an equation. Both theories suppose that this exists but nothing is ever measured. It also brings into question the actual effect of the GHE globally.
Net radiative transfer is based on temperature differences/gradient.
You have to change the lapse rate to change net outward radiative flux.
Only H2O does that.., CO2 does not.
Yes, i added ‘globally’ just to simplify things and i left out the well known WV/Co2 factor.
Thanks Pat for your comment.
What you say is of course correct, the concept of the ‘atmospheric radiation bath’ is preferable when we talk about the radiation that remains in the system due to the GHE.
Yes, and that ‘atmospheric radiation ‘bath’ is a very elegant way of describing it.
Article says:”The GHE is the warming of the Earth’s surface due to the Earth having an atmosphere.”
The atmosphere causes most of the albedo without it the surface would get more sunshine and be warmer. The atmosphere cools the surface and insulates us from the vacuum of space.
How does one not account for ocean changes? It is by far the biggest mover of heat around the planet. Siberia isn’t cold because of a CO2 anomaly but because it’s far from the oceans.
What powers the Hadley Cell, the biggest transport of atmospheric heat around the planet. Storms in the Tropics. Where the Hadley Cell lands is where the deserts are around the planet.
Hadley Cell info: https://polarpedia.eu/en/hadley-cell/
https://antaearthsystemspheres.weebly.com/atmospheric-circulation.html
Why during the first part of this interglacial was the Sahara savannah? Changes in the Hadley Cell, so changes in ocean currents and not the current stratified waters that evaporate and causes storms that express heat at the tropics and fall down adiabatically heating with dry hot air where the deserts are and the heat domes.
Once can see this in the ocean temperatures of the early Holocene, especially in the Arctic and Antarctic.
Svalbard molluscs: https://journals.sagepub.com/doi/abs/10.1177/0959683617715701
“6°C warmer at around 10.2–9.2 cal. ka BP, when this species lived there”, it was ocean changes that transferred the heat from the tropics.
Ross Ice Shelf collapse 6k years ago: https://www.pnas.org/doi/10.1073/pnas.1516908113
The current warming in the changes in the oceans recently in the Fram Strait in the late 1800’s. https://www.science.org/doi/10.1126/sciadv.abj2946
One can see it in populations of North Pacific Plankton: https://www.science.org/doi/full/10.1126/science.aaa9942
Alpine Glaciers: Columbia Glacier History: https://www.sciencedirect.com/science/article/abs/pii/S027737912030398X
I posit that the reason we are in this Ice Age is because of changes in ocean heat transport (more heat gets used to evaporate water after 26C and make storms) instead of being moved around, and cyclical changes in this paradigm is our interglacial. The north is nowhere near as warm as it was 8k years ago and today’s warming is mostly from changes in oceans moving heat around.
Ocean transport is a minor factor compared to atmospheric transport when we get out to the polar regions. This is especially so in the Arctic. See:
Decomposing the meridional heat transport in the climate system, Yang and 4 co-authors, Clim Dyn 2015, https://doi.org/10.1007/s00382-014-2380-5
Indeed, that is why we see the heat/cold ocean circulation patterns stop when they reach the poles. And wind seems to be the main driver. We can of course clearly see the jetstreams and pressure differences influence on temperature ( and polar vortex). But that’s mainly the weather. The climate as such works on much longer timescales w the Sun, ocean oscillations etc as main drivers.
For anyone believing gh gases heat the earth’s surface, I offer this:
Every molecule of the earth’s surface, including the oceans, the ice, the plants and even the animals, is constantly radiating to space. The RATE at which it radiates is proportional to the 4th power of any increased warming. In other words, if the surface is heated at all, it will increase its outgoing radiation to balance that which is incoming. That is the most precise thermo-control system (thermostat) in existence, and we see it function every day.
Calculate how many gh gas photons are hitting the earth’s surface, then how many are radiating away to space. There are an incalculable number of radiating molecules on the surface, which can be seen with a common IR camera. Everything is radiating. There isn’t a possibility that a gas in the atmosphere can warm the earth. The sun does that. In any event, if a photon DID strike a surface molecule, it would increase the energy of the surface molecule, and it would increase its own rate of radiation. It.ain’t.possible.to.heat.the.earth.with.a.gas!!!
That’s what i take the general mechanism does: le Shatelier’s principle. It doesnt need ‘back radiation’. And the aforementioned playground of the atmosphere w vibrating molecules (mainly WV) can delay outgoing IR. It cannot ‘backfire’.
I stopped right here.
I’m no writer. Have never submitted anything for publishing. But even I know that an author should define acronyms and abbreviations when they are first used. No reader should have to hunt for it.
I guess my pickiness is just a holdover from the journalism class I took.
Agreed 🙂
The first time Arctic ampl. (AA) is mentioned in the text, the abbrev. is defined, but i missed that figure 1 comes before that place.
I like it better in journals when all the acronyms are defined in one place.
Could someone help me out here? I am utterly baffled by the omission from both the IPCC’s discussion and this article of the most important mechanism of heat transfer from solar radiation to the atmosphere, namely CONVECTION.
Could someone please explain how the GHE is explained in percentage terms, in particular how it can be negative? Does this mean that in some circumstances an increase in certain GH gases would lead to a decrease in temperature?
It’s explained in Appendix 2.
There is a minus term in the ratio, thus it will be negative if LW measured at TOA is bigger than LW measured at surface.
So yes, during i big part of the year the Antarctica radiates so much that we get a decrease in temp when CO2 increases. But the area where this happens isn’t that large.
*Appendix 1*
Using realistic numbers, the temperature in a desert can go from 50F at night to 100F during the day. In a humid place along the Gulf Coast you might see 75F at night and 95F during the day. So in the low GHG environment you get a 50F swing, while in the high GHG environment you get a 20F swing. This DIFFERENCE obviously can’t be due to the current CAGW theories.
I’ve noticed that the climate scientists don’t understand thermodynamics, for example, the difference in heat capacity between water vapor and nitrogen. Or the heat of evap and the heat of condensation.
Along the Gulf when the temperature at night reaches the dew point, you get dew forming. This greatly slows down the temperature drop. During the day you get evaporation. Also, since water vapor is a light gas you are more likely to get thermals, convectively moving heat off the surface up to higher elevations in the atmosphere.
None of this is modeled, so the models are bogus.
The author of the above article describes the total “greenhouse effect”, or infrared radiation absorbed by all IR-absorbing gases, including water vapor. Since water vapor is far more abundant in the atmosphere than CO2 or the other IR-absorbing gases, it is responsible for most of the “greenhouse effect”, or the fact that the atmosphere is warmer than it would be if it consisted only of non-IR-absorptive gases such as nitrogen and oxygen.
However, if the incremental increase in infrared absorption is calculated for a high CO2 concentration and a low CO2 concentration at the same water-vapor concentration, it is found that the incremental temperature change due to increasing CO2 follows the opposite pattern–the temperature increase is highest in cold and/or dry climates, and lowest in warm and/or humid climates. This is because warm and/or humid climates have high water-vapor concentrations, which absorb most of the IR radiation in the band where CO2 also absorbs (14 to 16 um wavelengths), with little left for CO2 to absorb, while in cold and/or dry climates, there is more IR radiation left for CO2 to absorb.
This means that the net temperature change due to (for example) doubling the CO2 concentration is lowest in the tropics, and highest at high latitudes, but mostly in winter. In mid-latitudes with changing seasons, the warming effect due to CO2 is higher in winter than in summer, so that increasing CO2 concentrations will lead to milder winters but little change in summer.
In the Arctic regions, where the ocean is ice-covered and land is snow-covered in autumn and winter, CO2 may increase temperatures, but the baseline temperature during the polar night (particularly on the high-altitude Greenland ice cap) is so far below freezing that the temperature rise does not lead to increased melting. In summer, there is open water around the southernmost areas of the Arctic Ocean, which leads to increased evaporation of water vapor, and the formation of clouds and fog, which tends to limit the temperatures to a few degrees above the freezing point. This is evident from records of surface temperatures above 80 degrees North latitude, where summer temperatures are limited to about 276 K (3 C) year after year, with very little change since these measurements began.
Although the CO2 warming effect is greatest in winter, it would not lead to melting of the Greenland ice cap, whose temperatures are well below the freezing point.
Then you still have to tell me exactly how much Co2 is supposed to warm the polar atmosphere given both the amount of Co2 molecules and the overall polar temperature which is very low in winter. And w no WV to help. And w only 1 vibrational mode. It must be a miracle molecule..Given all the other forces at play the effect of Co2 on polar temperatures is…(fill in the blanks).
Once again, assumptions are fine but proving it is still needed. And that is a priori impossible. I think we can scratch Co2 off the suspect list.
CO2 has three IR active vibrational modes, two of which are at the center of the Earth’s emission spectrum.
Question: do satellites in winter measure the temperature of the troposphere or the stratosphere above 7 km in high latitudes.