By Javier Vinós
Part I in this series on the Sun and climate described how we know that the Sun has been responsible for some of the major climate changes that have occurred over the past 11,000 years. In Part II, we considered a range of changes that the Sun is causing in the climate today, including changes in the planet’s rotation and in the polar vortex that are changing the frequency of cold winters.
None of the evidence for the Sun’s effect on climate we reviewed is included in the IPCC reports. The role of the IPCC is to assess the risk of human-induced climate change, not to find the causes of climate change, which since its inception has been assumed to be due to our emissions.
- Main solar theories
Nevertheless, some scientists continue to try to explain the Sun’s effect on climate and have developed three different explanations. These three theories are not mutually exclusive. The fact that one is true does not mean that the others are false.
The first theory is based on the direct effect on climate of changes in solar radiation. Because the effect is proportional to the cause, we say it is linear.
This theory has been defended by Dr. Soon, Prof. Scafetta and 35 other scientists in a recent paper.[i] To explain the Sun’s effect on climate, these scientists make their own temperature reconstruction, based on rural stations to avoid the urban heat effect, and their own reconstruction of solar activity over the last two centuries. Figure 1 left shows their reconstruction compared to the one accepted by the IPCC on the right. The differences between the two would explain a much larger effect of the Sun on climate than that accepted by the IPCC.

Figure 1. Left graph shows in black a temperature reconstruction using only rural stations from four regions in NOAA’s GHCN dataset, and in orange a high variability solar series. Right graph shows in black a temperature reconstruction with urban and rural stations and in orange an IPCC’s AR6 recommended solar series (from Soon et al. 2023).
In the second theory, it is cosmic rays that change the climate, and the Sun’s magnetic field regulates the number of cosmic rays that reach the Earth. It is therefore an indirect effect, but also a linear one, since the change in cosmic rays would be proportional to the activity of the Sun.
This theory, proposed by Dr. Svensmark, is based on the fact that cosmic rays create ions in the atmosphere that act as cloud seeds.[ii] Part of the theory has been confirmed by experiments in a particle accelerator, but it is not yet known whether the effect is significant enough. One problem is that cosmic rays have increased while satellites show a decrease in the low cloud layer, which may actually contribute to the observed warming.

Figure 2. Percentage cloud cover anomaly (black) from EUMETSAT CM SAF dataset. Cosmic ray data (red) from the Oulu neutron monitor database.
The third theory is the one I have proposed.[iii] In it, the Sun acts indirectly on the climate, and its effect is non-linear because other factors are involved. Non-linear means that the effect is not proportional to the cause. This explains why there is no direct correlation between the Sun and surface temperatures, although the Sun’s effect is important. What is this process, capable of changing the climate in a natural way, that scientists have not properly accounted for? It is heat transport.

Figure 3. Three main types of solar theories based on the direct or indirect effect of different components of solar variability. Less developed hypotheses based on solar particles and solar wind have also been proposed.
- Changes in heat transport change the climate
What is heat transport?
Most of the Sun’s energy reaches the Earth in the tropics, creating a zone of excess energy that receives more energy than it emits, shown in red in Figure 4. Outside the tropics, there are two energy deficit zones, which receive less energy than they emit and whose size depends on the seasons. They are shown in blue in Figure 4, which presents the situation during winter in the Northern Hemisphere. These imbalances should result in continuous warming in the red zone and continuous cooling in the blue zones. That this does not happen is due to the transport of heat, which also transports moisture and clouds, and is very important for the climate. The climate of any region depends on insolation and the transport of heat and moisture.

Figure 4. Actual graphic of the mean top of the atmosphere net radiation by latitude for December-February, showing positive values in red and negative values in blue, placed in a cartoon showing the Earth’s tilt with respect to the Sun. The direction of heat and moisture transport is shown with purple arrows.
Heat transport is a particularly difficult climate process to study and some scientists who research it believe current theories do not satisfactorily describe it.[iv] The seasonal variation in heat transport is very important. Because of the tilt of the planet’s axis, much more heat is transported in the winter than in the summer.
In the first chapter of the 6th Assessment Report, the IPCC provides a clear explanation of climate change, defining its causes as follows: “The natural and anthropogenic factors responsible for climate change are known today as radiative ‘drivers’ or ‘forcers’. The net change in the energy budget at the top of the atmosphere, resulting from a change in one or more such drivers, is termed ‘radiative forcing’.” According to the IPCC, heat transport is not considered a radiative forcing and, therefore, not a cause of global climate change. Its effects only contribute to internal or regional variability. This perspective is reflected in the limited attention given to heat transport in the IPCC reports. In the massive 2,391-page 6th Assessment Report, heat transport is only briefly mentioned in a 5-page subsection on ocean heat content.[v] In this subsection, we learn that climate change is due to heat addition, while changes in ocean circulation cause heat redistribution.
To the IPCC, variations in heat transport have not contributed to recent climate change because they only redistribute heat within the climate system, while recent climate change is due to heat being added to the system. Therefore, heat transport cannot cause global climate change, only regional changes.

Figure 5. The first objection to changes in heat transport being a cause of climate change is incorrect because the greenhouse effect is very uneven, so emissivity is altered by poleward heat transport.
Is this true? Actually, it is not. It is rarely mentioned, but 75% of the Earth’s greenhouse effect is due to water vapor and water clouds.[vi] And their distribution by latitude is extremely uneven. The tropical atmosphere contains a lot of water, and the polar atmosphere in winter contains almost none. Therefore, the greenhouse effect in the polar regions is extremely small, and the transport of heat from the tropics to the Arctic changes the emissions. This means that the total is not constant, so heat transport has the ability to change the global climate through changes in water vapor and cloud distributions.
In the 1960s, Jacob Bjerknes stated that if the top of the atmosphere fluxes and oceanic heat storage remained relatively stable, the total heat transported through the climate system would also remain constant. This implies that changes in atmospheric or oceanic transport should be compensated by changes of the same magnitude and opposite sign in the other one. This Bjerknes compensation has not been empirically demonstrated but is present in all models despite its physical basis being unknown.[vii] If the compensation is true it should result in transport being constant and, thus, not a cause for climate change.

Figure 6. The second objection to changes in heat transport being a cause of climate change is incorrect because heat transport to the Arctic does not show the expected compensation.
But again, reality is different. Heat transport can increase in the atmosphere and also in the ocean, changing the amount of energy transported. In fact, this is logical because an important part of ocean transport is in surface currents driven by wind, which is also responsible for heat transport through the atmosphere. If the wind increases, the transport in both compartments should increase.

Figure 7. Upper graph, tropospheric winter latent energy transport across 70°N by planetary scale waves (Rydsaa et al., 2021). Lower graph ocean heat transport to the Arctic and Nordic Seas in Terawatts (Tsubouchi et al. 2021).
This is also supported by data from two studies of Arctic heat transport in recent decades.[viii] Both atmospheric and oceanic heat transport increased in the early 21st century. In the Arctic, winter temperatures have risen sharply. Obviously, that heat has to be transported there, because the Sun does not shine in the Arctic in winter, so no heat is generated. And the increase in temperature has greatly increased the emission of infrared radiation into space. Remember that the greenhouse effect is very weak in the Arctic at this time of year, and heat is not retained. Because of the warming of the Arctic caused by increased transport, the planet is losing more energy than it was losing before.

Figure 8. Upper graph, Arctic winter temperature anomaly. Data from Danish Meteorological Institute. Lower graph, 5-year November-April average outgoing longwave radiation anomaly at 70-90°N top of the atmosphere from NOAA data (black) and solar activity (sunspots, red) with a decadal Gaussian smoothing (thick line).
So, what has caused this warming of the Arctic in the 21st century? CO₂ has been rising sharply since the 1950s and its effects on radiation are instantaneous, they do not take 50 years. There’s also talk of it being a consequence of the warming that’s been going on since the mid-1970s, but why should it take two decades for the heat to reach the Arctic? We have the Sun. Arctic warming and increased outgoing radiation coincide in time with the decline in solar activity that began in the mid-1990s with solar cycle 23, which, as we have seen, was accompanied by a weakening of the polar vortex.
How do we know that the change in solar activity caused the change in transport and the warming of the Arctic? Because it has been doing so for thousands of years. A study by leading scientists looked at the relationship between solar activity and Greenland’s temperature and found that over the past 4,000 years, solar activity has been inversely correlated with Greenland’s temperature.[ix] When solar activity decreased, Greenland warmed, as it is doing now. It also says that there have been periods in those 4,000 years when Greenland was warmer than it is now, which is inconsistent with being caused by our emissions.
- How the Sun changes heat transport
The signal from the Sun is received in the stratospheric ozone layer, which absorbs much of the ultraviolet radiation. This is a very sensitive receiver because UV radiation changes 30 times more than total radiation (3%). But in addition, the increase in UV radiation creates more ozone, which also increases by 3%. With more ozone and more UV radiation, the ozone layer experiences a temperature increase of 1°C with solar activity, which is much more than at the surface.
The ozone response to changes in solar activity modifies the temperature and pressure gradients, and this causes the speed of the zonal winds in the stratosphere to change, as we saw earlier. When the activity is high, the gradients become larger and this causes the wind speed to increase, and when the activity is low, the gradients become smaller and the wind speed decreases. In the troposphere, atmospheric waves called planetary waves are generated, and when the wind is weak, they reach the stratosphere and hit the polar vortex, weakening it. But when the wind is strong, they do not manage to enter the stratosphere and the vortex remains strong. Changes in the vortex are transmitted to the troposphere, altering atmospheric circulation and heat transport.

Figure 9. Cartoon showing the mechanism by which solar activity regulates planetary wave activity in the stratosphere and the polar vortex strength and, through it, winter atmospheric circulation and heat transport toward the Arctic.
Planetary waves are atmospheric waves of the Rossby type. The largest storms on the planet fit into their undulations and have a huge impact on meteorology. They are responsible for some of the most extreme atmospheric phenomena, such as the heat waves in Europe in 2003 and in Russia in 2010, and the floods in Pakistan in 2010, in China in 2012, and in Europe in 2013. The amount of energy they move is staggering. Planetary waves are the largest of all, and under certain conditions can reach the stratosphere, hitting the polar vortex and weakening it.
Fifty years ago, a scientist suggested that if the Sun had an effect on climate, planetary waves were a possible candidate for the mechanism.[x] But no one investigated this possibility, and the paper was forgotten.
A 2011 study finally proved him right, showing that planetary waves in the Northern Hemisphere respond to the solar cycle.[xi] Figure 10 shows the sunspot cycle in red and the amplitude of the planetary waves in black. We observe large oscillations from one year to another because the mechanism is not exclusive to the Sun and there are other causes that affect it. This is the difficulty of studying non-linear phenomena. But the effect of the solar cycle is clear, because the highest amplitudes occur in periods of low solar activity.

Figure 10. Planetary wave amplitude index based on the averaged amplitude of wavenumbers 1–3 averaged over 55–75°N in 70–20 hPa (black, from Powell & Xu, 2011). Annual sunspot index (red, from SILSO). Purple circles indicate high wave amplitude years that coincide with low solar activity.
The effect this has on the polar vortex was discussed in Part II and is shown in Figure 11. More active solar cycles, with fewer planetary waves, have faster zonal winds and stronger vortices, while during less active solar cycles the increase in planetary waves weakens the vortex.

Figure 11. Monthly sunspot number (red), cumulative anomaly of zonal wind speed at 54.4°N, 10 hPa (blue, Lu et al. 2008), and the mean vortex geopotential height anomaly at 20 hPa (purple, NCEP, Christiansen 2010).
We have already mentioned the effect this has on the frequency of cold winters in the Northern Hemisphere, but how does this mechanism explain the change in global climate?
- How the Sun changes the climate
My theory is that when solar activity is high, the zonal winds are strengthened, preventing the planetary waves from entering the stratosphere and allowing the vortex to remain strong throughout the winter. By acting as a wall, the vortex reduces heat transport to the Arctic in winter, and this causes temperatures to drop, reducing the infrared emissions to space that allow heat to escape from the Earth. All of these steps have been verified by scientists. The result is that by reducing emissions, the planet conserves more energy, which can cause it to get warmer. This is the situation that occurred from the mid-1970s to the late 1990s, when the planet experienced strong warming under high solar activity.

Figure 12. Climate-changing mechanism through changes in heat transport as a result of high solar activity.
When solar activity is low, the zonal winds subside, allowing planetary waves to enter the stratosphere and hit the vortex, weakening it. As the wall weakens, heat transport to the Arctic increases, causing it to warm. This warming increases emissions to space, causing the planet to conserve less energy. The result is that the planet either warms more slowly or cools, depending on other factors. Because this mechanism regulates the amount of heat that enters the Arctic in winter, I have named my theory “The Winter Gatekeeper”.

Figure 13. Climate-changing mechanism through changes in heat transport as a result of low solar activity.
It is important to note that this is not a solar theory, although it does explain the Sun’s effect on climate. Variations in heat transport are a general cause of climate change. Perhaps the most important one. Any factor that persistently changes the amount of heat transported becomes a cause of climate change, and this includes plate tectonics and orbital variations. This theory has the ability to explain the ice age of the last 34 million years, and the growth and shrinkage of the ice sheets in glaciations and interglacials.[xii] The explanations it provides fit the evidence better than the CO₂ changes.
The solar mechanism I propose has the following features:
- It is indirect, because what changes the climate is not the change in solar energy, but the change in heat transport.
- It is exclusively due to changes in the Sun’s ultraviolet radiation.
- It produces dynamic changes in the stratosphere, which is the part of the climate system whose response to the Sun is important for climate change.
- The mechanism works by altering the propagation of planetary waves, as proposed 50 years ago.
- Since there are multiple causes that affect this propagation, the cause-effect relationship becomes non-linear, which makes it very difficult to study because we humans think linearly.
- It affects the polar vortex, which is responsible for transmitting what happens in the stratosphere to the troposphere, determining the position of the jet streams and the atmospheric circulation in winter.
- In its final part, the mechanism alters the transport of heat to the Arctic in winter. This is the most visible effect of the Sun on climate. Winter temperatures in the Arctic and the frequency of cold winters in eastern North America and Eurasia reveal the Sun’s effect on climate.
- Finally, the mechanism works because the greenhouse effect is extremely heterogeneous across the planet. It is a very thick blanket in the tropics, leaving the poles exposed. Increasing CO₂ doesn’t change that because most of the greenhouse effect is due to water, which changes much more than CO₂.
This theory explains many of the problems that the Sun’s effect on climate has always had:

Figure 14. The solar part of the Winter Gatekeeper theory provides an explanation for several questions and solar-climate related phenomena, some of them not properly explained before.
- It explains the mismatch between the small change in solar energy and the resulting climate effect. The change in solar energy only provides the signal, like the finger pushing the button on an elevator. The energy to change the climate is provided by planetary waves, which carry very large amounts of energy and act on sensitive parts of the climate.
- It explains the lack of cause-and-effect correlation claimed by NASA and the IPCC. It is a non-linear process that cannot be required to have a linear correlation.
- It explains the recent warming of the Arctic, the timing of which cannot be explained by CO₂ or global warming.
- It explains the recent increase in cold winters in the Northern Hemisphere that scientists cannot adequately explain.
- It explains changes in the Earth’s rotation due to the Sun that no one has been able to explain. Changes in atmospheric circulation induced by the Sun are what alter the angular momentum responsible for variations in the Earth’s rotation.
- It explains the cumulative effect of changes in solar activity on climate. Why grand solar minimums have such a large effect, proportional to their duration. Low activity alters the energy balance by increasing emissions throughout the duration of the grand minimum, progressively reducing the energy of the climate system and causing the effects to become larger and global over time.
- It explains the greater impact of solar-induced climate change on the Northern Hemisphere, as it affects the heat transported to the Arctic. The Antarctic polar vortex is much stronger and less sensitive to solar forcing. This is why the Medieval Warm Period and the Little Ice Age, caused by solar forcing, were much more pronounced in the Northern Hemisphere.
- It also explains a significant part of the 20th century warming. The 70 years of grand solar maximum in that century caused the planet to increase its energy and warm up.
- Conclusion
The Sun has a lot to say about future climate, but we are not listening. Long-term changes in solar activity are cyclical, and what adds to warming now will subtract from it in the future. This theory does not deny that changes in CO₂ affect climate, and indeed it is based on differences in emissions due to changes in the greenhouse effect, just not in time, but in space, with latitude. But it is undeniable that if the Sun has played a relevant role in the warming of the 20th century, it reduces the role our emissions have played.
This article can also be watched in a 19-minute video with English and French subtitles.
References
[i] Soon, W., et al., 2023. The detection and attribution of northern hemisphere land surface warming (1850–2018) in terms of human and natural factors: Challenges of inadequate data. Climate, 11 (9), p.179.
[ii] Svensmark, H., 1998. Influence of cosmic rays on Earth’s climate. Physical Review Letters, 81 (22), p.5027.
[iii] Vinós, J., 2022. Climate of the Past, Present and Future. A scientific debate. Critical Science Press. Madrid.
[iv] Barry, L., et al., 2002. Poleward heat transport by the atmospheric heat engine. Nature, 415 (6873), pp.774-777.
[v] Fox-Kemper, B., et al., 2021. Climate Change 2021: The Physical Science Basis. 6th AR IPCC. Ch. 9 Ocean, Cryosphere and Sea Level Change. pp.1228–1233.
[vi] Schmidt, G.A., et al., 2010. Attribution of the present‐day total greenhouse effect. Journal of Geophysical Research: Atmospheres, 115 (D20).
[vii] Outten, S., et al., 2018. Bjerknes compensation in the CMIP5 climate models. Journal of Climate, 31 (21), pp.8745-8760.
[viii] Rydsaa, J.H., et al., 2021. Changes in atmospheric latent energy transport into the Arctic: Planetary versus synoptic scales. Quarterly Journal of the Royal Meteorological Society, 147 (737), pp.2281-2292. Tsubouchi, T., et al., 2021. Increased ocean heat transport into the Nordic Seas and Arctic Ocean over the period 1993–2016. Nature Climate Change, 11 (1), pp.21-26.
[ix] Kobashi, T., et al., 2015. Modern solar maximum forced late twentieth century Greenland cooling. Geophysical Research Letters, 42 (14), pp.5992-5999.
[x] Hines, C.O., 1974. A possible mechanism for the production of sun-weather correlations. Journal of the Atmospheric Sciences, 31 (2), pp.589-591.
[xi] Powell Jr, A.M. and Xu, J., 2011. Possible solar forcing of interannual and decadal stratospheric planetary wave variability in the Northern Hemisphere: An observational study. Journal of Atmospheric and Solar-Terrestrial Physics, 73 (7-8), pp.825-838.
[xii] Vinós, J. 2023. Solving the Climate Puzzle. The Sun’s surprising role. Critical Science Press. Madrid.
Interesting model. It is a pity the temperature records are corrupt.
It will be hard to judge the theories if the temperature measurements are mmm..calibrated. To some, no matter what cooling will occur the temperature still goes up. Especially with manipulated graphs based on attribution io observations.
Excellent article. From that one could make predictions that or may not come true. Does Javier dare to make some?
Only three comments so far, as the thread is presented to me. Your last comment could easily be construed as neither negative nor positive. Yet all comments have received a downvote.
As night follows day, I predict this kind of apparent bot-downvoting behaviour will continue. That may not be caused directly by the sun.
Most likely caused by a different religion than sun worship
Michael, about the downvoting…
I got up early this morning and made several comments within the past hour, and since they were all downvoted almost immediately, I can only conclude there are people just sitting there quietly trying to protect Javier from criticism, if it wasn’t Javier himself.
Several other people made very good critical comments and were all heavily downvoted, telling me there is an unhealthy groupthink in play here at WUWT over this false hope.
People have vested too much into it emotionally, and some are just not being objective.
Javier already made a prediction, about sunspot trends, which came true. It is documented in Reference [iii] in the above article.
If reincarnation turns out to be a real thing, I think I want to come back as a firefly, so weather conditions wouldn’t bother me, and my head wouldn’t hurt from reading climate hypotheses.
The benefit of all these climate hypotheses is that it shows that “the science ain’t settled”.
What a heap of bs. Just a few examples.
Well, it’s an emergent phenomenon in models. Models match empirical evidence well, so we have a very good “empirical demonstration” for Bjerknes compensation.
Somehow sulfur aerosol pollution is a thing that is hard to comprehend in Denierland.
At the first sight it’s just as “inconsistent” as your hypothesis of increasing temperatures being a result of decreasing solar activity in the Arctic. But we have calculations (ie. models), and we now know how it is possible and that there’s no inconsistency. We don’t have that for your hypothesis…
Could you please explain how this insult illuminates anything? Please explain how aerosol pollution explains your quoted question of why it takes two decades for the heat to reach the Arctic. Don’t just assert it in a throwaway insult, explain it.
The sudden warming in the 70s was due to cuts to sulphur emissions. Aerosols blocked the sun.
BSing again, I see…
The surface station warming is all from urbanisation and other human “effects” corrupting the surface data..
The UAH data shows atmospheric warming only at strong El Nino events.
SO2 emissions peaked in about 1980
Well, no, it was before 1980. But what is more important, the rate of change decreased already in the 60s. All the while, the real counteracting factor, CO2 was steadily increasing, balancing and then overcoming the dimming effect of SO2.
pure speculation. !
Which part? 🙂
There is no evidence CO2 causes warming , so the “counterbalance crap is just that…. CRAP !!
Oh 🙂 now I know.
No, you are still ignorant.
You’re my master in that, you lead by example
poor petal.
Now Do you have any scientific evidence for warming by atmospheric CO2 ?
Or will remain an empty sack of crap.
Could you please amplify upon this, and explain why models have any probative value? Please provide some references.
Models are just calculations. They are stepwise solutions to very big and complex differential equation systems. We need to have numerical approximations because these systems don’t have a so called analytical solution. This is it. In other words models are just a much more complicated variant of a calculation like distance_traveled = speed * time_traveled.
A very good resource is the current IPCC report.
The current IPCC report is totally TAINTED and CORRUPTED by the UN political agenda..
It is not science and was NEVER meant to be.
It is not worth the paper it is printed or the disc memory space it occupies.
Climate models are little more than glorified (only by the climate scammers) computer games…of very little worth and basically zero predictive value.
all models are hypothetical, they might be right or they might be wrong- they are surely not just complex calculations
This is a meaningless statement. In a sense, everything is hypothetical. Models are simplifications and approximations for sure, trade-offs between precision and computing need.
Climate models are definitely based on hypothetical conjectures.
Not much real science in them.
Until the models are “unfudged” and verified they are definitely hypothetical.
All models are what you paid for them to be
A model is just a hypothetical way of trying to make sense of a complex relationship of many variables. It might be almost right- or not. It probably fails to account for many variables. It can be useful if it helps make predictions and if they don’t pan out, then the model needs to be changed. Some of the wind/solar shills here seem to think models are more than they really are- just tools.
Oops, I can see some sobering up here… Models are just complicated numerical approximations. Calculations.
We paid a lot for them. Just an observation. The question is, did we get our money’s worth?
I wonder who paid and why for the simple model of distance=speed*time. Or the orbital mechanics models. Or the weather models.
Again the simplistic idiocy of trying to compare basic physics models with the computer games of the climate models.
“Or the orbital mechanics models.”
Orbital mechanics models can’t be solved exactly. To solve the two body problem you need 12 integrals. There are only ten available. So they solve the modified two-body problem with one body fixed in space. The solution leads to a conic section. But you lose the position with respect to time. To find the position with respect to time, you must solve Kepler’s equation. That equation is a trigonometric equation that can’t be solved exactly. You need a method such as Newton’s to solve it incrementally.
That’s why they use models. Just as with climate.
That’s why they use models. Just as with climate.
You do realize that you just admitted that climate models do not give exact results.
Now the only remaining item to determine is how inexact the climate models actually are. That is normally done through verification which proves that climate model projections have been totally incorrect for 40 years.
Projecting future states based on a data matching algorithm trained on past states is useless in a chaotic, non-linear system.
The CAGW apologists keep saying their future results are projections and not predictions. Those projections are linear based on a cherry picked set of past states. That’s why the projections into the past don’t recognize the MWP or the LIA. That also means they can’t recognize anything similar in the future – which have a large impact on future climate.
They are doing that in orbital mechanics. Perhaps you should tell them.
Those projections are linear based on a cherry picked set of past states.
Hilarious how you can’t get even simple things right. FYI we are talking about approximate, stepwise solutions to differential equation systems.
I have the bad feeling that you mix a few things up (as usual…). First of all, I’m pretty sure you’re talking about the “hockey stick”. There’s a persistent denier brainfcuk that each and every climate science result is a modelling result. Well, no. The hockey stick and all the other (dozens) independent reconstructions are, well, reconstructions. They are not based on modelling (using the narrow interpretation of the word).
Secondly, there are past model simulations (not many, as far as I know, our knowledge of past climate is still kinda low resolution). But the bad news for you is that their results match our knowledge (manifested in those modern reconstructions).
And the third is that the LIA and the MWP were not global. They do show up in both reconstructions and in those simulations as local phenomena.
Jim, have you been here for the last few days? This is exactly what I was telling you. And it wasn’t just me. I didn’t admit anything. I said that from day one. Models are just fcukin calculations. Necessarily approximations. With widening uncertainties as we project it to the future. Congratulations for understanding this.
No, this is factually untrue.
Right.
Glad to hear you agree with Dr. Pat Frank about the epuncertainty in models.
Well, no, I don’t agree. And widening uncertainties doesn’t mean what that idiot says.
The “single PDF file” version of the AR6 WG-I report is 2409 pages long.
It contains approximately 550 pages of “References” sections, ~500 for the main report plus ~50 for the annexes.
I may be wrong, but I suspect that “Scarecrow Repair” was asking you for some specific “references” to individual scientific papers that address the specific scientific issue(s) under discussion.
_ _ _ _ _ _
From your OP :
AR6 WG-I, Box SPM.1, “Scenarios, Climate Models and Projections”, on page 12 :
Even the IPCC admits that however “well” the models may perform, there remain differences with the empirical data — i.e. actual measurements made by correctly-calibrated scientific instruments — in specific areas.
They even admit that the more radical future “projections” made by the official CMIP6 climate models can already be classified as “unlikely” to actually occur out here in “The Real World (TM)”, even assuming the individual “emissions pathway” inputs to the model(s) were to be followed precisely.
AR6, WG-I, section 1.5.4, “Modelling techniques, comparisons and performance assessments”, page 221 :
Even the IPCC admits that their own models have limitations.
Probably yes, more probably it was just deflection. Anyway, this is not my duty to provide these. Science is hard, you have to read, furthermore, the internet is full of good resources.
Yes. And? We can’t find the predicted number of neutrinos from the Sun. Does that mean that the Standard Model is wrong? Be careful, this is a tricky question ‘cos Physicists know that the Standard Model is definitely wrong (eg. it gives nonsensical results inside a black hole). But most of the time the error is extremely small. And this is a full circle. The error of GCMs to empirical is small, well within bounds. There are things that models don’t “catch”. There are things that models did not catch but they are able to do that now as their precision and resolution increase (basically computing capacity).
And deniers talk about a cult… So we have some pretty good results that have an increasing uncertainty if projected to the far future. For the next few decades we have a very confident projection. I don’t see any problem here. If we don’t have 100% exact results it doesn’t mean we are completely ignorant.
Mr. letter-salad-for-name: Not your duty??!! Don’t you want us to agree with you?? ‘Cause if you did, and you were right, you’d cite the page and line to support your point. But you don’t do that, do you? I’d pretend to wonder about that, but I don’t.
For that matter, I don’t give a damn about you.
Sometimes I do, sometimes I don’t. Doesn’t really matter for hardcore deniers.
What the hell does that mean?
No, but it means we are 100% wrong. When it comes to climate modelling, you can’t be ”a bit” wrong. Once again you show a fundamental flaw in your understanding. All climate models are wrong. Not 90% wrong, not 24.67% wrong. Just wrong. Therefore they cannot be used to predict anything.
“We can’t find the predicted number of neutrinos from the Sun.”
Old news. The Solar neutrino problem is solved. Neutrinos change flavor. Once we could detect all three flavors, then the number of neutrinos is correct. The fact that neutrinos can change flavors means they have mass.
“And deniers talk about a cult…”
Another troll that uses offensive terminology.
The whole thing was just an illustration to the fact that even if an established theory was not (yet) able to explain certain phenomena it didn’t mean the theory was invalid. Some genius had come up with the differences between models and the empirical data. I just gave him a sobering example. And I’m pretty sure you know about the dozens of phenomena that the Standard Model still can’t explain. Yet.
No one has ever denied that models have limitations or claimed that they are perfect, the only claim made is that they are useful for understanding the climate system and its response to perturbation, which is undeniably true.
The ONLY claim made is we are at a precipice and will cross a tipping point leading to apocalypse if we do not act IMMEDIATELY.
I have no problem with models. I have no problem with the limitations. I do have a problem with politics enters and dominates calculus.
That’s what’s happening in WUWT. This and numberless other forums, think tanks etc. are industry funded attacks on science. For a few bucks. And this is extremely well documented. I have yet to see any evidence for a global conspiracy of scientists.
You don’t need an active conspiracy. All you need is a cadre of professors teaching misinformation. Students do not have the knowledge nor opportunities to research on their own.
How many papers have you read that conclude insect or animal changes are due to CO2 climate change? None of the papers I have read ever have detailed experimental data on reproductive change when the “global temperature” rises by two degrees. Same with flora. How many studies have you read about climate change causing grain shortages? Most are all conclusions without proof.
Worse, most scientists assume the Global Average ΔT, occurs everywhere on the globe. You have seen many demonstrations posted here that destroy that assumption.
Show us a page from NOAA that headlines the fact that not everywhere on the globe or even in the U.S. is experiencing full on global warming. I can confirm from my experience in secondary education that never occurs. That is the real conspiracy.
That would be an active conspiracy, right? Anyway…
Students do have knowledge of the fundamentals (maths, physics, etc.) upon which anything is dependent. This is a very stringent requirement in any training in Natural Science. This is why you can’t really bs in science. You’ll get caught pretty quickly. That’s why the “contrarians” could not produce even one paper.
Again, one of your misconceptions. No, they don’t.
Well, I have only seen anomaly maps that are like the rainbow (deltaT ranges are colour coded). You are flat out wrong. The Arctic is especially red. etc.
If you call a conspiracy a small group of influential professors who have convinced themselves of of an incorrect theory then that’s on you.
I’m not talking basic fundamentals. Tell us exactly what advanced physical science upper level courses you have taken. Those that deal with cutting edge technology. There are continual refinements and new discoveries that expose previous assumptions and past teachings incorrect.
Your expectation that students have the facilities to verify cutting research is absolutely naive and totally incorrect. I had a 2nd semester senior level course taught by two professors who worked on developing tunnel diodes at Bell Laboratories. We learned about the impurity doping and diffusion equations that controlled how electrons tunneled. If you think I had access to the necessary funds and equipment to validate what was being taught, you are totally insane. It tells me the most physical science you have had only requires basic calculus.
More likely is that you have never had any serious physical science classes where you were taught theories from cutting edge research.
You should. Natural Science is extremely dependent on these. This is the toolset you use. BTW I only mentioned the fundamentals ‘cos I wanted to point out that these conspiring professors couldn’t fool even the students.
You tell me 🙂 For that matter, we always covered the proofs one way or another, and the proofs are always mathematical even when we approximate. In other words, the maths should add up, and even students can check that (and it was expected that we would check them). Remember, in science the whole thing should constitute a big and coherent system.
I’m telling you that you can’t even fool students, at least in the long run. You certainly can’t fool other scientists who are not part of the conspiracy.
So you claim that certain professors can manipulate a field by making up certain equations that are incorrect but they eventually give the results they desire, furthermore the majority of scientists who are ostensibly outside of this conspiracy are unable to discover this fact. Scientists, not students, and not deniers. You said that it was a relatively small number of professors, while in climate science there are 10s of 1000s of scientists.
For that matter, how long do you think a conspiracy to taint Digital Technology (this was the general subject name for the field in Hungary where, among others, we dealt with impurity doping and diffusion) would last? Imagine, some professors, for incomprehensible reasons, come up with some bad equations that won’t push the mathematical theory to inconsistency (‘cos otherwise even students can discover the problem), somehow hide all the other text books, etc.
I love when you bs around.
Don’t put words in my mouth by using an argumentative fallacy. Here is what I said:
I never said once that what I was taught was incorrect. That assumption is on you!
I was addressing your assertions that students, with the knowledge of fundamentals of math and science, can tell if what they are being taught is incorrect. What a joke! I’ll reiterate; “If you think I had access to the necessary funds and equipment to validate what was being taught, you are totally insane.”
That is a great indicator that you have never achieved the level of science education where cutting edge knowledge is being taught. That really makes all your protestations pretty lame.
Well, you did say that there were equations you couldn’t verify yourself, as a student. But why do you assume that non-students couldn’t do that either?
Again, the mess in your head… I never claimed you said that. What you did claim was that there was a cabal of professors in climate science who were doing that. And I was referring to that.
Well, I didn’t say that, or, if you wish, I didn’t mean that. First of all, students at this level are supposed to be able to use higher maths as a tool, not just the fundamentals. Furthermore, you can’t fool people for too long in Natural Sciences. Every field has a consistent mathematical system (called a “theory” * ). It’s freakin hard to make up even some equations, they have to fit into this established mathematical theory even if they are wrong otherwise even students will recognize the problem ‘cos the maths becomes inconsistent. In other words, it’s freakin hard to fool even students. Furthermore, even if you come up with something, domain experts, who are outside of your conspiracy will easily recognize that.
Jim, even bsing has to be done properly.
* Here the word “theory” means a very well defined thing. The proper name is “consistent formal theory”.
Again, you are using red herring strawman to make an argument. You automatically fail.
Funny how you don’t quote what I said. Show me where I used the word manipulare. When cutting edge research is done, experiments, methods, and uncertain measurements can mislead researchers into wrong conclusions. These can be propagated into academia and take on a life of their own.
You sound very much like a young, naive and narcissistic mathematician. You have neither the experience nor wisdom to properly assess results. If you can’t admit that the models used by the IPCC have been incorrect and that there is no reason to expect any change in the future, then you have not examined the past outputs objectively.
This statement reveal your background as a mathematician rather than a physical scientist or engineer. Physical science doesn’t rely on blackboard mathematical “proofs”, it relies on experimental measurements to verify mathematical relationships developed from hypothesis’s. It is why uncertainty is ALWAYS assumed and experiments include methods to evaluate it. Climate science is very deficient in this.
You said “teach misinformation”. If you want to, I can rephrase my sentence:
Satisfied?
Wrong, but kinda right. You may not know but in the old educational system that we used to have (it is usually called the Prussian (ie. German) system) the proper mathematical background was extremely important in the education of Natural Sciences and Engineering. In the West it’s not like this, and unfortunately it’s kinda gone here at home, too. I finished EE (MSc). In high school I majored maths (that was a very intensive program extremely well known and famous in Hungary).
Bs. Physical science and engineering have a so called formal mathematical theory. Actually, there are two theories, both inconsistent and partial, the Standard Model and Relativity. In practice we mostly use a third one, the already falsified Newtonian model. Anything that is done in Physics or Engineering has have to be done in these models, or it has to have a good approximation (like a model).
Remember your “data matching” fiasco? 🙂
You may have finished your EE (MSc), but we both know you have not done the down and dirty work to design, build, measure, and redo till your design works and meets specs. How many million dollar projects have you designed, built, and supervised to bring them in on time and within budget. You appear to know little about measurement uncertainty and how it affects your model outputs.
Again, bsing won’t help you when you run out of arguments.
Dude, we both know you are part of the blackboard jungle. I can tell from your responses that you have not one iota of concern about measurements and their uncertainty nor of model uncertainty. That reveals much about your commitment to proper engineering. Not once have you mentioned what uncertainty is associated with the outputs of the models you believe are correct. That says volumes.
Incorrect. And this is very characteristic of you.
I’m lost here. Again, a question that doesn’t make sense. A well known characteristic or yours. What do you mean by “correct uncertainty”? They publish the uncertainty that is time dependent. It’s not “correct” or “incorrect”, it’s a value.
Me:
You:
Exactly where did I say “correct uncertainty”?
Quit the red herring argumentative fallacy’s. Do what I asked, what is the uncertainty of the models you believe are correct. You might also include the uncertainty budget used to calculate the uncertainty.
In the sentence you cited just a few lines before. I repeat:
Okay, this sentence can be understood two ways, and on second reading I realized that “correct” referred to “models” here. My bad. Please note that there’s another reading where “correct” refers to “uncertainty”, and I’m not a native speaker of English.
Okay, you can find these values in the relevant literature. Those experts known as “scientists” have all the answers to your questions.
Wrong.
Incorrect!
Complete and utter hysterical crap.
If the models don’t give the right answer then how useful can they be? The response to perturbations is conditioned by how by how accurate they are.
A model can never give the “right” answer because it is a model. By its nature it is a simplification of the real system, and it is a simulated version of the system, not the system itself. But models giving not-right answers can be quite useful because the not-right answer can be very, very close to the right answer, and because understanding all the ways in which the model is not right and working to improve them is a necessary part of growing our understanding of the system being modeled.
No, climate models are nothing to do with the “real” system.
They are based on anti-science conjectures, and ignore many of the main drivers of energy in the atmosphere.
They are worse than GARBAGE.
That only applies to models with well understood parameters. Not climate models. Stop confusing the two.
What’s this supposed to mean? Could you please entertain us? Can you show me a model that has well understood parameters? And what are those parameters? And what are those parameters in climate science that are not well understood?
Given what they have lead to, worse than useless.
Crap.
Calculations, yes. But dynamic simulations. Time varying parameters, for example, result in state dependent calculations.
You omitted the non-linear aspects of multiple parameters.
Yes, approximations, but because it is quite difficult to model atomic scale interactions in a 25 Km grid.
So called analytical solution. True. But the claim is there is one. Apocalypse.
One of the flaws of most arguments fails to recognize that the planet is NOT a closed system and most of the processes are not simple closed loop functions.
There will never be an equilibrium achieved due to the constant fluctuations of so many different factors.
And the models assume a constant rotation, a constant axis tilt, a average/ mean orbit, an average/mean solar surface temperature, etc. etc. etc. all of which are needed because the scale of what is being studied is beyond our capabilities to accurately simulate, but the results of the use case projections are touted as perfect.
I didn’t omit anything. No one has ever claimed outside of Denierland that models can only be linear.
Why on earth should we model atomic scale interactions? In practical settings, where do you have to use atomic scale modeling?
There’s no such claim, of course. FYI analytical solution means a set of formulas with “simple” operators like addition, multiplication etc. to get a result. Even the three body problem doesn’t have an analytical solution. That’s why we need stepwise approximation.
No one claimed these. Actually, the reason for warming is the difference between incoming and outgoing energy flux.
This is plainly false. FYI Modelling could reproduce the extremely slow cooling due to the Milankovic cycles.
“Modelling could”
The operative word is “could”, not “does”.
And how do you know what they do? 🙂 I’ve seen your misadventures with that Nature article (or that was perhaps Jim… Can’t recall…).
*YOU* are the one that used the word “could”, not me!
For that matter, it was the past tense of “can” in that particular sentence. But for you, and just for you, and just now I rephrase it:
Satisfied?
Mr. letter-salad: Not until you rephrase it for EVERYBODY.
Mr. dumbass, you don’t deserve a rephrasing. Tim, Jim, and I are good old friends, you’re just a random idiot.
Your idiocy isn’t random.. it is constant and all-pervasive.
And worse still…..descending … descending…
How many made-up “parameters” did that take !
And worse…..
What does “n” stand for in the equation (PV = nRT). That is the Ideal Gas Law if you don’t recognize it. How about thermodynamic heat, q = m • C • ΔT? Do you reckon “m” has any relation to the number of atoms?
Ahhh, you are a radiation only adherent. Screw convection and conduction, right? Tell us how CO2 heats N2 and O2 without conduction. Tell us how CO2 cools N2 and O2 without conduction. Tell us how H2O transports heat to altitude where condensation causes radiation to space without convection.
That’s not atomic scale, you genius. Atomic scale modelling is when you model the behaviour of individual atoms. Ideal gas is a statistical construct. Gee, you have quite a mess in your head.
Please read and comprehend before you write. Sparta was bsing about the planet not being a closed system. The planet, you idiot. The planet itself can only exchange heat with radiation. In space there’s no convection nor conduction, you genius.
“Atomic scale” means ON THE SCALE OF ATOMS, you duffus. The comment didn’t say “intra-atom”.
“n” is how many moles of a gas is in a volume. Do you remember Avogadro’s number? From Brittanica;
You said;
Here is what Sparta said;
Processes is plural you idiot. Conduction, convection, radiation. Heat transfer occurs WITHIN the system called planet Earth. That is what the whole essay covers.
Modelling the behaviour of individual atoms doesn’t mean modelling the inside of atoms, you idiot. It’s very hard to debate you for all the wrong reasons… Look, modelling the movement of an atom (or molecule) and its interactions with other atoms is the modelling on the atomic level. Ideal gases model this statistically, you genius.
I was reacting to this from Sparta, you idiot:
because that other idiot claimed that climate science thinks it WAS closed. I pointed out that the imbalance between incoming and outgoing radiation is basically what drives warming according to science. Which is, of course, the opposite of his claims about the assumptions in climate science.
And It is interesting and very telling that this is like the 3rd round, and I’m not entirely sure that you have understood this fcukin simple thing.
And it gets worse!
Through hind casting AKA curve fitting.
To massively tainted surface data…
… tainted by urban warming, bad sites, fast acting thermometers, infilling, data manipulation and just plain old data fabrication.
Totally unfit for the purpose of measuring real global surface temperature changes over time.
No absolutes, please. Change it to massively unfit for the purpose.
Do not lower yourself to the level of the alarmists.
Too late for him…
I will never be as low as you constantly are.
I stick with the TOTALLY UNFIT.. because that is exactly what they are.
No deniers here.
Tell us what we “DENY” that you have anything but FANTASY science to back it up with..
It would seem that YOU are the science DENIER.. or just plain ignorant.
You are the one DENYING that the SUN is by far the main source of energy for the planet. !
He thinks models are just complex calculations.
I certainly don’t think they are magic 🙂 I have the bad feeling that you deniers do think that. You feel the Hogwarts vibes.
“You feel the Hogwarts vibes.”
Only from the AGW sect.. Voltemort on steroids.
No , they are not magic.. and they are certainly NOT science. !
You really are clueless about “models” in general, aren’t you nikky !
Take your slurs to some lefty rag old boy
Science is no left wing or right wing. Though brain rot is right wing for sure.
Complete farce is only one step away now….
Here we go. Pragmatics asking questions (aka skeptics) are automatically deniers because we do not worship the models.
Copy that.
I didn’t see any questions, just ex cathedra assertions from very unprepared and unqualified people. This is not skepticism.
Mr. letter-salad: “assertions from very unprepared and unqualified people.” Not skepticism, just projection. From you, who thinks we must prepare for your insipid, unqualified remarks.
Exactly, Mr dumbass, exactly. I can’t see any skepticism in WUWT.
When ad hominems are employed, it implies the inability to argue confidently with facts or evidence.
🙂 Please talk to Mr dumbass about this. I’m just answering in kind.
All I can see for little-nikky is mindless AGW mantra gibberish.
No science, no evidence.. just yapping.
He appears to be close to if not involved in climate modeling. The best he has is that the modelers know what they are doing with complicated math.
I learned how to solve Maxwells partial differential equations for EM waves. To get answers, one must make numerous assumptions. Each assumption caused uncertainty and could only be discovered through experimentation whose measurements also introduced further uncertainty.
Wrong.
And there we are. Lol.
Lol.
“Tell us what we “DENY” “
You deny being a denier
Do you deny that?
If so, you are a double denier.
So you can’t back up the attempted slur with anything.
Just petty juvenile comments.
As expected.
It was actually funny. +1
And you still can’t say what I “deny” that you can actually prove.
Pathetic. !!
Mr Greene is at his most profound today!
“Tell us what we “DENY” “
You deny being a denier
Do you deny that?
If so, you are a double denier.
And you still can’t say what I “deny” that you can actually prove.
You get more pathetic by the day. !
Don’t look now but you’re dribbling.
“it’s an emergent phenomenon in models.”
ROFLMAO.
If it is programmed into the models… of course it will be an emergent property…
… but it is NOT SCIENCE.
The models aren’t hard-coded to produce specific emergent phenomena. By definition, emergent phenomena are features that arise naturally from the underlying physics programmed into the models. No programmer dictates that a model should produce a hurricane with specific features on a given date, for instance. Instead, they implement the laws of physics and equations governing fluid dynamics, and hurricanes form as a result of these fundamental processes represented in the model.
The models are exactly what the payee asked for
If the payee is asking for the best numerical representation of the earth system that modern computers can produce, then, yes, the models are indeed what the “payee” is asking for.
The models are not remotely a representation of the earth’s climate system
They are load of agenda-driven, conjecture-based anti-science junk computer games, suitable only for climate propaganda…
Just what the payee wanted.
So, inputting a sensitivity, inputting an estimate of aerosols, inputting an estimate of clouds, and tweaking those estimates to “tune” the model to match the historical records is not programming to produce specific phenomena?
Copy that.
Correct, incorporating estimates of different factors like aerosols and clouds into the models is not the same thing as programming them to generate specific phenomena. Phenomena like hurricanes arise because of the interactions between the different simulated processes like dynamics of the atmosphere and oceans, and these emergent properties are one thing that indicate to scientists that models are skilfull.
Climate sensitivity is generally an output of the models, not an input.
You are attempting to use red herrings to deflect from the problem that models have in forecasting a global average ΔT. Why don’t you concentrate on that problem.
I’m addressing bnice’s misconception about what emergent properties in climate models are, your attempt to pivot into an entirely different topic might be construed as you deflecting.
Your lack of understanding of how models work is totally hilarious.
If you program in a baseless conjecture eg CO2 warming.
That is what the model will show.
Absolutely GIGO. !
100%!
Are you kidding? How do you evaluate the effects? We all know! You play with them to get WHAT YOU THINK IS CORRECT. I’m not even accusing anyone of nefarious actions. The fact is that if you don’t have an accurate functional relationship with appropriate equations, then any “estimate” must be evaluated based on what you THINK the end effect should be. The uncertainty has to be off the chart!
Have you heard of model calibration and verification?
Have you? Let’s see, you have admitted that models can’t forecast local and regional climate accurately because the resolution is too course. NO MODEL CALIBRATION AND VERIFICATION.
The IPCC models have run hot since their first forecast 34 years ago. NO MODEL CALIBRATION AND VERIFICATION.
Why don’t you cut to the chase and show us how accurate the IPCC FAR most likely forecasts have been using GCM’s. Heck just show the first 5 and and how well they met actual measured temperatures. No excuses, just the data.
Only in academia do failures justify more and more money and time. In business, decades of failure would not be allowed.
Heck, the models have been unable to decrease the range of ECS. In fact the range has increased! NO MODEL CALIBRATION AND VERIFICATION.
I haven’t said anything like that. For the 100th time, please try to understand what you debate before you answer. Somehow you can’t get even simple things right.
Climate models are lower resolution than weather models, for simple pragmatic reasons, ie. computing power. It doesn’t mean they can’t “forecast” local and regional climate. They can. They can’t forecast weather, for sure, and that’s not what they have been built for.
This is plainly false, and it’s very characteristic of the low level you deniers understand things.
Well, it doesn’t mean they are wrong. Furthermore, we are more and more confident in the current levels. FYI we have already reached an anomaly of 1.1C and we are only halfway through a doubling, so the lower level is very likely too low.
This is plainly false, and it’s very characteristic of the low level you deniers understand things.
Well, it doesn’t mean they are wrong.
============
Your denial is meaningless. Here is just one example.
https://ibb.co/D8BYbLd
This is often repeated, and wrong. Either out of stupidity or deliberate deception. They compare mid-topospheric to surface.
So the model already ”knows” about the human co2 thing eh?
God, it just get’s worse…..
Have you thought this through before posting? Human CO2 emissions scenarios are the input to the models.
“But we have calculations (ie. models)”
LOL.
You mean conjecture-driven, low-end computer games…
Basically just “pretend” science.
“You mean conjecture-driven, low-end computer games”
We finally agree on something
There is no evidence that humans can predict the climate in 100 years.
Therefore, models programmed by humans are worthless confuser games for climate predictions. but very useful for leftist climate propaganda,
The IPCC models don’t include the variations in the Sun which supplies almost all the heat or the ocean currents which store most of the heat. The models only look at human causes, that’s what they were designed for so of course they claim they found some i.e. CO2, methane, etc.
It looks like their models missed smog which blocks the Sun’s rays causing cooling and sulfur emissions which seed the clouds which also block the Sun’s rays. Those have been reduced so of course it had warmed with less of the Sun’s rays blocked.
‘Cutting pollution from the shipping industry accidentally increased global warming, study suggests’
“A reduction in sulfur dioxide emissions may have caused “80% of the measured increase in planetary heat uptake since 2020.”
https://www.livescience.com/planet-earth/climate-change/cutting-pollution-from-the-shipping-industry-accidentally-increased-global-warming-study-suggests
‘Pollution Paradox: How Cleaning Up Smog Drives Ocean Warming’
“New research indicates that the decline in smog particles from China’s air cleanups caused the recent extreme heat waves in the Pacific”.
https://e360.yale.edu/features/aerosols-warming-climate-change
The fact is that almost everyone spends most of their time indoors anyway.
The cost is astronomical, $US200 trillion according to Bloomberg’s Green Energy Research Team other estimates are similar if not more.
https://www.bloomberg.com/opinion/articles/2023-07-05/-200-trillion-is-needed-to-stop-global-warming-that-s-a-bargain
https://www.bloomberg.com/news/articles/2023-09-21/investors-call-for-policy-unleashing-275-trillion-for-net-zero.
There are 2 billion households in the world so that works out to $100,000 per household, ninety percent of the households in the world can’t afford anything additional so that is about $1 million per household in the developed world or about $36,000 per year or additional $3,000 per month per household for 26 years.
The fact is that almost everyone spends most of their time indoors anyway.
Most families would prefer to have $1 million in the bank and a degree or two of warming.
They are not the IPCC’s. And they do include. You are so keen on parroting bs w/o evidence…
Models are approximate calculations that try to account for all factors. They are not very different from any calculation about physical quantities. More importantly, they are essentially lower resolution versions of weather forecasts (run much longer and multiple times with varied initial and input conditions). I wonder how your bsing about “what they were designed for” applies for weather models…
This doubly ironic. Emissions are just inputs to models, for obvious reasons. They can’t predict things that result from human interaction like sudden cuts to emissions. I really-really hope I don’t have to explain this. But the real irony here is that you specifically mention the sun blocking qualities of sulfur because the mid 20th century cooling and its sudden reversing in the 70s was the result of sulfur emissions and their curbing, respectively. And the “theory” outlined by Vinós above got this completely wrong.
Emissions are just inputs to models, for obvious reasons. They can’t predict things that result from human interaction like sudden cuts to emissions. I really-really hope I don’t have to explain this.
I really-really suggest that you have a good look at how the models actually work. To suggest that they can’t predict human interaction is just absurd or willful ignorance. On the other hand your explanation might be a useful addition to the world’s knowledge base
This is the entertaining part 🙂 Even I couldn’t predict such a stupid interaction from you, how can I expect that from a model 🙂
Things that are dependent on human actions are inputs to models, not outputs. Like the CO2 emissions or SO2 emissions. We set up scenarios with them, you genius. Models are not for predicting human actions. Models are for calculating climate.
Climate is the 30 year average of weather. That calculation does not need a model.
Really? Then you can surely tell us how climate will look like 15 years from now, right? So please entertain us, and do it without using models. Just with your rugged and pure brain power.
Red herring fallacy. Neither can you!
Or do the models really give predictions which you’ve already denied?
Exactly. That’s why we have climate science. They do that for us. BTW Sparta said we didn’t need models for climate calculations. That genius was talking about past climate, where what he said was actually correct. But for the future… But that’s model territory. And I think Sparta knows that.
This question doesn’t make sense. This is a habit of yours (or Tim’s?).
Please, someone make it stop. Lol.
I can see, your ignorance is painful.
AR6 WG-I, Figure 7.7, on page 961 :
Please show where the models used by the IPCC “include” variations in their “Solar” inputs.
It says “Solar” up there. Yes, this is that small. BTW this looks like a summary.
The line that says “solar” indicates the solar input to forcing. I’m not sure if you intended to demolish your own position with this graph, but bravo.
Mr. J and friend: He underlined variations. The line that says “solar” doesn’t say “variations”. Does one need to look further to see what you imagine “demolish[es]” his position, or did you just miss the underline part? If you’re gonna smirk at somebody, you should be more careful, ’cause you and the letter-salad-for-name goof look pretty lame here.
Solar forcing arises from solar variation. There has been little variation in solar output over the modern warming period, which is why the solar forcing component is very small:
Mr. J: So the word “Solar” on a chart labelled “simulated temperature contributions in 2019” means all that? Now who’s smirking?
ROFLMAO.. Using GISS as any sort of temperature reference.
Hilarious! and very stupid.
IPCC estimates 2w/square metre from all the co2 ever emitted from fossil fuels. Sun contributes 1367w/square metre. TSI INCREASED from 1980 -2000. It’s the sun, stupid.
17:09. It’s the sun.
Well, no. It is actually slightly decreasing, while we measure ever increasing warming.
+100
As a minor error budget, ok.
But as a variable, a real time variable, nope.
Write a paper about that. Demolish them! Show them who the real man is. Do not let Michael Mann to be the only mann here.
You are making an assertion with no proof whatsoever. At worst, it is no more wrong than the models that the IPCC has used. Even the IPCC admits the models run hot. You can’t just ignore that.
From:
d41586-022-01192-2.pdf (nature.com)
Even Gavin Schmidt and Zeke Hausfather were authors of the paper that says this. You are battling an uphill battle trying to justify the model’s outputs as being correct. It doesn’t really matter how complicated, how many lines of code, how many parameters, or how much the programmers want to prove their reliability, they RUN HOT.
I was talking about this from Javier:
He clearly didn’t get the SO2 thing.
Not again, Jim… This is for a particular model family. The problem had been recognized and corrected, and they could use even the hot models to get useful information. Jim, why do you always have to say stupid things?
Your diversion won’t work here. This model family was used by the IPCC and is propagandized every day in all forms of media.
Your assertion infers that new models will have a more realistic forecast of future temperature. Forgive me if I don’t hold my breath. Been hearing this for 40 years but somehow the models have never changed in their reliability.
Not again, Jim, please, this is tiring… I was really talking about Javier’s thing. You simply misunderstood it. And this is not the first time even in this thread. Please first try to understand what we are talking about, right?
Yep. And they know its limitations. Scientists are extremely disciplined people. That is part of their education. They can handle this.
Forgive me if I don’t give a damn. And what is more, no one gives a damn. The irony is that in a sense you deniers have won. Not the scientific argument, of course, but that of the public opinion. The constant bs barrage has had an effect. But it has taken so long that climate change is already here. People simply feel it. And in a few years time you will feel the open contempt towards you. You may regard this as my scientific prediction.
Poor you. The deniers have won by using propaganda to change people’s mind. They are being brain-washed to believe climate change isn’t real. Foo-fo-rah!
People have climate change low on the list of their concerns for a very good reason. They aren’t experiencing a huge increase in temperature. Look at the attached graph. Do you think the people in Alabama are really feeling a huge increase in temperature?
People like you have been banging the gong for 40+ years about how much the global temperature is changing. Wake up! Changes of one-hundredths of a degree can’t be detected by humans, or probably any other living thing that experiences 20-30 degree changes each and every day.
You are your own worst enemy by refusing to admit that the models run hotter than what is actually occurring. Even people who are semi-literate in science can look at a graph and see that predictions have always been incorrect. That has been occurring for 40+ years. What do you think 40+ years of evidence will do to people’s opinions?
It’s much more than that, and it’s perceptible even during one’s lifetime. Even the second half of teh 90s was perceptibly colder. That’s 25 years. And it’s getting faster.
Here I’m not even talking about the models but the already happening change. And people feel it, and you will be lucky if you are regarded just as a flat earther in the future.
Exactly where in the Alabama graph do you see it getting perceptibly warmer? It’s not apparent on the high side.
Why do you ask questions that have been answered already? We have told you 100 times that warming is not uniform. There are places where it’s not perceptible. Continental US used to be one of them.
Used to be one of them? You’ve seen Alabama. Here are two more from across the U.S.
Look carefully at the temps from the low months. What do you see?
Continental US in general. Not Alabama.
Why don’t you check out the different states. FYI, if you look closely, you’ll see the winters are where the growth in average temperature is occuring. It is not in the summer months when insolation is highest and CO2 would have its biggest effect
In other words, there’s warming 🙂
Yep, this is a very good illustration when an amateur tries to criticize science. How do you know the effect should be the biggest that time? When you have heat transport processes (in plural 🙂 ) that redistribute heat in the atmosphere, you have to be very careful with assertions like the above. BTW Javier has partly based on his model on a paradox phenomenon that results in greater Arctic warming with decreasing insolation, and I can’t see your criticism. Consistency is definitely not one of your strengths.
LOL! Those are monthly averages dude! Do you think summer month temperatures aren’t higher than winter month temperatures? So yes, the highest temperature months are in summertime and the lowest temperatures occur in winter.
Again, which one shows the most growth, summer highs or winter lows?
I would like to cite a deep thinker of our age, a certain Jim Gorman:
And your question:
I don’t care, this is a detail. BTW you’d better know that warming is possible even when summer highs and winter lows both decrease.
Screwed up the pictures.
https://ibb.co/bLCvwLt
https://ibb.co/dfQbJSD
The difference between climate models and weather forecast models?
Why do you think climate models are not? Maybe not that frequently but anyway…
Yep, because they are modeling a chaotic system. We are not able to forecast too far into the future. And we don’t need to. Because we are interested in climate, not weather. That’s not forecast. That’s more like statistical properties. Like precipitation and insolation.
🙂 Yep, the Bankers of Zurich and the Elders of Zion… I love when rightwingers shxt their panties.
LOL! Without weather, there is no climate. Why do you think that 30 years of weather is required TO DETERMINE CLIMATE? You have the whole thing turned upside down in order to make an incoherent argument!
Again, what the hell are you talking about? Why do you answer w/o properly understanding a thing? Running a model is a single trajectory. For weather they do it with a high resolution model, and that’s all. For climate, they have a lot of runs with slightly different initial conditions and inputs. So we have arrived back to your bs:
Now we have a lot of trajectories to get some statistics from. Ie. CLIMATE, you genius.
But, all those “trajectories” are basically guesses. Unless you are willing to admit to those uncertainties and are willing to assign values to those uncertainties, you are just peddling guesses.
So far, we have seen six projections of modeled futures from the IPCC, and all have run hot. There is absolutely no reason to expect anything different in the future.
You seem to have the answers needed to make the models accurate. Perhaps you should write a paper that convinces the IPCC to use only the model that you obviously feel is being done correctly.
I await with bated breath to see your tome.
Yep. But they are trajectories anyway, and we are interested in the attractor (ie. climate).
This is the eventual purpose of this whole thing. Climate modelling is basically computing an extreme number of trajectories and their statistical analysis.
Again, wrong. Please read at last the Nature article you had linked.
If you start with guesses, YOU END UP WITH A GUESS!
Guesses in the scientific sense. You know, things with uncertainties.
“they are essentially lower resolution versions of weather forecasts”
This part is true. And therefore they are completely useless for “forecasting” more than a few days into the future. Right?
Well, yes. But they don’t use them for forecasting. FYI even weather models aren’t good enough for longer term forecasting. This is due to the inherently chaotic nature of weather. We use models to map the attractor, and its changes. The attractor (in a settled state) is just climate, and weather is the individual trajectories.
I might buy that, except I’ve seen how the models work, and they don’t do anything like “mapping the attractor”. If they didn’t clamp the energy states at each time step (by artificially injecting or throwing out energy), the modeled Earth would either be boiled away or frozen solid in a matter of months, if not weeks. That’s not “mapping the attractor”.
Various folks have shown that after these nonphysical energy clamping steps, all the models are really doing is producing an average temperature that is a linear function of the amount of atmospheric CO2 fed in. That’s not “mapping the attractor” either. It’s more accurately described as “assuming the conclusion”.
This is a metaphor.
This has been explained quite a few times here…
I have some bad news to you. “Physical” is kinda “nonphysical”. Because modern Physics is just a mathematical model where the “model” here is not the same as in climate modelling. Actually, modern physics is two models, not even one: Relativity and Quantum Mechanics. Both are likely incorrect (they give nonsensical results inside a black hole), and partial, and we can’t harmonize the two in their current forms.
In practice, we almost exclusively use a third model, the Newtonian, that was falsified at the beginning of the 20th century. Well, the Newtonian is much simpler mathematically than the other two, and for everyday problems, the difference is negligible.
I hope you can see now what “Physical” means in Physics. Basically approximations where the simplicity of the approximation does matter. In other words, if they clamp energy states, and they show that this doesn’t introduce nonexistent behaviour, in other words, if they calibrate and verify the model, as they always do, then there’s no problem with that, and it’s not “nonphysical”.
What a joke when it comes to GCM’s.
First, ΔT’s have a large uncertainty, like in the units digit. When you claim GCM calculate to one-hundredths or one-thousandths digit that is so deep in the uncertainty interval that you can’t claim “calibrated”.
Second, to “verify” an output, you need to show that it has the correct regional and local values. This is the problem with averages without knowing the other statistical parameters associated with the average. Numerous combinations of values can have the same average yet have vastly different distributions. Why don’t you show us the uncertainty calculations for a single model run, not an average of multiple runs. If the initial values have an uncertainty, that MUST be propagated to the output. Show how that works.
Lastly, the “physics” mathematical models you reference ARE validated EXPERIMENTALLY. Sub-atomic particles have been postulated by mathematics AND VERIFIED BY EXPERIMENT. From Wikipedia;
The models run hot regardless of your protestations. The IPCC published information confirms this. It matters not if the inputs are inadequately known or if the internal calculations are bogus, the models are not trustworthy because they run hotter than observations. End of story.
And what? That’s why we use averages. Those have a much lower uncertainty. It has been explained to you numberless times here.
Again, I have a bad feeling that you mix measurements with model outputs. Anyway…
In practice these are just normal. I would like to refer you to the ASOS sensors you mentioned the other day. In the excerpt you uploaded they mentioned that their output was actually an average of six readings. In other words, this is just normal to an extremely small error, the convergence is very quick.
Furthermore these are normal even when the variables that are averaged have different distributions. You don’t have to have the same distribution. When the distribution is the same, the formula is simpler, you get the familiar square root formula.
The multiple runs here are the same as the multiple independent measurements for an instrument during calibration. In other words, a single model run does not have uncertainty. (Or rather it has an uncertainty of zero.)
Yep. Just as simulation models. The process is very similar.
I would like to tell you that in practice, most of the time, they tweak the mathematics until it fits observations. Einstein did that with the cosmological constant. It is kinda rare (but of course happens) that the mathematics “postulate” (actually: predict) something that has not had observational evidence, like when Yukawa predicted the pi-meson. Actually, Einstein’s work was more like fitting mathematics to a few observational facts like the equivalence of gravity and acceleration, the constancy of the speed of light in inertial systems, etc. Einstein, in turn, predicted gravitational waves, for example.
Not again, Jim. Remember the diagram, that you uploaded here? Where they compared mid-topospheric to surface? This is very characteristic as to the quality of your evidence.
This statement is a defining indicator of your ignorance of uncertainty and it’s propagation.
Every measurement is an ESTIMATE. The average of several measurements made under repeatability conditions provides a stated value that is generally the center of an uncertainty interval.
Averaging different measurements DOES NOT eliminate or even reduce the uncertainty of individual measurements. The averaging process will, at best, cancel part of the uncertainty of the stated value. This is accomplished by calculating the RSS combination of uncertainties. NOTE, the key phrase in RSS is SUM. IOW, uncertainties add.
Anomalies ARE NOT averages. They are a DIFFERENCE of two random variables each of which have uncertainty. Again, the variances of the difference of the means of two random variables add in RSS.
Yet NOAA gives the “accuracy”, actually uncertainty, of ASOS readings as ±1.8°F. Tell how you reconcile an “extremely small error” with ±1.8°F!
You don’t even use the proper term of UNCERTAINTY. This has been an international standard since the first JCGM documents in 1995.
The objective word here is observations. We now have 6 IPCC generated reports. NONE have generated model predictions that matched observation. One would have thought by now tweaking would have gotten the models closer. ROTFLMAO!
This is the hilarious part, when you literally advertise your stupidity.
Yep. And no one claimed that. And this has been explained to you literally 100 times. Not just by me. For the 100th time: The average of measurements is an estimate of the “true average” just as an individual measurement is an estimate of the true value. If Mn is the nth measurement, Mn=Tn+En where Tn is the “true value”, En is the error.
SUM(Mn)/N=SUM(Tn)/N+SUM(En)/N where SUM(Tn)/N is the “true average”. If the measurements are independent, and these usually are (like one reading every hour or something) then SUM(Mn)/N has a distribution that is much narrower than that of the Mn’s. If the distribution of Mn-s are the same, we get the square root law. If not, the formula is more complicated but the reduction is there. Weighting in the averaging (like area based weighting) also works. Actually, you can average averages, just you have to weight them properly.
This is the other part. You somehow can’t understand this simple operation.
Yes. One is an average with an extremely small uncertainty. We usually use a 30 year average. That is a very big number of samples. That has such a small uncertainty that we can readily regard it zero.
Jesus fokkin Christ… It is so hard to debate people who always get lost. If you average 6 independent measurements from the same instrument, then regardless of the original distribution, the resultant distribution is an precise approximation of the normal distribution. The “small error” here was the reference to “precise approximation”, not to the resultant uncertainty. I had to include that because I knew you had problems with this normal thingie.
Yeah, because I didn’t speak about uncertainty but the shape of a distribution. That’s why, you genius.
And you claim this based on evidence like the one where they compared mid-topospheric temperatures to surface temperatures, right?
“The average of measurements is an estimate of the “true average” just as an individual measurement is an estimate of the true value. If Mn is the nth measurement, Mn=Tn+En where Tn is the “true value”, En is the error.”
The average of measurements is only an estimate of the true value if you are measuring the same thing multiple times with the same device under the same conditions. If you are measuring different things using different devices under varying conditions how can you assume the average is a “true value”? Ans: You can’t! The average is a statistical descriptor, it is not a measurement. The average in this case is nothing more than one of multiple descriptors that are required to describe the distribution of measurements. The average by itself is meaningless. For the statistical description to make sense you need *at least* the standard deviation of the the distribution. If the distribution is not Gaussian, which it will never be with temperature, then you really need at least the 5-number statistical description: min, max, median, 1st quartile, 3rd quartile.
What is the “true value” of two boards, one 2″x4″x8′ and 2″x4″x4′? Is the “true value” 2″/4″x6′?
What is the “true value” of a daily Tmax = 70F and Tmiin = 55F?
As Jim has said, it’s pretty obvious you have little experience in the real world with measurements.
Tim, you idiot, not again… I clearly told you the average is an estimate of the true average. I’m interested in the average temperature (areal or temporal average like the average in Hungary or daily average), and I estimate it with the average of measurements. This is a good method ‘cos the expected value is the same, with the added benefit of a much narrower distribution.
It doesn’t matter until you know the uncertainty of the individual measurements. From that point on you can average the measurements and you can transform the uncertainties to get the uncertainty of the average. In practice, you can always assume normal distribution, usually the individual readings are normal themselves (like the ASOS your brother or husband cited the other day, where the per minute readings are averages of six samples taken during the minute).
That’s the uncertainty for all intents and purposes, and that’s part of the characteristic of the measurement instrument.
Again, the readings of the ASOS are themselves averages, taken with the same instrument during a minute, and in this case we can assume them Gaussian with an almost perfect match.
Jim loves bsing.
You love bsing too. I can’t understand how you can’t understand that we don’t know the true value. We assume that the true value is the measurement minus the error where the error is a random variable of known characteristics. Known from the device we use.
Tmax and Tmin are kinda funky. If you knew more about these things, you would know these have a much weirder dependence on the individual measurements than the average.
“ I’m interested in the average temperature (areal or temporal average like the average in Hungary or daily average), and I estimate it with the average of measurements.”
No, what you find is a mid-range value, not an average. On a typical day the daytime temperature is sinusoidal. The nighttime temp is an exponential decay. The “average” value would require integrating the daytime temp profile and integrating the nighttime temp to find each of their averages and then “averaging” those together.
The mid-range value tells you absolutely nothing about the climate. Two different climates can have the same mid-range temperature meaning it is a useless metric for determining climate. Averaging mid-range values tells you nothing about the climate, using the mid-range values to create a ΔT value thus tells you nothing about the climate either. You can’t even tell for sure what is causing the ΔT to change.
“It doesn’t matter until you know the uncertainty of the individual measurements.”
Of course it matters. Here you are using the term “uncertainty” yet you seem to be talking about “error”. They aren’t the same thing.
“In practice, you can always assume normal distribution, usually the individual readings are normal themselves (like the ASOS your brother or husband cited the other day, where the per minute readings are averages of six samples taken during the minute).”
You can’t assume they are normal. The distribution of a sine wave is not a Gaussian. Neither is an exponential decay a Gaussian. Assuming a normal distribution is an illegitimate one made by climate science to make things simpler – whether it works physically or not doesn’t seem to be of much concern.
“That’s the uncertainty for all intents and purposes, and that’s part of the characteristic of the measurement instrument.”
Actually it isn’t. Possolo in TN1900 had to assume the actual measurement uncertainty was 0 in order to use the standard deviation as the uncertainty. That simply doesn’t apply in the real world.
“Again, the readings of the ASOS are themselves averages, taken with the same instrument during a minute, and in this case we can assume them Gaussian with an almost perfect match.”
So what? That doesn’t mean that the reading is accurate. *ALL* measuring devices drift. Even the multiple sensors in a temp measuring station. Averaging several out-of-calibration sensors can’t give you an accurate measure. In addition you can’t assume that the calibration drift is random, many electronic sensors have an asymmetric calibration drift.
“We assume that the true value is the measurement minus the error where the error is a random variable of known characteristics. Known from the device we use.”
Your lack of experience in the real world of metrology is showing again. Error is no longer a concept that is used for measurement. You can’t know the error so you can’t know the true value either. What you have is a measurement reading coupled with an interval laying out the values that can be reasonably assigned to the measurand. The entire purpose for this is to allow someone else making the same kind of measurement of the same kind of thing under the same conditions to judge if their measurement is the same as the previous one.
Measurement “error” for an electronic device is seldom random. It is typically asymmetric. Electronic components don’t generally drift back and forth around an average value, their calibration will drift and stay there. Most components heat when being used and that heat usually causes the same direction of drift in similar devices.
“Tmax and Tmin are kinda funky. If you knew more about these things, you would know these have a much weirder dependence on the individual measurements than the average.”
You missed the entire point. Does the average value of an 8′ board and a 6′ board even exist physically? If it doesn’t exist physically then it can’t be a measurand. It’s the same for the “average” daily temperature.
While it’s irrelevant what you call it, this is actually called the average in science, and (maybe surprisingly…) it is obtained by averaging.
Well, we can just integrate it over the whole interval, why cut it in half? Okay, I know why, this is your extremely clumsy method of reconstruction. You try to approximate daytime with a sine, nighttime with whatever. Have you heard about “sampling” and “quantization”? And signal reconstruction? Those are the proper way for doing these things. Actually, if the sampling is done densely enough (the criteria is in the books), even simply averaging the samples will give you an extremely close value. And this is what they use in practice.
Well, it does, especially its change over time. And that’s what they watch.
Yep. That’s why they don’t use this for that purpose in science.
No, I was talking about uncertainty. Error is just a random variable with that uncertainty.
I feel a bit of disturbance in the Force here. The sine is not the distribution, it’s the temporal pattern. What you would get a certain time instance if you could measure the “true value”. The distribution, that is usually very gaussian-like is something that is parallel to the temperature axis and has its highest point where the sine is at that moment. There must be a big mess in your head…
Again, that mess in your head. I doesn’t mean it’s accurate, and I didn’t mean to convey that impression at all. It means it’s gaussian. And this thing has nothing to do with drift. A freshly calibrated and continously recalibrated instrument will show a gaussian distribution.
I have never said we know the error. We know the characteristics of the error, this is what calibration is all about. Could you please understand this without the obligatory bsing about terminology?
Again, this is messy… It’s almost irrelevant that a 7′ board can exist physically. Because the average is not about that. It doesn’t have to exist physically to be useful. It can even be impossible to exist physically and useful at the same time. In a grid layout you can only move in four directions. Nevertheless, your average movement direction can be arbitrary, furthermore, you can approximate it quite closely.
You make the same mistake that most alarmists do, these ARE NOT SAMPLES, they are MEASUREMENTS of the same measurand under the non-ideal conditions. The entire population of Tmax (or Tmin) in a month is observed. There are not more or less of each Tmax/Tmin in a month. Therefore, you have a population.
It is not an average. It is the mean of a random variable that has a distribution. It is not merely finding the average of a bunch of numbers.
The GUM has the following:
Let’s move on to the variance of a random variable containing temperature measurements.
σ 2 of the probability distribution of q, is given by
mean q̅.
You should know all this if you had bothered to keep up to date on how metrology has changed. I suggest you examine some of these documents available on the internet.
JCGM 100:2008
NIST TN 1900
NIST TN 1297
NIST Engineering Statistical Handbook
http://www.isobudgets.com
various university lab instruction sites
7 Sources of Uncertainty in Measurement – isobudgets
I referred to digitization and signal processing, signal reconstruction, etc. That’s why the terminology. I’m sure you learnt about these in where ever you learnt, this is standard EE stuff.
You’re kinda obsessed with Tmax and Tmin, but in the modern world you have regular digital readings, and they use those. Tmax and Tmin are obtained from these measurements, these are not primary values any longer, that was the artifact of lig min-max thermometers. I thought you understood this at last but I underestimated your stupidity.
Yes, they use those regularly taken measurements, and average them.
“While it’s irrelevant what you call it, this is actually called the average in science, and (maybe surprisingly…) it is obtained by averaging.”
It’s not even worthwhile discussing this further with you. The average of a sine wave is *NOT* (maximum value + minimum value)/2. The average of an exponential decay is *NOT* (maximum value + minimum value)/2″ Until you understand this you will never understand metrology.
I was sure you would give it up.
It’s fantastic that you are clearly dumber than Jim, and he set a very low level. You obviously didn’t get anything about this discussion. The average is fcukin never (max+min)/2. In the modern world we obtain regular readings (this is all done digitally). We have this and this number of samples per period, taken at regular intervals. Actually, sampling has been regularized w/r/t the time of the day. Those are the measurements we average.
“You obviously didn’t get anything about this discussion. The average is fcukin never (max+min)/2.”
Of course it is. That is the base value used in climate science FOR EVERYTHING. The daily Tmax plus the daily Tmin and then divided by 2.
It is supposedly a metric for determining climate but it is a piss poor metric indeed because you can’t distinguish different climates with the metric.
This is the method that used to be used for calculating degree-day values for all kinds of things. But agricultural science and HVAC engineering recognized the fallacy in doing this decades ago, beginning in the 80’s, and have moved to integrating the entire temperature curve instead. BUT NOT CLIMATE SCIENCE!
Climate science could have 40 years worth of integrative degree-day data today for use in determining climate and climate change. That data could even be run in parallel with the old methodology to see if there were any difference. But climate science refuses.
Remember, the average is only a meaning statistical descriptor if you have a symmetrical distribution and it must be accompanied by a standard deviation. Temperature is not a Gaussian or symmetrical distribution, not daily, not monthly, and not annually. This means that something like the 5-number statistical description *should* be used for climate analysis. But, again, climate science refuses to do this. Ask yourself why.
No. In the old days we had the lig min-max thermometers. We only had min-max data. Nowadays we have digital thermometers that take samples at standardized times. The min-max is calculated from this.
It’s ironic how sure you are about these things and how vague your knowledge about how it is actually done. You described an extremely amateurish method for signal reconstruction (daily with a sine, nightly with an exponential(?)). Now we are talking about a science that has a playbook written in the 50s the latest. Signal reconstruction is of course not done the way you describe. Anyway…
Yeah. It must be true because you tell us.
For that matter, do you think they delete the data? ‘Cos even if they do in the dumb ways you imagine, they surely have the raw data, ie. samples. And not just them. How about coming up with a corrected temperature record (with aggregates)? Oops, they have tried that and the result is the same. UAH, and in the beginning, Berkeley Earth were supposed to show us how <insert here whatever denier bs>. Well, these are essentially the same as any other temp record.
You’re always making a fool of yourself. You constantly mix up temporal changes with distributions. I translate it to you. Your above sentence is ridiculously wrong. Temperature doesn’t have a distribution. Temperature measurement has one, you idiot. And we don’t measure daily, monthly, annual temperature. We measure at time instances, and the average those samples. These averages have a much much lower deviation.
“It’s ironic how sure you are about these things and how vague your knowledge about how it is actually done. You described an extremely amateurish method for signal reconstruction (daily with a sine, nightly with an exponential(?)).”
What in Pete’s name do *YOU* think they are?
The insolation from the sun *IS* a sine wave based solely on the travel of the sun past a point. It starts off at zero at sunrise and goes to zero at sunset. It is at maximum when straight overhead, i.e. at 90deg. That’s a sine wave to most people.
At night the temperature change starts off high with a steep slope and as the night progresses reaches an asymptote. That’s an exponential change to most people.
Neither are perfect curves. But using the sine and exponential as a first approximation is FAR better than using (max + min)/2 as climate science does.
The integral of the sine wave from 0 to pi/2 = 1. Double that to get from pi/2 to pi => 2.
Divide by the distance = pi, 2/pi = .6
Do the same for the exponential decay.
You will *not* get (max + min)/2 for the average temperature.
“For that matter, do you think they delete the data?”
As far as I know they do not USE it, assuming they even collect it. For ASOS stations the recorded temperature is rounded to the nearest unit digit in Fahrenheit. That lone will make any recorded temp have an uncertainty!
“they surely have the raw data”
Really? Where is it? And the question is WHY DON’T THEY USE IT, not whether they have it or not! You are deflecting from the true issue!
“Temperature doesn’t have a distribution. Temperature measurement has one, you idiot.”
The only fool here is you. What do you think a temperature measurement is if it isn’t measuring temperature?
“And we don’t measure daily, monthly, annual temperature.”
Duh! Here’s your sign Captain Obvious!
If there is no daily, monthly, or annual temperature then where does the Global Average Temperature come from?
“We measure at time instances, and the average those samples. These averages have a much much lower deviation.”
That doesn’t lessen the measurement uncertainty in any manner whatsoever. Add into the measurement uncertainty the rounding of readings to the units digit in Fahrenheit and then converting that to Celsius in tenths!
You can’t lower measurement uncertainty using averages just like you can’t increase resolution using averages.
Do you really think this is how signal reconstruction is done?
Local temperature is not a direct function of insolation, you idiot. Have you heard of clouds, heat transport, etc.?
That mess in your head… Every measurement has an uncertainty. Asos is doing it like this.
I was reacting to your sentence, that was, in turn, about the temperature during periods. That’s not measurement, nor distribution. Mess in your head, that was it.
How can you misunderstand even the simplest thing. There is no daily, monthly, or annual measurement of temperature. We can approximate daily, monthly or annual with the various respective averages.
“Do you really think this is how signal reconstruction is done?”
Yes. So what?
You didn’t answer the question!
tpg:”What in Pete’s name do *YOU* think they are?”
“Local temperature is not a direct function of insolation, you idiot. Have you heard of clouds, heat transport, etc.?”
Learn to read! I said: “Neither are perfect curves.”
“I was reacting to your sentence, that was, in turn, about the temperature during periods. That’s not measurement, nor distribution. Mess in your head, that was it.”
Again, the temperature curve is made up of TEMPERATURE MEASUREMENTS. Unless, of course, you are in climate science where the temperatures are just made up – period.
“How can you misunderstand even the simplest thing. There is no daily, monthly, or annual measurement of temperature. We can approximate daily, monthly or annual with the various respective averages.”
Now you are arguing what I’ve been saying for years. An average is not a measurement, it is a statistical descriptor. The GAT is *not* a measurement, it is a statistical descriptor. And the complete statistical description is not complete unless you provide other information, such as the minimum, maximum, median, 1st quartile, and 3rd quartile.
If you don’t believe me that I’ve been saying this for years just ask the poster “bellman”.
Oh, the pearls…
Because it’s not done this way. What you presented is a hilarious piece of amateurism.
We have a very well know (from the 50s) method of reconstructing curves from samples, not a kinda eyeballing what you do.
That’s right. But the temperature curve is not the distribution of the measurement accuracy of temperature. You seem to confuse these two.
No one has claimed that. (Actually, in a sense it is but in this context we can say it isn’t.) We approximate the average temperature with the average of measurements. I can’t understand how you are unable to understand this simple thing.
This is why we use averaging. These things come very easily. E(X)=avg(E(Xi)); variance=sum(Wi^2 VARi); (Wi-s are the weights); The resultant distribution can be approximated very well with gaussian. etc.
“We have a very well know (from the 50s) method of reconstructing curves from samples, not a kinda eyeballing what you do.”
So what? The curve you get from daytime temperatures will be CLOSE to a sine wave. That is a result of the movement of the sun across the earth and the change in insolation. Even on a cloudy day or a rainy day the curve will *still* be close to a sine wave.
Are you *really* going to disagree that the insolation from the sun is, by far, the main driver of daytime temps and assert that its impact is not a sine function?
“That’s right. But the temperature curve is not the distribution of the measurement accuracy of temperature. You seem to confuse these two.”
No confusion on my part. Do you have a clue as to what the statistical distribution is for one half of a sine wave? It’s related to the slope of the curve. And no one is arguing that the temp curve and the measurement accuracy are related. Think of it this way. If there were no measurement uncertainty you could sketch the sine wave using a fine pencil, say a .5mm. Measurement uncertainty smears that line, so you have to sketch it with 5mm Sharpie pen. The measurement uncertainty doesn’t change the shape of the curve but it certainly changes the possible values at any point on the curve.
“We approximate the average temperature with the average of measurements.”
Nope. The average of mid-range temps is *NOT* the average temperature. It is the average mid-range value.
“The resultant distribution can be approximated very well with gaussian. etc.”
And here we see the common climate science meme. EVERYTHING is Gaussian.
The probability function of a sine wave is not Gaussian. It’s as far from as you can get. It is (colloquially) a basket, with high sides at each extreme and zero in the middle. It’s why the average value of a sine wave is .63 and not .5. The curve spends more time at the extremes than in the middle, think of the path of a pendulum. This makes the variance quite high compared to a Gaussian.
(max + min)/2 –> (max/2) + (min/2). That implies an average of a half instead of being close to 2/3.
You simply can’t add basket distributions and come up with a Gaussian. It’s just one more reason that climate “science” is such a farce!
Tim, what you wrote is hilariously wrong. It’s kinda entertaining. You are completely unable to comprehend not even climate science (that’s up to climate scientists) but what I write. Even the simplest things.
How close? 🙂 You know you have to quantify things in science. You have to prove it’s close. Otherwise it’s just bsing.
I didn’t say anything about this, and for that matter, I actually agree.
I even agree to that, it’s a sine.
The thing is that all this doesn’t mean the temperature itself is a sine. Because there are multiple factors that affect temperature, like clouds and convection. It’s a very bad way to reconstruct temperature from the theoretical insolation.
This is hilarious to the extreme. Again, the temporal temperature function has NOTHING to do with measurement accuracy. Let’s assume you measure temperature 12 times during daytime, from 6 am to 5 pm, in Iceland in the summer, and then average the measurements. Let’s assume we are within the range where every measurement has the same uncertainty, say 2C. For ASOS, this range is extremely broad, so this is a reasonable assumption. 2C is also a reasonable overestimation. The uncertainty of the average (not of the individual measurements but of the average) will be 0.58 regardless of whether the temperature was a perfect sine during the day or was something else, like almost flat (actual example). If you take 48 measurements, the uncertainty will be 0.29. If you take samples every minute, it will be 0.075. BTW we only assume independence of measurements here, we don’t even assume they are gaussian. The corresponding formula is independent of distribution. Furthermore, the greater the number of samples, the more the distribution of the average resembles to the gaussian.
No I really hope you understand how the average is taken, and how irrelevant is the shape of the temporal function. (“Temporal” means concerned with time).
The per minute reading of the ASOS is the average of 6 raw measurements taken during the minute. It means it’s almost perfectly gaussian, even if one single raw reading is not. From this point on we have gaussians that are added together with weighting. Do I have to continue?
What a joke.
As in NIST TN 1900:
In this conformity, the shortest 95% coverage interval is
T𝒹 = t̄± ks∕√n = (24.3 ◦C, 31.9 ◦C).
===============================
Now lets do it like Equation 12 in the GUM using the 2C uncertainty.
u𝒸(y) = (y) √{(2/19)²+(2/21)²+2/24)²+(2/29)²+(2/33)²+(2/38)²+(2/36)²+(2/32)²+(2/29)²+(2/26)²+(2/26)²+(2/23)²
u𝒸(y) =
(28.1)√{0.011+0.009+0.007+0.005+0.004+0.003+0.003+0.004+0.005+0.006+0.006+0.008} = (28.1) √0.07 = (28.1)(0.26) = ±7.31
U𝒸(y) = ku𝒸(y) = (2.201)(7.31) = ±16.1
==============================
Now lets do it with CRN uncertainty of 0.3C
u𝒸(y) = (y) √{(0.3/19)²+(0.3/21)²+(0.3/24)²+(0.3/29)²+(0.3/33)²+(0.3/38)²+(0.3/36)²+(0.3/32)²+(0.3/29)²+(0.3/26)²+(0.3/26)²+(0.3/23)²
u𝒸(y) =
(28.1)√{0.00025+0.00020+0.00016+0.00011+0.00008+0.00006+0.00007+0.00009+0.0001+0.0001+0.0001+0.0002} = (28.1) √0.0015 = (28.1)(0.04) = ±1.1
U𝒸(y) = ku𝒸(y) = (2.201)(1.1) = ±2.4
==================================
These are large daily uncertainties and will require propagation into any monthly random variable. i will guarantee, the monthly average reported by ASOS and CRN does not provide an uncertainty figure. That is up to the data user to complete.
Jim, this is spectacularly wrong. All this talk about “metrology”, and you fail at the first example.
No. The variance is 4. This is a value from the data sheet of the measuring instrument. This is why 2/sqrt(12)=0,58 is the standard deviation of the average. This is it.
What you tried here is what’s done during calibration, when you measure the same quantity, and where the differences between values are showing the uncertainty of the measurement. Here we use an already calibrated instrument with known characteristics. When we measure 32 we know how the error looks like already from calibration and we can use that plus information for narrowing the uncertainty of the average.
“Here we use an already calibrated instrument with known characteristics.”
Really? The annual maintenance checklist for CRN stations does *NOT* include calibration of the temperature sensing part of the station. How long do you suppose the CRN stations remain in calibration? Forever?
Again, the standard deviation of the sample means tells you nothing about the accuracy of the mean you calculate from the samples.
If your sample consists of:
m1 +/- u1, m2 +/- u2, …., mn +/- un
and you calculate the mean of that sample what is it?
Is it (m1 + m2 + … + mn)/n?
Or is it (m1 + m2 + … +mn)/n +/- sqrt[ u1^2 + u2^2 + … + un^2 ]?
If it is the second expression then what do you do to calculate the standard deviation of multiple samples? Only use the stated values *the “m” values) or the stated values +/- uncertainty?
*YOU* are dropping the measurement uncertainties associated with each data point.
It’s the common climate science meme that all measurement uncertainty is random, Gaussian, and cancels. An article of faith in climate science. It’s part of the religious dogma of climate science. And it is done with NO proof that such an assumption is valid.
Using your notation it is (m1 + m2 + … +mn)/n +/- sqrt[ u1^2 + u2^2 + … + un^2 ]/n
If all the u-s are the same, you get the familiar +/- u/sqrt(n) for the second part.
Well, you are evidently wrong here, I’ve been talking about the uncertainty of the averages all the fcukin time in this conversation.
“sqrt[ u1^2 + u2^2 + … + un^2 ]/n”
This is either an attempt to evaluate the SEM or to find an average measurement uncertainty. Neither is correct.
The term “uncertainty” is ambiguous. Too many people use it to designate the standard deviation of the sample means as opposed to the accuracy of the mean.
The standard deviation of the sample means is a metric for sampling error, it tells you absolutely nothing about the accuracy of the mean.
The measurement uncertainty of the average is *NOT* the average uncertainty of the elements. If there is no measurement uncertainty then the uncertainty of the average is defined by the variance of the data, which is *not*“sqrt[ u1^2 + u2^2 + … + un^2 ]/n”. If there is measurement uncertainty for the data elements it “smears” the variance of the data set and makes it larger. Thus the average value becomes *more* uncertain, not less uncertain. This is typically handled by propagating the measurement uncertainty of the elements either by adding root-sum-square or by direct addition.
Again, the MEASUREMENT uncertainty of the average becomes the interval which defines the possible reasonable values that can be assigned to it. The possible reasonable values that can be assigned to the average value is the total measurement uncertainty of the data, either based on the variance of the data elements (which add if they are independent, random variables) or by propagation of the measurement uncertainties of the elements making up the data.
If you can’t grasp the concept that the variance of the data is the metric for the uncertainty of the average and not the sampling error then you are in good company since it seems very few people in climate science understand that simple fact.
“Well, you are evidently wrong here, I’ve been talking about the uncertainty of the averages all the fcukin time in this conversation.”
Again, the term “uncertainty of the averages” is about as ambiguious as it gets. Are you speaking of the sampling error associated with calculating the average or the measurement uncertainty of the average?
Answer this: Are the temperature data sets “populations” or are they a “sample”?
I tell you what, why don’t you contact Dr. Possolo at NIST and tell him that the variance of ±4.1°C reported in NIST TN 1900 Example 2 is incorrect. Which means the standard uncertainty reported of ±0.872°C is incorrect also. And, the expanded uncertainty of ±1.8°C is also incorrect.
One of the assumptions for this example is that measurement uncertainty is negligible. With your assertion the variance would basically be far below the temperature readings and the uncertainty would be zero. Funny how they used the variance of the random variable containing the temperature data. They must not have consulted your sources for determining uncertainty of Tmax_monthly.
Tell you what, why don’t you calculate an expanded combined uncertainty for this example using your measurement uncertainty of 2°C for each reading. The combined uncertainty should contain at a minimum, both the measurement uncertainty and uncertainty contributed by the variance of the data.
??? No one assumed this.
For the average, this is true. But that doesn’t affect the uncertainty of individual measurements.
I’m curious. What is the uncertainty of Tmax_monthly if we only know the uncertainty of a measurement? Be careful, this is a tricky question.
“How close? https://s.w.org/images/core/emoji/15.0.3/svg/1f642.svg You know you have to quantify things in science. You have to prove it’s close. Otherwise it’s just bsing.”
A *LOT* closer than assuming a linear slope of 1 (i.e. a triangle curve) so that the average is (max/2)!!
Again, the sun is the MAIN driver of daytime temp. It is the Sun that provides the energy input to drive the temperature. The Sun’s path with respect to a point on the earth generates a SINE WAVE input of insolation. The insolation is zero at sunrise and sunset and a maximum when directly overhead.
This is all just basic calculus and trigonometry. The fact that you can’t refute stands as mute proof that you don’t understand the basics!
“The thing is that all this doesn’t mean the temperature itself is a sine. Because there are multiple factors that affect temperature, like clouds and convection. It’s a very bad way to reconstruct temperature from the theoretical insolation.”
I already told you it is CLOSE to a sine wave. You can’t seem to grasp that. The shape of the temp curve will not change from a sine wave on a cloudy day so clouds don’t affect the shape of the curve, only its amplitude. The same kind of logic applies to convection. Convective heat loss will only change the amplitude of the temperature curve, it won’t change its shape significantly.
Here is a picture of today’s temperature where I am: https://ibb.co/HpMNB0h
Tell me that the daytime temp curve is not very close to a sine wave
‘Again, the temporal temperature function has NOTHING to do with measurement accuracy.”
Never said that it did!
” If you take 48 measurements, the uncertainty will be 0.29.”
You are making the same mistake that so many in climate science make. You can’t increase resolution or decrease measurement uncertainty by averaging. If all you have a measurement values then the uncertainty of the average becomes the standard deviation of the measurements expanded by a coverage factor. See Possolo in TN1900, Example 2 where he had to assume measurement uncertainty was zero in order to use this method. If the measurement uncertainty is not zero then it adds by root-sum-square or by direct addition.
You appear to be taking 2C as the standard deviation of the population and dividing by the square root of the size of the sample. First, 2C is *NOT* the standard deviation of the population therefore the calculation is meaningless. Second, even if the standard deviation of the measurements is 2C all you have done is determine how precisely you have calculated the population average, you have *NOT* determined how accurate that precisely calculated average is.
You are basically applying the common meme in climate science that all measurement uncertainty is random, Gaussian, and cancels. Therefore the standard deviation of the sample means becomes the measurement uncertainty of the average.
THAT ASSUMPTION APPLIES IN ONE CASE AND ONE CASE ONLY. All measurements must be of the same measurand, the measurements must be taken by the same calibrated instrument that has no systematic uncertainty, and the environment must be the same for each measurement.
12 or 48 measurements per day violate the first assumption since you are measuring different things each time and it fails the third restriction because the environment is not the same for each measurement. Since there is no re-calibration of the temperature sensing part of CRN stations during annual maintenance it is quite likely that the second restriction is violated as well.
I learned better than to use the SEM as the measurement uncertainty in my freshman chemistry class and my freshman electronics lab clear back in 1968. Apparently climate scientists, and you, have never learned that lesson!
“BTW we only assume independence of measurements here, we don’t even assume they are gaussian.”
Of course you assume they are Gaussian. The whole idea behind the SEM is that because of the CLT a Gaussian distribution of sample means is generated regardless of the parent data distribution! The SEM is a metric for sampling error, not for the accuracy of the mean.
After calibration, we can assume it is. That’s why we have calibration. From that point on this is just a random variable in the mathematical sense.
This flat out false. You can add random variables from any source, what you get is the sum of them. Furthermore, if you know the variance of each (and you know it from the data sheet of the instrument), the variance of the sum (sum(VARi WEIGHTi^2)) is exact if the variables are independent, and they are independent measurements. This is actually the only requirement, independence, they don’t have to be gaussian.
Again, this is not even a requirement. The only requirement is independence. The variance formula only requires that. Other theorems state that as the number of components increase in an average, the average’s distribution is more and more look like a gaussian. The convergence is pretty fast, even if the original distribution is very much unlike the gaussian. BTW the original distribs. don’t have to be the same. FYI we checked the convergence for some distributions (in uni), for uniform the error was surprisingly low even in the second step.
“After calibration, we can assume it is.”
What calibration? Even CRN stations, the cream of the crop, do not include temperature calibration in the annual maintenance checklist. They don’t get calibrated or replaced until someone notices something way out of whack. Thus you can have a slow calibration drift over a long period of time and it is impossible to separate it out from natural variation.
In other words you simply can’t assume measurement uncertainty away in a field measuring device that is not calibrated before every measurement! You are just using the common climate science meme that all measurement uncertainty is random, Gaussian, and cancels. How that meme ever got started in climate science is just beyond me. It doesn’t exist in any other discipline of physical science that I am aware of
“This flat out false. You can add random variables from any source, what you get is the sum of them. “
What’s your point? Variances ADD. They add because the number of elements far from the mean goes up. That’s no different than how measurement uncertainty is handled!
“This is actually the only requirement, independence, they don’t have to be gaussian.”
The mean and variance (standard deviation) only fully describe Gaussian distributions. We know that daytime temps are far from Gaussian, they are a “basket” distribution with very peaked spikes at the extremes interconnected by a much lower number of values centered on the zero point. The variance of such a distribution is *NOT* described well by mean and variance regardless of the independence of the measurements.
For such skewed distributions a 5-number statistical description is far better, or at least provide the kurtosis and skewness measures coupled with the mean and variance. Either of these methods should rapidly dispel the belief that mean and variance alone are useful statistical descriptors for temperature measurements.
And the sad fact is that in climate science the use of variance is almost totally disregarded – because variance is a metric for the accuracy of the mean. The larger the variance the lower the “hump” around the average meaning it becomes less sure that the calculated value is the actual mean.
“Again, this is not even a requirement. The only requirement is independence.”
Utter and total malarky. This assumption serves no purpose other than to be able to justify ignoring variance and/or measurement uncertainty. You are exhibiting the mindset of a blackboard statistician that has never worked with measurements of the form “stated value +/- measurement uncertainty”. Almost no university statistics textbooks cover how to handle measurement uncertainty. I have collected five different textbooks as proof.
That they always do with each type of instrument.
They discover pretty quickly when something is “way out of whack”. This is part of the “homogenization” and “adjustments” you dismiss out of hand.
BS.
And weights are squared in the formula.
This is hilarious. The temporal graph is not the distribution. The individual measurements have a distribution.
From the ASOS manual.
The point is that if you are not using these two values (which are derived from 5 one-minute averages) then you can not compare them to LIG min/max or even MMTS daily average temperature.
Hey dummy, that is the point being made! HVAC folks are already using integrated values. Why isn’t climate science?
You and I both know the problem is the reluctance to give up “long records” for which you can make trends to scare people with. Asking scientists to move away from traditional ways of doing things is just asking too, too much.
Asking modelers to use more accurate data inputs is verboten also. Their methods developed with mainly min/max temperatures still work just fine don’t they?
And what? They have the sample data, too.
And these are coming from the sample data, this is not something that are independent of them.
Really? Then what’s the point? Because nothing remains for your “point”. The assertion was that they didn’t use full data, only max/min. I pointed out that the temperature records deniers think were “good” were hardly different, furthermore they had never claimed any methodological difference. I translate it to you ‘cos I know you and Tim have problems with understanding these things. So Climate Science (similarly to other disciplines) does use all data it has, not just min/max.
Should they delete that data? 🙂 Anyway, they can use the (min+max)/2 as an approximation of Tavg with a higher error. I’m pretty sure this is a science onto itself.
Why do you like bsing? For that matter, a few of them, like Nick regularly write here and explain how they do things, and they said the opposite.
“ Anyway, they can use the (min+max)/2 as an approximation of Tavg with a higher error. “
You simply can’t read, can you?
(min+max)/2 IS NOT AN AVERAGE. It is a mid-range value. As such it is *not* a useful metric for determining climate. Again, IT IS NOT A USEFUL METRIC FOR CLIMATE.
Two different climates can have exactly the same mid-range temperature value and it is impossible to determine the fact that the climates are different. Therefore anything, such as the GAT, using mid-range values are useless for describing climate.
Climate science has had the data available for calculating a metric that *is* useful in actually distinguishing climate between two locations. And it’s not just the integral of the temperature curve. They have also had pressure, humidity, and temperature data values that could be used to determine ENTHALPY – the true measure for actual climate.
Never claimed, and this is a very good illustration how little you understand from literally anything that is written here.
First of all, they only use what you call “mid-range” when nothing else is available. They use various averages if they have the data. Secondly, most of the time they want to compare climate between two time instances at the same location. In other words, climate change is a more interesting thing here. Again, you have a big mess in your head…
At least you have recognized this…
“Never claimed, and this is a very good illustration how little you understand from literally anything that is written here.”
If it isn’t an average then how can the global temperature be an “average” of averages? Are you claiming the global temp is an average of non-average temperatures? What in Pete’s name does that mean physically?
“First of all, they only use what you call “mid-range” when nothing else is available.”
Malarky! That is *all* they use even today! The integral of temperature over time is a DEGREE-DAY. Climate science doesn’t use degree-days.
“ Secondly, most of the time they want to compare climate between two time instances at the same location.”
So what? You can do that with degree-days! I.e. the integral of the temperature curve over time, e.g. 24 hours.
“In other words, climate change is a more interesting thing here.”
Except the mid-range temp can’t tell you about climate change because different climates can have the same mid-range temperature!
“At least you have recognized this…”
The correct measure of HEAT is enthalpy, not temperature. Apparently climate science, nor you, have recognized this.
It is an average. Of all the samples. Good god, can you at least understand this?
Yep. That’s why we divide it with time. In practice this is just averaging of samples taken during the time period. We get degrees.
Thx for agreeing (except for the “degree-days” thing you are unable to grasp).
??? You’ve just agreed above. Well, it’s not what you call “mid-range” but anyway, you agreed. For that matter, if the average (not the mid-range) is increasing, you can be sure that the climate is warming.
You can use whatever you want. Temperature is a very good measure of heat content for a location. If the average is increasing, the heat content is increasing as well.
“It is an average. Of all the samples. Good god, can you at least understand this?”
It’s an average of what samples? I thought you said averages can’t be measured. It’s an average of mid-range values – which is not a valid metric for climate. If the mid-range values are not a valid metric for climate then how can their averages be a metric for climate?
“Yep. That’s why we divide it with time. In practice this is just averaging of samples taken during the time period. We get degrees.”
Nope. The daytime integral is approximately ∫ A sin(t) dt from t0 to t1, where t0 is sunrise and t1 is sunset. The term Asin(t) is in degrees, i.e. temperature. dt is in time, e.g. a day. You therefore “A sin(t)dt” becomes degree-day, not degree.
Is dimensional analysis not taught any more? It was a big deal when getting my EE degree in the late 60’s/early 70’s.
“Thx for agreeing (except for the “degree-days” thing you are unable to grasp).”
Apparently you didn’t learn calculus at university either.
“Well, it’s not what you call “mid-range” but anyway,”
(min+max)/2 *is* a mid-range value. It is *NOT* an average.
“if the average (not the mid-range) is increasing, you can be sure that the climate is warming.”
Really? What if the change in the average is solely due to the minimum value changing? What if it is due solely due to calibration drift in the measurement stations? What if it is purely natural variation?
“You can use whatever you want. Temperature is a very good measure of heat content for a location. If the average is increasing, the heat content is increasing as well.”
Nope to all. Temperature is *NOT* a good measure of heat content for a location. If it were then the heat content in Las Vegas would be the same as the heat content in Miami for the same temperature. Most people know that isn’t true. The elevation of Las Vegas is about 2500 feet. The elevation of Miami is about 15 feet. Big difference in pressure. The mean humidity in Miami varies from about 70% to 80%. The mean humidity in Las Vegas varies from about 40% to 60%. Big difference in humidity.
Enthalpy of a real gas isn’t changed much by pressure change but there is *some* change. But the enthalpy of moist air depends significantly on humidity.
Did you actually study thermodynamics at university?
Jesus Christ… Samples (ie. measurements) taken during the period we are interested in.
Yep. And then dividing it with the time period, as I said, you get degrees again. With your notation: (1/(t1-t0))∫ A sin(t) dt. In practice simply averaging the measurements (taken at regular intervals) from t0 to t1 gives an extremely good approximation to (1/(t1-t0))∫ A sin(t) dt if some preconditions are met. Please get a grasp on it at last.
Perhaps you should be careful with bsing ‘cos your husband, Jim, always accuses me of being too of a mathematician.
They don’t use (min+max)/2. They use the sum(Mi/N) where Mi is the ith measurement during the period, and N is the number of measurements during the period. No one cares about (min+max)/2.
This is why climate science is a science. They can handle these, and besides, all the measurement equipment is constantly maintained.
Temperature is average heat content per degrees of freedom and molecule. But you’re right, climate science is not looking solely on temperature. They reconstruct and predict climate.
Bsing around won’t get you far.
Which is exactly the problem with climate science.
Exactly what was the calculation prior to ASOS? The only measurements taken and recorded were maximum/minimum.
Do you think those LIG and MMTS records/trends should connect up seamlessly with ASOS/CRN monthly average?
To maintain a “long record” with LIG and digital min/max from NIMBUS it isn’t unreasonable to expect data manipulation is required.
Here is a study by Hubbard and LIn (2004)
http://dx.doi.org/10.1175/1520-0426(2004)021%3C1590:ATCBTM%3E2.0.CO;2
WOW. Kinda messes with homogenization doesn’t it? Do you think the paper makes adjusting LIG and MMTS data to connect with CRN correct? Does homogenizing stations that haven’t been adjusted for insolation and wind speed in the past matter?
What affect does this have on trending LIG, MMTS, and CRN anomalies?
Really? Does water vapor carry heat that is measurable by temperature?
Can you show us how much heat is carried by water vapor versus how much is in other molecules in the air?
Yep, and they approximate the average with (min+max)/2. The error is evidently higher, and they have to use other corrections. This is kinda complicated but the “adjustments” you like to drive yourself into a rage about are partially because of this.
The last time I checked, water vapor consisted of molecules. You know, water molecules.
Yes. Temperature is average heat per molecule and degrees of freedom. We know quite well the number of molecules and the number of water molecules in the air, and we know the degrees of freedom for each. Depending on the approximation we arrive at a slightly different (but still very close) picture. Even if we treat it as an ideal gas we get a very good approximation.
“Temperature is average heat per molecule and degrees of freedom. “
You are showing your lack of knowledge in physical science.
Does the term “adiabatic” mean anything to you?
I think you already know well that you won’t get far with bsing.
Adiabatic means w/o heat exchange (but there can be work). Can you please explain why this is needed for the definition of temperature, and how my definition is wrong. Well, sloppy wording for sure, I should’ve used “kinetic energy” instead of “heat” for temp, but anyway.
Is convection from the surface to altitude in the atmosphere adiabatic?
“Yep. And then dividing it with the time period,”
And for daytime temps you will get about (2/3)Tmax and *NOT* (1/2)Tmax!
“Please get a grasp on it at last.”
I have a grasp. Apparently you don’t. Climate science starts off wrong and that carries all the way thorugh!
“They don’t use (min+max)/2. They use the sum(Mi/N) where Mi is the ith measurement during the period, and N is the number of measurements during the period. No one cares about (min+max)/2.”
Try again.
climate.gov: “For instance, a station’s daily average (mean) temperature is calculated by averaging the minimum and maximum temperatures for the day: daily average = (minimum + maximum) / 2. “
https://journals.ametsoc.org/view/journals/atot/30/7/jtech-d-12-00195_1.xml:
“Daily maximum temperatures (tmax) and minimum temperatures (tmin) were extracted from GHCN-Daily for 2041 U.S. stations. The data values in GHCN-Daily have undergone extensive quality control as described by Durre et al. 2010, resulting in some values that are flagged as erroneous. Each station has at least 25 nonflagged values available for each Julian day (t), for both tmax and tmin, over the 1981–2010 time period. The raw daily normals y(t) are calculated as the simple arithmetic mean of the valid values for each Julian day.”
“This is why climate science is a science. They can handle these, and besides, all the measurement equipment is constantly maintained.”
No, they don’t handle it at all! Systematic uncertainties can’t be handled because they are unknown. Climate science just assumes that all measurement uncertainty is random, Gaussian, and cancels. Therefore it doesn’t need to be handled. That means that any biases due to instrument calibration drift or microclimate drift can’t be identified and since they are ignored they become part of the signal. A part of the signal that can’t be eliminated later.
The metrology tomes by Taylor and Bevington both state specifically in no uncertain terms that systematic biases cannot be identified and eliminated using statistical methods.
“They reconstruct and predict climate.”
Based on temperatures that are inaccurate and unable to distinguish differences in climate.
They calculate this value but this is not the average. This is sloppy wording, I think, and bear in mind that this is just an introductory article. I have reached out to a climate scientist, I’ve asked him about these things, so we will know soon.
This article is not about methodology, it’s about this very indicator. They don’t claim this is the average.
Interestingly, using anomalies actually nulls a full class of systematic uncertainties.
Again, they can handle these things, but I have an interesting observation. How do you know that climate is not changing if you – in effect – claim that we can’t know even the aggregate values? You can’t even claim this.
The logic is unassailable.
Conclusion: Mid-range values and averages of mid-range values are useless in describing climate.
Conclusion: The use of anomalies to find “climate” change with any accuracy is impossible.
“Again, they can handle these things,”
No, they cannot handle this. You cannot handle systematic uncertainty using statistical analysis.
Taylor, “An Introduction to Error Analysis”, 2nd Edition:
“As noted before, not all types of experimental uncertainty can be assessed by statistical analysis based on repeated measurements. For this reason, uncertainties are classified into two groups: the random uncertainties, which can be treated statistically, and the systematic uncertainties, which cannot.”
Bevington, “Data Reduction and Error Analysis”, 3rd Edition:
“The accuracy of an experiment, as we have defined it, is generally dependent on how well we can control or compensate for systematic errors, errors that will make our results different from the “true” values with reproducible discrepancies. Errors of this type are not easy to detect and not easily studied by statistical analysis. They may result from faulty calibration of equipment or from bias on the part of the observer. They must be estimated from an analysis of the experimental conditions and techniques.”
Calibration drift can be from the measuring device itself or from changing microclimate conditions, i.e. differing environments in which the measurement is taken.
Climate science tries to get around this by just assuming that all measurement uncertainty is random, Gaussian, and cancels. It is an unjustified assumption.
“How do you know that climate is not changing if you – in effect – claim that we can’t know even the aggregate values? You can’t even claim this.”
You can’t claim either that the climate is changing or that it is not changing. It’s all part of the GREAT UNKNOWN.
Climate science is no different than the huckster at a local carnival trying to discern your future from a cloudy crystal ball. They make a subjective “guess” that will keep the grant money flowing. If all they had to offer was “we can’t tell what is happening because of measurement uncertainty” all the grant money would dry up. The computer scientists churning out climate models meant to verify the “guess” would be out of business.
In the meanwhile, the climate scientist answered. He said “It’s only a temperature inside a box, and we don’t really care about what it is. What we want to know is how it changes.” Just as I thought.
This is getting ridiculous. If anomalies correlate each other in an extremely large geographical area, during a long time, and they do, that’s surely not calibration drift that affects each instrument differently in different direction and magnitude. This is kinda same with natural variation, that should be something that comes to a zero sum in time and space but it’s not, and it matches well what we know about the absorption properties of CO2 in the atmosphere and the measured radiation characteristics.
This is simply false. Under proper circumstances, some or all of this is true. They don’t just assume this.
Then why do you claim it’s not changing? Why do you claim it’s just natural variation?
The average is no longer considered the “true average”. A “true value” does not exist, only an estimate of what the measurand might be, i.e., why there is uncertainty.
From the GUM.
==================
You can not evaluate a Type A uncertainty with only one measurement. This is where the GUM begins. You need multiple measurements in order to evaluate the type of distribution and what the parameters of stated value and uncertainty should be.
With only one measurement each day of Tmax, you instead must use a Type B uncertainty. That is predetermined or estimated.
Type A uncertainties can have two components, 1) repeatability uncertainty determined under repeatable conditions, and 2) reproducibility uncertainty determined under reproducibility conditions. These are defined in the GUM, B2.15 and B2.16 respectively. NIST defines these in the Engineering Statistical Handbook as follows:
These are all unique uncertainties that will be included in a combined uncertainty. Here is a sample uncertainty budget. You can see both repeatable and reproducibility uncertainties are included as separate items.
Uncertainties are not “transformed”, they are a result of an analysis which uses statistical parameters in order to achieve standard descriptors of the uncertainty of observations of a measurand.
See reproducibility uncertainty above. Both the individual observations (repeatable uncertainty) and reproducibility (reproducibility uncertainty) conditions contribute to a Tmax-monthly_avg.
This is all stuff you should know. Notice how I provide resources to educate you. Everything you assert without sources to confirm is entirely meaningless. You obviously don’t have the metrology training to know any of this, let alone know how to provide appropriate resources.
No longer? NEVER has been, you idiot. I’ve been explaining this to you for days now. The average of measurements is a measurement of the true average. This latter is an abstraction, we don’t know it’s value, but it’s very convenient to describe properties. As soon as you understand this, you’ll be half ready to participate in debates. The other half should be understanding anomalies.
“ Tn is the “true value”, En is the error.”
BTW, you are at least 50 years out of date. No one uses “true value +/- error” any longer. That concept was abandoned long ago by the international community. Today we use “stated value +/- uncertainty”. Error is not uncertainty and uncertainty is not error.
Why don’t you join the rest of us here in the 21st century when it comes to metrology?
I just wanted to show you (without much success…) what the average is measuring. ‘Cos somehow you are unable to grasp it.
Let’s work thru this,
We define a random variable measurand as Tmax.
We define a random variable measurand as Tmax_monthly_avg.
We define a random variable Tmax_baseline_avg.
We define a random value Tanomaly{Tmax_monthly_avg, Tmax_baseline_avg} = Tmax_monthly_avg – Tmax_baseline_avg
The end result is an anomaly of 0.8° ±2.29°C. As you can see, the anomaly inherits the uncertainties of the random variables used to calculate it.
To find a new measurand of various anomalies, such as an annual anomaly, you must declare a new random variable containing the monthly values. The uncertainty of this new random variable will have both the uncertainty of each monthly value in the random variable but also the uncertainty of the sequence. The uncertainty adds each time, becoming larger and larger with each new measurand being calculated.
This is nothing new in metrology. Uncertainties add – always. If you had studied metrology since 1995, you would understand this.
You and other mathematicians want to equate sampling theory to measurement uncertainty. That is incorrect. Multiple measurements ARE not samples of a population, they are the result of influence quantities that change each reading.
JCGM 100:2008 even says:
Some statistical methods are useful in describing distributions and what the STANDARD statistical intervals can be used to describe the uncertainty intervals. However, don’t confuse the differences in purposes for sampling versus measurement uncertainty.
Not again, Jim, this is tiring…
Using the same method as TN 1900, multiple tests indicate an estimate for u_baseline = ±1.0°C as an appropriate value.
What is this variable? How did you get this value? BTW Tmax is not normally used in these calculations ‘cos it has very annoying properties w/r/t uncertainty propagation but anyway, this is supposed to be a 30 year average with a very low uncertainty. You just arbitrarily introduced a very high uncertainty value.
No. For independent measurements, uncertainties are sqrt(sum(u^2)). Which is always <= sum(u). Even you used it this way. BTW the uncertainty of the average is then sqrt(sum(u^2))/N, and if every u is the same, it becomes sqrt(N*u^2/N^2) = u/sqrt(N).
I studied metrology even before 1995.
Tmax_baseline_avg is a random variable that contains the Tmax_monthly_avg measurand’s for each year in the baseline.
T_baseline_avg = {T_monthly_avg₁, T_monthly_avg₂, …, T_monthly_avgₙ}
μ(T_baseline_avg) = (T_monthly_avg₁ + T_monthly_avg₂ + … + T_monthly_avgₙ) / n
σ = √[(1 / n)(Σ₁ⁿ(T_monthly_avgᵢ – μ)²]
These are non-repeatable values because they are not the same measurand, same conditions, etc. They are measurand’s made under reproducibile conditions.
The proper determination for uncertainty of reproducible measurements of a measurand is σ, the standard deviation. This is the interval that defines the range of values that can be attributed to the measurand, Tbaseline_avg.
Now you are revealing your lack of knowledge. You need to show a reference for this assertion that a combined uncertainty is divided by N. TN 1900 certainly does not divide the uncertainty by √22 when they define the expanded experimental standard uncertainty of the mean. Neither do any of examples in the GUM or TN 1297. The documents for ISO certification do not divide the uncertainty by N when calculating a combined uncertainty.
From the GUM (JCGM 100:2008)
Here is the equation for a combined standard uncertainty.
From the GUM 5.1.2
5.1.2 The combined standard uncertainty u𝒸(y) is the positive square root of the combined variance u𝒸²(y), which is given by
You will note there is no divide by “N” in this equation. This equation basically shows adding weighted uncertainties, but no divide by N.
I have not said here that uncertainties add directly. I have always said to use RSS. However, uncertainties can add directly if there is reason to expect that there is no cancelation. When I have said uncertainties always add, that means they are not reduced by subtraction nor by dividing by √n.
I am sure you did, as did I. However it is painfully obvious you have not kept up with the new paradigm of uncertainty where there is no such thing as a true value determined by a measurement and where “error” requires you to know an unknowable true value determined by observing a measurand.
Damn! Willie Mays has just moved on from this vale of tears! Great baseball player and a good man. Rest in peace. 🙏
My condolences to his family and to his fans.
I don’t understand you. Even you think I’m a mathematician and you’re bsing with formulas. If Y=f(X1…XN)=sum(Xi)/N, then the partial diff of Y w/r/t Xi is exactly 1/N. Should I add the now traditional phrase “you idiot” to the sentence?
You actually did, but okay, that was just clumsy wording. You calculated it correctly.
New paradigm… Good God. Do you think statistics changed in the last 30 years? In a field that had been established in the 40s the latest?
Why do you have to bs? Error is a random variable with exactly the same distribution as the measured quantity but centered on zero. If you know the uncertainty, and we can assume we know that from the data sheet of the instrument, then you know the distribution of error. This is it. I can’t tell you how many times I’ve told you we don’t know the true value. It doesn’t mean that we can’t use it as an abstraction in formulas.
“if they clamp energy states, and they show that this doesn’t introduce nonexistent behaviour, in other words, if they calibrate and verify the model, as they always do, then there’s no problem with that, and it’s not “nonphysical”.”
There is no point “calibrating” or “verifying” (*) something that isn’t based on physics as we know it, regardless of whether you’re talking about Newtonian, relativistic, or quantum physics. Adding and subtracting arbitrary amounts of energy at arbitrary intervals is not allowed in any of the physics that we know so far, at least at a macroscopic scale such as planetary weather. This is not a “model”, it is a convenient fiction. It is designed to give the answer that the modellers want. In other words, climate “scientists” use these “models” much as a drunkard uses a lamppost – for support rather than illumination…
(* if by “calibrate” and “verify” you mean “adjust the input parameters until the output looks slightly less ridiculous”)
Well, Physics as we know it is a series of approximations, just as I have already pointed it out to you. A bunch of mathematical theories. One of their most important features is that they approximate with a low error. This is “Physics as we know it”. There’s no “more physical” or “less physical”. If the error is low, it’s physical.
So when an approximation that is calculated with a GCM is “correct” (ie. within a certain error) we can’t say it’s “not based on physics”.
Well, scientists usually distinguish between “input parameters” and “model parameters”, where input is from observations, that they obviously don’t change, and the other parameters are intrinsic to the model and those are the tunable stuff. But for this discussion, I can say that you’re right (apart from your intent to show science ridiculous). FYI Einstein did the exact same thing in his equations where he had to introduce the “cosmological constant” so that his results would show the observed expansion instead of collapse.
The IPCC receives “projections” from a number of GCM’s. AR1 – 6 have all ended up with too hot outputs. Even Gavin Schmidt says this. If you have GCM outputs that have done better, show them. This far you have not shown any GCM outputs to support your assertions. Let’s see some posted.
No, he did not. They were referring to a certain family of models.
Here is a good depiction of how hot AR6 submitted models ran. Even the screened ones are too warm.
So “AR6 submitted”. And AR6 has 50 models, only a subset of them run hot. So this is far cry from “models have always run hot”. The “screened ones” maybe still hot but the difference is much lower. Modelling is evidently in development.
Of course physics is a series of approximations. We can’t measure anything perfectly. But none of those approximations involve adding or removing energy from thin air whenever you feel like it, just to get the output you’re being paid to get. That’s not physics. If you’re going to compare the GCMs’ ongoing “adjustments” to Einstein’s cosmological constant, then you’re going to have to invent a new term for what they’re doing. You could call it the “weather fudging constant”, except it’s not a constant, is it? It’s made up ad-hoc at every time step. That’s not how physics works – except in model fantasy land.
Note that contrary to your implication, I am not attempting to show that science is ridiculous, only that climate models are ridiculous. That’s not the same thing.
It’s not just the measurements. These theories are just approximations themselves. They are just neatly constructed interpretations of observations, not the “physics” itself. A good illustration is that we have three very different theories that depict three very different underlying world, and we obviously can’t (and don’t want to) choose.
I don’t know enough about GCMs to judge whether they really do that, and please don’t get upset if I highly doubt your words. One thing I surely learnt here is never take at face value what a denier says. Anyway, even if they really do that, that doesn’t automatically mean it’s wrong. Again, this is all about approximations, and these phenomena may turn up even due to the finite numerical accuracy of computation. Furthermore, if they do that, they certainly don’t do it as they feel like. They do it so that the law of conservation of energy remain satisfied. In a sense they have to do that if the energy balance is compromised.
FYI I had to do similar things in a very different field. Due to problems with numerical accuracy, certain things simply didn’t add up, there was a very small error. We simply randomly distributed the error. It didn’t affect the result in any way.
Most people would prefer a degree or two of warming even without the money.
Your comment … “Models match empirical evidence well” is misleading. First of all, you never defined what empirical evidence; and second of all, no climate model has ever been able to replicate past climate change — and therefore cannot be trusted to produce good forecasts.
If they know what the models give as output…
… they can adjust, in-fill, and fabricate the future data to match. 😉
In that way it is useful…… for “climate science”
I don’t have to define anything. Scientists do that. But apart from that, the various temperature records used even here are the evidence.
This is a constant feature of Denierland, this tiring bsing.
You are INCAPABLE of defining anything.
What temperature records ??
Surely you aren’t pretending the massively tainted surface has even the remotest connection to real climate. !
All you have is mindless BSING.
“But apart from that, the various temperature records used even here are the evidence.”
The temperature records show evidence of a temperature increase since 1979 (UAH satellite). The temperature records provide NO evidence of a cause of the temperature increase.
You are assuming too much.
As if I had claimed that… But I had not. Good illustration why it’s so tiring debating deniers… 🙂 No. I gave temperature records as an example when John asked for empirical evidence for model verification.
So you admit now that there is no evidence of warming by human CO2.
Stop DENYING reality.
Surface temperatures are so incredibly corrupted that they could never be evidence of ANYTHING.
And certainly NOT any sort of model validation ..except perhaps of just how bad the models really are, that even after all the data corruption, they still miss by a proverbial mile.
So, model verification is accomplished by curve fitting the models to the temperature records (not debating the accuracy of those records).
Absent too is the proper application of Nyquist.
No. That’s model calibration. Verification is comparing to other time periods.
Calibrate to FAKE urban data..
The models are destined to give GIGO crap no matter what you do.
You really are clueless. It is not temperature, it is the planetary system constantly trying to balance energy flows.
I was talking about model verification. That’s done by comparing model output to various records, like temperature. You have a particular talent to misunderstand these things…
So you admit that because they are using CRAP mal-adjusted data for their pseudo-calibration…. and “post-adjust” the historic data to fit their models…
… they will end up with totally meaningless GARBAGE as their final “prediction”
Oh, but they can replicate climate change if they are allowed to define a limited time frame.
My pet gold fish can do as well.
The models are tuned to match historical temperature records. So a claim that they are accurate, or predictive, because they match historical temperature records is a circular argument. Extracting “scientific theories” (Bjerknes compensation) out of models is tomfoolery of the highest order. Models do not demonstrate anything, they most certainly do not provide any sort of empirical demonstration, they only produce the output that is desired by their creators. If they don’t produce such output, they are tweaked until they do, or otherwise discarded.
Yep. FYI this is the feature of each and every theory. I would like to remind you to the “cosmological constant” which is a tuning Einstein applied to match his theory (which is a mathematical model) to the observed expansion instead of the calculated collapse.
And they are. ‘Cos their predictions match observations.
This is a good demonstration how ignorant you deniers are. BTW “distance traveled” is an output that is desired by the creator of the (very simple model) of “time traveled times speed”. Models are just very complicated systems of differential equations.
So called “historic” temperature records are so corrupted as to be totally unusable for anything but climate propaganda.
Hence the same applies to all climate models that use them.
A worthless load of GIGO garbage.
Are you really SO DUMB that you think the climate models are even remotely related to basic physics such as distance-speed-time calculations, that are probably the sum total of your knowledge.
“. ‘Cos their predictions match observations.”
That is one of the most ludicrously stupid comments ever made.
The models are totally useless when it comes to predicting anything.
So bad are the models that the scammer have to resort to changing and “adjusting” real data to try to make the models look more real.. and they still keep failing miserably.
This in an excuse without any evidence. Being complicated is proof of nothing.
You can’t even adequately defend the use of differential equations. A numerical solution of a system of differential equations is notoriously inadequate and inexact. “Coupled” nonlinear differential equations, each of which have inadequate and inexact numerical solutions, are even more inexact. THAT IS A FACT.
That is the point from which you need to base your justifications. Otherwise, you are just blowing smoke up everyone’s arse.
The only way to prove inadequate and inexact solutions are usable is through validation. The validations from the beginning of modeling 40 years ago have always failed.
And the results depend greatly on boundary conditions…
Thank you.
??? This is a statement of fact.
Oh, no, I didn’t know that 🙂 BTW the vast majority of engineering problems are like that and solved like that. Inexact for sure, but not inadequate.
I don’t justify anything. Scientists do. In their papers. I just read them. Please address your whining to them.
Exactly. At last. That’s why scientists have validated their models.
“Climate scientists” DO NOT validate their models.
They use manically fabricated and mal-adjusted GISS and other urban temperature junk.
This is the exact opposite of scientific validation.
The vast majority of engineering problems that use numerical solutions require that the solutions be physically tested for validity. From Eznec to spice, circuit design and antenna design has sophisticated modeling software. Guess what, they only provide a starting point.
Would you fly in an airplane designed and built strictly from software only? Those are called experimental aircraft and they have killed a number of people. That is why wind tunnels exist and test pilots get good money. Models only provide a starting point and MUST be validated.
Sure they have. They meet confirmation bias goals but still run hot compared to the real physical world.
And that’s what happens to models too.
I’m glad even you admit that.
Not again, Jim, not again… If you can’t understand that Nature paper you’ll always make a fool of yourself in debates. At least try it, please. At least read the paper. Not just excerpts that look juicy.
Your denials aren’t going to change anything.
Show us a paper issued by the IPCC that admits the use of wrong models and officially retracts them along with publishing new WG documents.
Show us a retracted IPCC Summary for Policymakers that is updated with your “new” model outputs.
Heck, take the bull by the horns and show everyone here what your modified models predicts for the next 70 years. Put your money where your mouth is.
Read the report. They explain what sources they used, what the limitations of those sources were, etc. I won’t do that for you.
There’s nothing to be retracted. They knew the “problem” even before they included that. They knew what these data was good for. Please try to understand how science works.
For that matter, they included new outputs. The whole problem was that they hadn’t had enough time to get higher resolution results ‘cos that would’ve required a lot of running time. All they had was preliminary outputs.
Warming, you genius. Of course. And these are not running hot.
Wow, what an admission! The IPCC KNEW before and issued the incorrect forecasts anyway! What a way to bolster the confidence in science research! What happened to your claims of science self-correcting?
Do you understand why the public has lost confidence in CAGW?
Sure they knew. More propaganda value!
Publish or perish, right? Why would climate scientists submit or allow publication of research results that were incorrect? Your arguments are doing nothing but painting climate scientists as film flam propagandists.
It’s hilarious how you can get even simple things wrong so persistently. From this point on I can just repeat myself. They documented the limitations, and they know how to handle these. For example, this means greater error.
It’s AGW and it’s not up to the public. In science it’s not the public (and for that matter, not some idiots in a blog) who decide.
Wrong. This is a summary report, not a new publication of results. Furthermore, it’s much more than just model results. That’s only a few percent of the publication. Again, you are somehow persistent in not getting things right.
You really need to bone up on chaos theory.
Don’t worry about me 😉
No, you are a total non-entity..
No more to worry about than a yapping chihuahua behind a 2ft fence.
We have zero expectation of you saying anything of any relevance or importance.
Hosiery outlet?
“Well, it’s an emergent phenomenon in models”
oooh– so convincing! /s
Well, it’s Javier who is claiming this (or rather a source he is referencing, https://judithcurry.com/2024/06/11/how-we-know-the-sun-changes-the-climate-iii-theories/#_edn7 and the actual paper is https://journals.ametsoc.org/downloadpdf/view/journals/clim/31/21/jcli-d-18-0058.1.pdf ). So please address your sarcasm to him. BTW this is so characteristic with deniers. They say something and then they get upset when we use their data to show their stupidity.
You still haven’t told us what we “deny” that you can provide solid scientific evidence for.
A seriously pitiful attempt at empty name-calling.
Once again, the as hominem logic fallacy at play.
Well, we can debate about this, but anyway… But how about the first part? The emergent thingie? You seem to be keen on bsing, please entertain me.
Pre-programmed emergent thingies.
Yes you do keep bsing !!
nyolci, while you and I would likely disagree over the cause of climate change, I can appreciate all of your input today as it should be a wake up call for Javier, but knowing him, he won’t change.
Javier has stars in his eyes, he has as much said he’s ready to take on the IPCC with his theory, to which I’ve said he isn’t ready, and today I’m saying he will make a fool of himself & us for trying.
Why? Because of other people like you who will see through his fantasy ideation the way you did.
The very fact that Javier can’t assign a W/m^2 value to anything should be a great big red flag.
Thx for the friendly treatment. A +1 from me.
Exactly. He has what is called a qualitative discussion (I should’ve put the word “model” here…). I find it very likely that the effect he described is existing but very likely it’s not that strong. But for that we need quantification like the W/m2 just as you mentioned.
You obviously are not knowledgeable in thermal engines.
Oh… First chaos theory, then thermal engines… I’m apparently doomed. 😉
Energy is not expressed in W/m^2.
Energy flow is not expressed in W/m^2.
No red flags. Use of W/m^2 in all those oversimplified flat earth energy imbalance graphics is ludicrous. How can energy laterally transferred between 5 km tall columns of air be expressed simply as W/m^2?
Use of W/m^2 avoids having to demonstrate latencies, heat capacities, and a whole bucket full of other parameters. At least NASA in their CERES brochure changed it to percentages.
So, no great big red flag. Had Javier used W/m^2 I would have dismissed his analysis without any time wasted.
It’s not even obvious from most peoples posts that when using W/m^2 that it is understood that is only a constant if measured over a steradian and not an area. It has to do with the inverse square law.
Tim, why are you so keen on making a fool of yourself?
do you even know what a steradian is?
Yes, I do. It doesn’t change the fact that your statement doesn’t make sense. Why do I have to explain that? Steradian is just territory on the unit sphere. W/r/t Earth any x sr is just an area, you genius. One steradian is just 40,589,641 km2. The inverse square law is completely irrelevant here, too. Good god…
Well, for that matter, this is an energy flowish thing if I can come up with a word like that… It’s properly called energy flux. Energy flow would be W, that’s right, but then you have to be very precise with the area. Anyway…
This is an important factor. No one has claimed it’s the only one, you genius. We actually used that as an example. But, for that matter, most of the energy transfer between incoming radiation and earth happens at the surface. This is why it’s always emphasized.
The use of W/m2 is just a useful metric, just like any average we use. That’s all. Actually, this is a result of complicated calculations that involve heat capacities and all the things you seem to be so knowledgeable about (/s).
models…. you mean those that are “tuned” to match historical records?
You do realize, perhaps not, that tuning is a euphemism for curve fitting.
Curve fitting actually decreases accuracy in forecasts and projections.
No. They are calibrated with historical records. And the verified using different intervals. I know it’s hard for you to understand this, and in the grand scheme of things it’s completely irrelevant whether you understand it. But now you are at least corrected. So from now on you should know. If you don’t, well, that will show a big problem with your comprehension.
The presented theory of climate change doesn’t explain what it claims to explain because no effort was made here to communicate in terms of Watts-per-meter-squared like climate scientists do.
Without numerical analysis the ideas repeated here so often are just not science, it’s pseudo-scientific hand-waving propaganda. There has been no calculation of energies involved for any of the many conjectured mechanisms, so there is little value here for the purpose of understanding how climate changes either way, warming or cooling. Thus there is no closure with this theory.
Shining up the word ‘transport’ and calling it the climate control knob just doesn’t cut it.
The IPCC models ignore the increased solar irradiance over the last 100 years and the oceans storing up the heat for around 100 years along with smog reduction which lets more sunlight strike the Earth warming it and a reduction in cloud cover due to a reduction in SO2 which seeds clouds and blocks the Sun’s rays.
Most of the Earth outside of the Tropics is too cold to live in without warm buildings, warm transportation, and warm clothes most of the year.
Plus, the cost is around $200 trillion which works out to about $US3,000 per month for 26 years since about ninety percent of the people around the world can’t afford anything additional and those in the developed world will have to pay more to cover them.
https://www.bloomberg.com/opinion/articles/2023-07-05/-200-trillion-is-needed-to-stop-global-warming-that-s-a-bargain
The IPCC models ignore the increased solar irradiance over the last 100 years
That is your fantasy so can not be ignored == because it never happened.
There goes the data ignoring AGW-cultist again…
Sunspot count nonsense
Voodoo science
Is that the best you can do.?
pitiful.
AR6, WG-I assessment report, section 2.2.1, “Solar and Orbital Forcing”, page 297 :
A copy of Figure 2.2, on the same page in the original PDF file follows.
The IPCC doesn’t “ignore” the changes in (total) solar irradiance (TSI) over the last century (/ “since 1900”), they simply systematically dismiss them as either “irrelevant” or “insignificant”.
I am not sure they accurately report the levels, but that is a different debate.
That they dismiss them is problematic.
They also dismiss the thermal heat released into the atmosphere due to chemical oxidation processes used in steam turbine electricity generation.
There are lots of things they dismiss as insignificant.
1 and can move 1 grain of sand. 1 million ants can move a beach.
The point is, the devil is in the details and if one ignores the details, one can not have certainty in the results.
“Without numerical analysis” is a false crutch, because our complex atmosphere changes in a non-linear manner, both in space and time. Once you invent the equation to do this, you can then have your numerical analysis.
That is utter BS John, it only enables more of the same vacuous thinking.
Thanx for proving my point downvoter!
It is not BS. Numerical solutions are only accurate when they can be validated. For example, why are wind tunnels used at all? The differential equations for air flow have been validated, have they not? Why are physical demonstrations of the solutions needed?
John, you’re talking apples and oranges in a strawman argument.
Since Javier hasn’t modeled whatever it is he’s talking about, there is nothing there to discuss seriously. It is up to the researcher to back up their claims, not use others to do it for you or infer that you did it when you didn’t do it.
Javier has absolutely given no numerical reason to believe the sun caused global warming, so his claims are false speculation at best, even if it is true.
Unsupported science claims call into question the integrity of all his claims.
You are correct, John.
Some of it is being approached through fluid dynamics.
How they handle heat capacity of the many various solids in the land is unknown. Looks like they just do an average based on an average bond albedo.
There is no such thing as climate scientist. There are climatologists.
W/m^2 is bogus. It is the field strength (power) of the solar irradiance.
It is not energy.
The climatologists are hijacked more terms and repurposed them to invalid definitions than I can count.
Power follows the inverse square law. The are of the sphere at the top of the atmosphere is larger than the sphere at the surface. So the W/m^2 value is smaller at the TOA than it is at the surface.
This post is the third of three derived from Javier’s second book elaborating further on his first book, The Winter Gatekeeper hypothesis. I prefer to read his books rather than his necessarily somewhat simplified guest posts.
My conclusion is dunno if he is right, but can find nothing obviously wrong—unlike most else in ‘climate science’.
Some ‘obviously wrongs’:
From the article: “The ozone response to changes in solar activity modifies the temperature and pressure gradients, and this causes the speed of the zonal winds in the stratosphere to change, as we saw earlier. When the activity is high, the gradients become larger and this causes the wind speed to increase, and when the activity is low, the gradients become smaller and the wind speed decreases. In the troposphere, atmospheric waves called planetary waves are generated, and when the wind is weak, they reach the stratosphere and hit the polar vortex, weakening it. But when the wind is strong, they do not manage to enter the stratosphere and the vortex remains strong. Changes in the vortex are transmitted to the troposphere, altering atmospheric circulation and heat transport.”
It sounds like a plausible theory to me.
From the article: “It is indirect, because what changes the climate is not the change in solar energy, but the change in heat transport.”
But isn’t the change in solar energy the cause of the change in heat transport?
“But isn’t the change in solar energy the cause of the change in heat transport?”
Yes it is, but don’t bother trying to change Javier’s mind with the right ideas, as that doesn’t work.
No. Not by itself, not directly.
First, solar energy is electromagnetic and heat is kinetic/thermal.
Heat transport is kinetic/thermal.
Also, the oceans can store up heat for a hundred years or more and solar irradiance has been at its highest level in the past hundred years of any time in the past 400 years
This is the right idea proven by my empirical S-B work, including the warming effect on the Arctic.
Heat capacity versus latency of the oceans is an interesting topic. For the most part, only the surface has been skimmed on this with a lot of plausible and implausible hypotheses proposed.
Certainly there is some data but of varying quality and quantities, but the vastness of the ocean makes a definitive model challenging, especially given the ocean floor topography.
This appears to be nothing more than a rewording of what is standard knowledge within the climate community. Consider for example the recent paper by Ge et at. entitled “The sensitivity of climate and climate change to the efficiency of atmospheric heat transport”. The first paragraph of which
reads:
“Poleward atmospheric heat transport (AHT) moderates spa- tial gradients in Earth’s temperature in both the climatological state and the response to external forcing. In the absence of AHT, the equator-to-pole temperature gradient mandated by local radiative equilibrium is approximately three times larger than that observed (Pierrehumbert 2010). In response to external forcing, changes in AHT generally move energy away from regions of strong forcing/less efficient radiative damping (Feldl and Roe 2013), thereby reducing the spatial gradients in temperature change implied by local radiative considerations alone. Changes in AHT reduce the global- mean temperature response to external forcing—climate sensitivity—by moving energy to regions where energy can efficiently be lost to space (Feldl and Roe 2013; Armour et al. 2019). ”
The entire paper is at:
https://link.springer.com/article/10.1007/s00382-023-07010-3
And it is very unclear what new mechanism is actually being proposed here.
So you now agree that it is all totally natural, and that CO2 has nothing to do with it.
Well Done. !
No. What I am saying is that Dr. Vinós description of how the climate works appears to be nothing more than a different rewording of the standard understanding of the climate. The role that polar heat transport plays is well known and has been discussed multiple times before and also can be well modelled using global climate models.
Now what Dr. Vinós does not show and does not appear able to show is how the polar atmospheric heat transport will change as CO2 levels increases. In contrast Ge et al show that such transport reduces the climate sensitivity. And again that is well known.
You have never shown that CO2 causes warming.
They are using CHIMP5 models, which are unvalidated and based on scientifically unsupportable conjecture.
You can’t do “science” by conjecture.
Science doesn’t work that way… except “climate ” science.
We have. Multiple times. You just don’t understand it.
(You need to work on the concept that just because you don’t understand something doesn’t mean it’s not real.)
No you haven’t…. not once.
Plenty of links to propaganda mantra..
…. but absolutely NOTHING that has any actual scientific evidence in it… and you are too dumb to realise that fact.
Maybe try again….
Or just keep FAILING.
You need to work on the concept of what actual “science” is..
Because so far you are still firmly stuck in your abyss of scientific ignorance.
Don’t try to fix BeNasty
He is:
An El Nino Nutter
An Underseas Volcano Nutter
There is No AGW Nutter
There’s no Greenhouse Nutter
CO2 is 95% Natural Nutter
He is a five time Nutter
A lost cause.
A total embarrassment for conservatives that leftists cheer on so they can say conservatives are science deniers.
That’s “You Can’t Prove It” BeNasty
And RG licks the feet of the 2nd most stupid AGW-CULTIST on the internet…
DUMB and DUMBER. !
Birds of a feather .. etc etc..
Still no evidence of CO2 warming, hey RG? Waiting, waiting, waiting…
Still in denial that the natural flux of CO2 is 95% of total
Still heats his water by breathing CO2 on it from above.
Still can’t show how CO2 stops convection, like a greenhouse does.
Still can’t show any La Nina effect in the atmosphere, and is totally blind to the huge spikes and step change at every strong El Nino.
Still no actual science to back up anything he says.. he is just like fungal…
He is a total embarrassment to the far-left AGW-cultists that he chooses to represent.
So far, as I read all the essays and comments here- along with many other items in other media, my conclusion is- nobody is proving anything in “climate science” one way or the other. Lots of claims, little proof- which is why climate science is taking its first baby steps- hardly sufficient to force drastic changes in our civilization (and by that I mean the modern world of abundant low cost energy).
Exactly! +100
Of course those drastic changes- with the necessity being the “climate emergency” are really about political revolution not obtainable by any other means. It’s very sophisticated- so much so, that even here in Wokeachusetts, which considers itself the smart place on the planet, almost everyone buys into the cult- until a solar or wind farm or industrial battery system is planned for their ‘hood. That’s happening here now, especially in the western part of the state- which didn’t mind when solar farms were popping up like mushrooms in the far poorer central part of the state. I complained to the enviros back then and there weren’t listening. Now they say we don’t need solar “farms” on farms or forests- only on parking lots and on all roofs- as if that were actually feasible or would amount to much, even ignoring cost. A former state official said that a few years ago and got fired because he said it. He said even if we covered every building in the state and built hundreds of wind turbines at sea, it wouldn’t come close to current power needs, never mind future power needs after we arrive at net zero nirvana.
““You Can’t Prove It””
Which you have shown many, many, many times !!
You cannot produce one single thing that you say I “deny”, that you are capable of producing solid scientific evidence for.
Great to see you now using AGW-cultist/scammer terminology now…. exposing what you really are.
You can come out of the AGW closet..
You don’t need to hide any more.
Izaak, thank you for speaking the truth about this, it’s getting tedious dealing with this constant barrage of false hopium.
Bob Weber joins RG and fungal and izzydumb etc in the ranks of AGW-zealots.
So sad.
You can stop trolling me right now because you’ve misjudged me, and
maybe you could have better understood Izaak’s comment.
I have always opposed the AGW idea and have authored several works since 2018 that clearly show that the sun controls the climate via irradiance/insolation, not CO2, and that CO2 is controlled by the ocean outgassing/sinking in addition to man-made emissions.
The false hope is Javier’s storybook ‘science’ devoid of any W/m^2.
“The 70 years of grand solar maximum in that century caused the planet to increase its energy and warm up.”
He also freely used (and misused) without citing my Solar Modern Maximum from 1935-2004 that I discovered and explained here first at this blog back in 2014/15 and published in my 2018 AGU poster.
His conclusion about the 70-year Modern Maximum causing global warming is right out of my 2018 poster, and I showed how, he didn’t.
Energy is in joules.
IPCC used W/m^2 so they did not have to include the different times related to different energy transports. W/m^2 is not energy, it is field strength.
Claiming Javier failed to use a bogus IPCC expression does not, by itself, invalidate the hypothesis.
1 Joule = 1 Watt*second.
I doubt the IPCC used W/m^2 for the reason you gave, moreso to use in radiative climate forcing and energy balance equations.
Your conclusion is false because it is not bogus to use W/m^2.
“I have always opposed the AGW idea and have authored several works since 2018 that clearly show that the sun controls the climate via irradiance/insolation, not CO2, and that CO2 is controlled by the ocean outgassing/sinking in addition to man-made emissions.”
That makes you a science fiction writer
You have a whole blog of science fiction..
You are hardly one to talk. !
One can only laugh at you and your pompous arrogance.
Climate models can not replicate past climate change — unless you can show this.
Conclusion from the Ge et al paper abstract that makes the whole point against Javier’s idea:
It means ‘transport’ (spatial diffusivity) is not an independent variable upon which climate change understanding hinges.
But we already know from experience that this paper will have zero effect on Javier.
Spatial diffusivity is only one specific kind of energy transport.
In fact, a greenhouse by limiting spatial diffusivity is what makes it a greenhouse.
Sparty, spatial diffusivity is very generic, including all transport.
There have been several studies done on the heat engine model of the atmosphere.
The Javier paper seems to include ocean heat transport.
The notion that if “top of the atmosphere fluxes and oceanic heat storage remained relatively stable, the total heat transported through the climate system would also remain constant…” does not contradict the argument in that section of the article. It is obvious how thermodynamic flux must be related to the rate of radiative heating and cooling. If the rate of radiative heating and cooling does not change, then the heat transport also does not change. The maximum rate of entropy production, or the irreversible spatial redistribution of heat, depends strictly on the boundary conditions T hot and T cold.
T hot and T cold are thermal parameters, heat being kinetic energy.
There is a problem with terminology. Radiative heating and cooling crosses over too often with EM radiation. Not intended as a criticism of your post, just an observation on how sometimes it is difficult for people to communicate.
Since EM emissions (not just IR) removes energy from a surface area, that surface area does cool, balanced with upwelling energy from deeper under the surface.
thanks for the input. My aim was to simplify. Strictly speaking in the situation of Earth, the boundary conditions themselves depend on the dynamics. Therein we have the observable difference between thermodynamic surface temperature (Ts) and the radiative temperature (Tr). Dynamics relentlessly depletes this difference. It’s baked in.
In the mean state Tr is fixed strictly to absorption of solar radiation. Tr is the lowest temperature from which work can be derived, and the lowest temperature at which absorbed radiation can be emitted to space. Alternatively, it is radiation export at maximum entropy.
Thermodynamic Ts and radiative Tr are strictly limited by both thermal entropy production (hot/cold) and radiative entropy production (shorter to longer waves).
We can test through empirical radiation budgets, such that surface absorbed solar = 160 and OLR = 240 units. And so the net dynamic transport is simply the difference 80 units. 80 units thermodynamic flux from surface matched by 80 units radiative cooling to space. Without both the radiative heating and radiative cooling, there can be no sustained dynamic transport. Likewise, without dynamic transport the difference Ts and Tr is greater.
Another great article on how the sun drives our climate. Javier is right … most think in linear terms – like the ancient flat earth perspective; but the earth is round – it spins – and the earth/sun interaction is in constant flux — and thus our climate’s highly non-linear personality.
Non-linear, logarithmic, chaotic, time variant….
As I have said before, the changes in meridional transport are a consequence of a change in heat balances and not a cause.
The sun creates imbalances by working on stratospheric ozone which then alters the gradient of tropopause height between equator and poles to force distortions in meridional transport.
Those distortions alter global cloudiness by changing the length of the lines of air mass mixing around the globe which alters global albedo for a net warming or cooling effect.
It is the change in albedo which alters the amount of solar energy able to enter the system, primarily via the oceans.
Without the albedo change the system temperature would not change because the shifts in meridional transport would completely neutralise any thermal effect.
Since I have been promulgating and refining that concept here and elsewhere for nearly 20 years and have mentioned it to the author several times before I do think he should have mentioned it and dealt with the implications for his own hypothesis.
“As I have said before, the changes in meridional transport are a consequence of a change in heat balances and not a cause.”
Very true statement, and without this perspective Javier has simply gleefully run amok anyway.
Good luck with getting him to admit your idea. If you haven’t realized by now, it’s all about Javier.
Excellent article, but there is more to it. It is important to realize that changes in ozone also cause changes in the UV radiation that reaches the surface. Of course, these changes will be most pronounced in the tropics, where UV radiation is strongest. If ozone production decreases during low solar cycles, more UVB radiation (ozone absorbs UVB to a great extent) reaches the troposphere above the equator. UVB can be absorbed by water vapor over the equator, where there is up to 4% of it in the air. after all, clouds are known to absorb UVB, which on a sunny day can be dangerous to humans. As a result, the troposphere over the equator warms up. The result is that the zonal wind weakens. Therefore, a weak El Niño can persist during times of low solar activity, but then the ocean does not accumulate heat below the surface.
The graphic below shows the temperature drop in the upper and lower stratosphere. In the upper stratosphere, ozone is produced by UV at wavelengths shorter than 242 nm, which breaks O2 into individual atoms. Ozone in the lower stratosphere absorbs UVB.
It can be seen that the zonal wind over the equator is weakening and there is little chance for La Niña.

http://www.bom.gov.au/cgi-bin/oceanography/wrap_ocean_analysis.pl?id=IDYOC007&year=2024&month=06
after all, clouds are known to absorb UVB, which on a sunny day can be dangerous to humans.
Or, some types of clouds do not block UV, which can lead to sunburn when the sun intensity isn’t so obvious. Are you proposing absorption of UVB by clouds, thus prevention of UVB reaching humans under the clouds, is a bad thing? Because it prevents production of Vitamin D?
I’m talking about increased UVB radiation, paradoxically during a small number of strong flares on the Sun.
Apparently, 10 minutes of being in full sunlight is enough to stimulate vitamin D. A long stay is a risk of skin cancer.
Of the light that reaches Earth’s surface, infrared radiation makes up 49.4% of while visible light provides 42.3% 9. Ultraviolet radiation makes up just over 8% of the total solar radiation.
About 95 percent UV-B rays are absorbed by ozone in the Earth’s atmosphere.
“The UV region covers the wavelength range 100-400 nm and is divided into three bands:
Short-wavelength UVC is the most damaging type of UV radiation. However, it is completely filtered by the atmosphere and does not reach the earth’s surface
.
Medium-wavelength UVB is very biologically active but cannot penetrate beyond the superficial skin layers. It is responsible for delayed tanning and burning; in addition to these short-term effects it enhances skin ageing and significantly promotes the development of skin cancer. Most solar UVB is filtered by the atmosphere.
The relatively long-wavelength UVA accounts for approximately 95 per cent of the UV radiation reaching the Earth’s surface.”
UVA and visible have by far the most penetration into the ocean’s waters vs IR with very little penetration.
All bands had much higher irradiance during the last 50 or so years.
Stop DENYING the SUN warms the planet… it makes you look incredibly stupid.
“Stop DENYING the SUN warms the planet… it makes you look incredibly stupid.”
The sun accounts for 99.9% of incoming energy.
I never said the sun does not warm the planet.
I said there is no evidence that changes of TOA incoming solar energy since 1975 caused any of the warming after 1975
You twist my posted words for the sole purpose of insulting me. You are a liar, loser and a boozer. The King of Climate Nutters stage 5.
Poor RG , reduced to rancid ad hom tantrums.. yet again
Meanwhile, Summer appears to be on hold, over much of Europe.
Summer Refuses To Appear Over Much Of Europe…Snow Disrupts Tour De Suisse (notrickszone.com)
This shows the importance of pressure over the Arctic Circle and the jet stream.

Summer HAS NOT STARTED
Yes, little child..
.. It is well into June…and summer hasn’t started yet.
Thanks for the confirmation, jackass !
In astronomical terms, the start of summer can be defined very precisely: it begins on the summer solstice, which occurs on June 20 or 21 in the Northern Hemisphere and on December 21 or 22 in the Southern Hemisphere.
One week until Summer
You remain perpetually confused on every subject.
No, on June 20 the sun will reach its highest position over the Tropic of Cancer. After that, the day will begin to shorten.
Tell us whether or not meteorological winter has begun in Australia? Judging by the temperatures I think it has.
The three coldest months on the East coast of Australia are June, July and August. That is WINTER.
The three hottest months are December, January, February (with early March often similar to late November.
… a nice extended Summer 🙂
ROFLMAO.. talk about mis-informed !!
The warmest months are June, July and August.. eg Paris shown below.
Summer is actually 1.5 months either side of the solstice.
That is when the longest days are.
Slight delay as things warm up, so they start summer at the beginning of June.
… . but not this year.
Why are you choosing to be wrong on basically everything , RG..
… or is it just bad luck ??
You define summer based on the weather history of Paris, France?
What are you smoking?
I don’t smoke.. There can be no doubt you are often high on shroooms or something though.
The three warmest months in Europe are June, July and August.. That is their summer.
Anyone can look that up anywhere.. except you.
EVERY capital city in Europe has June, July, August as the warmest three months. ie SUMMER.
Get over yourself, egotistical prat.
Using the solstice as the start of summer is an arbitrary definition.
Solstice is actually the middle of summer…
The middle of the period of days with the longest hours of sunlight.
Richard, you are technically correct. The solstice defines the change of seasons.
However, most people think summer begins when summer like weather occurs.
One has to accommodate both.
Meteorologic summer starts June 1 and ends August 31. It has to do with the Sun angle, not the solstice. https://www.ncei.noaa.gov/news/meteorological-versus-astronomical-seasons
Poor RG seems to be badly mis-informed about many things.
Not really. He did state “In astronomical terms”
Sort of like getting into a debate about which calendar is correct, Julian or Gregorian, or any of the others.
His original comment was “Summer HAS NOT STARTED”.
He never said anything about astronomical terms.
If you want to define summer as June July and august, the claim by BeNasty still makes no sense
His burst of verbal flatulence said, on June 13, 2024:
“Summer appears to be on hold, over much of Europe.”
Less than two weeks into a 13 week summer season, BeNasty is implying that the summer of 2024 is unusual in Europe.
A person with normal intelligence would wait until mid-September 2024 to evaluate the summer weather in Europe. Not that the summer in Europe has to match the summer elsewhere in the N.H.
Summer usually starts in Europe in June…..
June , July August are the hottest months.
Now RG wants to “redefine” what “summer” just to satisfy his bruised ego.
Hilariously… if it weren’t so sad.
“Less than two weeks into a 13 week summer season”
And no sign of summer yet. !
Hint… that means that summer seems to have been delayed. !!!
Thanks for verifying exactly what I said, jackass.
Depends!
Meteorological summer will always begin on 1 June; ending on 31 August.
A lot of fresh snow will fall in the Alps above 3,500 meters.

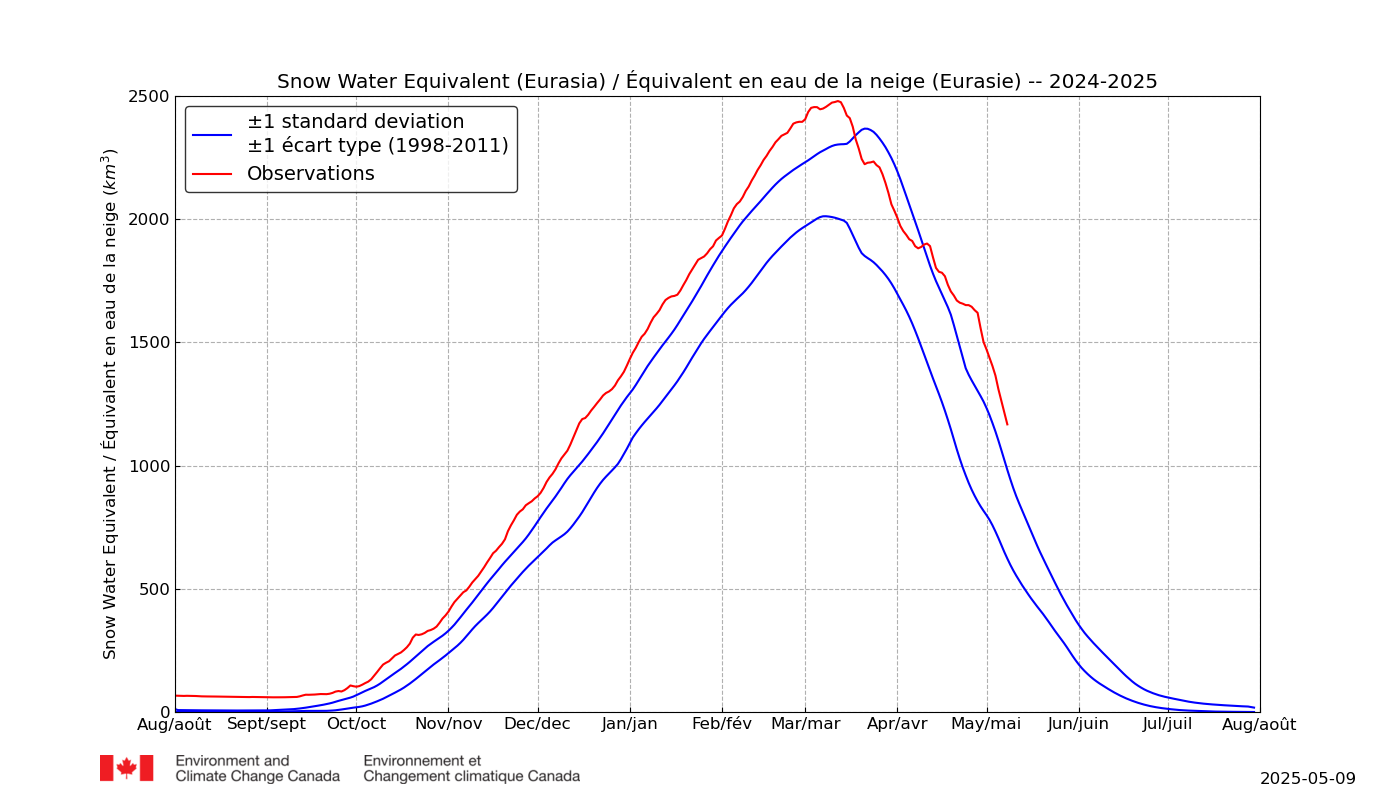
It is clear that the atmosphere in winter loses energy quickly. This is most evident in the southern hemisphere, because in July the Earth is farthest from the Sun in orbit.

It;s the Sun Nutters hang on to their theories like a junkyard dog holds on to a bone
When there were finally accurate measurements of TOA TSI with satellites in the late 1970s, we began to find out that sunspot counts grossly overstated tiny TSI changes
Sunspot counts were incompetent proxies. The old theory of a solar constant was not that far from reality.
But never mind the best data available — the Sun Nutters stick to their sunspot counts
What we really need to know is how much solar energy is being absorbed by Earth’s surface. That could help explain TMAX increases. Changes in air pollution and changes in cloudiness.
The TMIN warming would be better explained by CO2 emissions and any water vapor positive feedback. The feedback estimate is compromised by inaccurate global average absolute humidity data,
There is no evidence the warming since 1975 was caused by the sun emitting more energy toward our atmosphere. Not enough TSI variation to affect the GAT by even 0.1 degrees C.
But the Solar Nutters have theories that will never die or accept new TOA TSI data.
And it would be a miracle if they ever discussed evidence of manmade climate change.
They focus on natural causes of climate change while the IPCC has a focus on manmade causes. Both approaches are junk science, starting with a biased conclusion, distorted by confirmation bias.
TMin can only be measured at surface sites..
The trend comes from URBAN WARMING, not some fantasy CO2 warming and made-up H2O feedback
RG still thinks the SUN doesn’t heat the planet…. only human CO2 can do that.. right !!
Absorbed solar energy continues to increase… a measured fact RG has to ignore to keep his brain-washed AGW-cultism intact.
RG is a SUN denier, and a far-left AGW-cultist who focuses only on junk science.
Javier’s words clearly hit a nerve, prompting a frenzy among these trolls.
He certainly has RG and Weber in a fine froth.
It is hilarious to watch , and nudge them along a bit.
Let them expose themselves as AGW stall-warts.
UHI does not affect the oceans which are 71% of the planet’s surface.
UHI does not affect most rural land weather stations.
UHI does not affect any USCRN weather stations … which have FASTER warmer since 2005 than the nClimDiv US network that is mainly NOT rural weather stations
… and rural USCRN is warming faster than the global average surface and satellite data that include UHI.
A rural weather station can have more warming from nearby economic growth than an urban station. That’s why cherry picking rural stations from a global index can be deceiving. But you prefer to be deceived.
Cloud coverage percentage could have a +/- 10% margin of error.
That percentage is merely a proxy for how much solar energy is blocked by clouds, not a measurement of the actual energy blocked.
I never said the sun does not heat the planet. LIARS AND LOSERS like you make that false claim for the sole purpose of insulting me.
I wrote that the warming after 1975 can not be blamed on more energy being emitted by the sun, based on satellite measurements of TOA TSI
The amount of solar energy reaching earth’s surface seems to be increasing. One reason is less air pollution after 1980. That cause does not explain the majority of warming after 1975, which is TMIN rather than TMAX.
You may now claim that all temperature records are lies, AGW is impossible and then present your own El Ninos are the Climate Control Knob claptrap theory.
Still all the misinformed NONSENSE that we have been over many times before, and RG refuses to learn about.
Why would satellite data include a lot of UHI. urban areas only make up a small part of the land surface.
UHI Land shows very little warming between El Ninos.
Global oceans follow the same pattern , but with about 2/3 the warming
Surely not even RG is stupid enough to claim that human CO2 cause those El Nino warming steps of the oceans.
Delete the El Nino years and the UAH average still increases even with ALL the La Nina cooling events included.
Nick Stokes presented a chart showing that, but you ignored it, because you always ignore inconvenient data, like all Nutters like you do.
UHI increases are a small part of global warming.
El Ninos are not a cause of climate change because over a 30 or more year period, to define climate, the ENTIRE ENSO cycle is temperature neutral.
You just get so excited when an El Nino temporarily spikes of the rising since 1975 temperature trend on an anomaly chart, that you stop thinking. Assuming that you ever started thinking in the first place.
Did your precious El Ninos cause global cooling from 1940 to 1975?
Or were there no El Ninos before 1975?
FAIL.. just a mindless empty rant , pertaining to nothing.
Continued DENIAL of the effect of El Ninos is a deep-seated AGW slat-wart trait.
Now trying to use Nick as a crutch.. that is really very sad.
If you take away the transient and step of the El Ninos, you have NO WARMING AT ALL.
Here is the El Ninos and their effect removed from the UAH data….
Show us all the trend… poor clueless ego-driven muppet.
RG has so little mathematical understanding that he still thinks he can meaningfully compare the trend of local data with a range of 7 C against global trend in data with a range of about 1.5C.. obviously doesn’t understand significance.
UAH Global land actually has a very similar trend to USCRN… again, mostly at El Nino events.
UAH global land up at a +0.20 C. per decade rate since 1979
USCRN up at a +0.34 degrees C. per decade rate since 2005
Those warming rates are NOT similar.
So the idiot now compared different time periods.
How remarkably STUPID of him.
And STILL hasn’t figured out what “reference” stations are for.
… even when used to “adjust urban warming out of the nClimDiv series.
And STILL refuses to admit that the USCRN trend come purely from the 2016 El Nino bulge, even when shown that there was no warming before 2016 and COOLING from 2017-2023.
And still hasn’t figured out that absorbed solar has been increasing inversely with cloud cover even when the data is in front of him.
Denial of data is strong with this one !!
And why the assumption that UHI doesn’t cause warming at rural sites.
They have also undergone large population increases since the 1970s..
I wrote that USCRN rural sites were chosen to avoid UHI
I also wrote that other rural weather stations could be more affected by UHI increases than urban weather stations
I will now add that urban weather stations moved out to suburban airports could have less UHI
Your reading comprehension is weak.
You El Nino climate control knob theory is lame.
So you admit the surface warming is from UHI effects, not CO2
Thanks.. well done.
We see above that USCRN has no warming except at the 2016 El Nino.
We can clearly the increase in all bands of solar energy since mid last century.
RG seems to DENY this will cause warming… D’Oh !!
Now.. do you have ANY scientific evidence at all of warming by atmospheric CO2 ?
Or will you totally avoid posting it and just have a rant.
“We can clearly the increase in all bands of solar energy since mid last century.”
No accurate TOA measurements exist before the late 1970s. TOA TSI has declined slightly since then.
FAIL.. again
Absorbed solar energy in still increasing.
Now.. do you have ANY scientific evidence at all of warming by atmospheric CO2 ?
Duck and weave little child. !!
Ignoring another ad hominem fallacy.
“AGW is impossible”
You haven’t produced any evidence of CO2 warming .. EVER.
AUW exists, and makes up a large part of the surface data.. but is NOT global.
AFW (Anthropogenic fake warming) also exists, in spades, in the surface fabrication.
Show us where AGW exists ??? (with actual evidence)
So far you have… nada… nil… zip… EMPTY. !
Ignoring another ad hominem fallacy.
Please watch the video I posted above. Then come back and tell us where it’s wrong.
“Less developed hypotheses based on solar particles and solar wind have also been proposed.”
I think this is a major contributor, especially with the waning Earth’s magnetic field. The amount of energy being transported to Earth and now interacting with it has gone up substantially over the past decades. 300 years ago a lot of this was deflected.
Maybe someone ought to go back and put some effort into this as it ultimately may be the end of most of us if the poles shift and our climate as we know it will change substantially.
I have seen nothing about a “waning Earth’s magnetic field.” Do you have a link?
I did so a preliminary search on solar particles and interaction of solar and terrestrial magnetic fields and came away empty handed.
A fascinating topic. I wish there were more research on it.
Since direct observations of the strength of the geomagnetic field began in 1840,, it has decreased by ∼ 5% per century
Many dozens of links on Google.
Prof Valentina Zharkova is a superb font of knowledge regarding the Suns effects on earths climate – she say we are already at the start of the next mini ice age and GSM – the cold times are coming
Through my studies I have concluded the probability of new cold times is better than 50-50.
What did you study?
Tea leaves?
What did you study.. lo-end Arts/Humanities.. social studies.??
Not science, that is for sure.
She may be wrong. In Evidence for distinct modes of solar activity, the authors defined a grand solar minimum as 30 or more years of sunspot activity average of 20 (v1 SN), which is 32 v2 SN.
Today the 30-yr v2 SN ave equals 64, twice the GSM level. The next three cycles would have to be very very low for there to be a GSM.
Valentina Zharkova is a crackpot who has been predicting a mini ice age since 2015.
Predictions from her model in 2015 suggest that solar activity will fall by 60 per cent during the 2030s.
She worse than Willie Soon
Two Sunspot Count Nutters
Knows FAR more about climate and solar activity than you are ever capable of knowing.
So what does that make you, except an insignificant little bubble of baseless ego.
You are absolutely right, Zharkova’s predictions are simply wrong when compared to those of Scott McIntosh & alii:
https://www.frontiersin.org/articles/10.3389/fspas.2023.1050523/full
One just needs to look at
and compare this situation to her SC25 predictions.
No, Zharkova predicted that the two waves would cancel each other out in the 26th solar cycle.


For the forthcoming cycles 25 and 26 (Fig. 1) the two waves are found to travel between the hemispheres with decreasing amplitudes and increasing phase shift approaching nearly a half period in cycle 26. This leads, in fact, to a full separation of these waves in cycle 26 into the opposite hemispheres19. This separation reduces any possibility for wave interaction for this cycle that will result in significantly reduced amplitudes of the summary curve and, thus, in the strongly reduced solar activity in cycle 2619, or the next Maunder Minimum9 lasting in 3 cycles 25–27.
https://www.nature.com/articles/srep15689
The strength of the sun’s polar magnetic field on 05.04.2024.
http://wso.stanford.edu/gifs/Polar.gif
http://wso.stanford.edu/gifs/south.gif
http://wso.stanford.edu/gifs/north.gif
Thanks Iren, that was interesting projections!
Why not write an article on WUWT about it?
Thank you Javier for an excellent presentation. It’s very interesting to think about a warmer arctic = cooler temperature where people live. It makes sense to most of us with a science education but must be difficult for the layman to conceive. Nice work on this theory, I believe you have identified some major components of the earth climate system.
Did you ever sit around a campfire on a chilly night?
Your front is warm but your back is chilled. If there’s a cliff or a wall behind you, your back might be warmed but not as much your front. You can turn around but then the opposite becomes true.
But without the campfire, all gets chilled.
We all live on a wonderful planet that revolves and has “naturally adapting” walls behind us.
To ignore the big campfire in the sky and focus on a few tiny cracks in the wall (and nature’s ability to fill them in as it adapts) is foolishness.
In the thread is a long debate about models
This model is better than the Russian INM model
It has curves
It causes warming
This model does it all:
HEY!
Where’d you get a video clip of my wife!
Oh, wait. That’s not her. I guess ‘beauty” really is in the eyes of the beholder.
(If you ever saw her smile, you’d understand my confusion!)
And is FAR more accurate and meaningful and relevant than any “climate model” will ever be.
Richard Greene
Re.: your comment dated June 14, 2024 4:41 am:
https://wattsupwiththat.com/2024/06/13/how-we-know-the-sun-changes-the-climate-iii-theories/#comment-3925555
and the unnecessarily arrogant replies of the opinionated poster nicknamed ‘bnice2000’.
*
Here is a comparison I made out of
We can clearly see the amazing similarity between UCRN, the GHCN stations and UAH LT.
But… nevertheless, here are the trends for Jan 2003 – Dec 2023, in °C / decade:
This clearly confirms what you wrote, namely that the USCRN station set warms faster than the allegedly UHI-infested stations around it.
The reason why USCRN warms faster is visible when you split the series into TMIN vs. TMAX.
Moreover, a dominating influence of the 2016 El Nino is highly questionable: it is on the graph for all three time series just one peak event among other peak (and drop) events.
To avoid any confusion, this is the source of the USCRN time series in the graph above:
https://www.ncei.noaa.gov/pub/data/uscrn/products/hourly02/
GHCN daily:
https://www.ncei.noaa.gov/pub/data/ghcn/daily/
UAH 6.0 LT (column ‘USA48’):
https://www.nsstc.uah.edu/data/msu/v6.0/tlt/uahncdc_lt_6.0.txt
Nice bulge around the 2016 El Nino , isn’t there !!
Zero trend before.. cooling after..
The fact that you think that doesn’t have a major affect the linear trend calculations shows just how little you understand about how they are calculated.
Remembering of course that USCRN is used as a reference to “adjust” the GHCN data fabrication.
Now show evidence of human causation. !
As we can see, removing all 2015/16 peaks makes the bulge less apparent but doesn’t change much:
*
“… hows just how little you understand about how they are calculated. ”
Arrogant remark, ignored.
All trends remain nearly equal: you (intentionally?) overestimate the effect of the 2016 El Nino.
And here we see how you are yourself ignorant and lack real experience.
Not USCRN is used to ‘adjust’ GHCN: exactly the contrary happens, namely that NOAA’s USCRN data published at CaaG is adjusted by using GHCN stations located in the near.
This however you don’t see in my graph because I used the original USCRN hourly data, see the link.
You can post your ag~gressive tones as long as you want: first try to generate the monthly same data as I did out of USCRN and GHCN daily, and then we’ll see further.
You have been searching for an answer for why the Earth’s temperature began deviating from solar influences around 1950. There is an AGW explanation that is not CO2. Civil aviation has been pumping billions of gallons of water vapor in the stratosphere for decades. Plot some graphs of total passengers per year, look at the spike in temperatures from the 1938 – 1945 (Billions of gallons of aviation fuel (water injected into the stratosphere WWII), the climate had never seen before). Dwell time of stratospheric water vapor is sub decade, so the world cooled back down after the 1940’s.
Aviation really began CONSISTENTLY pumping significant water vapor amounts in the 70’s – 80’s, and began gradually increasing thereafter, Aviation activity vs global temps indicate global temperatures correlate with the Covid 19 lock down drop in aviation, 9-11, Sars, Gulf War, 1970’s energy embargo and this most recent CV19 lockdown example in which aviation set a record of burning 95 billion gallons of jet fuel (eq. amt. of water) only to have that nearly halved the year after, (and global temps followed suite). This anthropogenic stratospheric water vapor from aviation has a Northerly increasing global distribution, which also explains the polar amplification phenomena.
Me thinks the stratosphere is not as dry as it would be without jets flying in the stratosphere every second.
What ever happened to the solar eclipse weather project? The one that appeared here with a link to a crowd-sourced weather app, where one would run the app during the total solar eclipse of 2024 in order to provide lots of data on local barometric variations, precisely located by GPS coordinates, and local solar irradiance. I thought it was a great idea, and drove all night to a spot near Indianapolis to watch the eclipse, and collect data through this app. As a result, I have no pictures of the eclipse (which doesn’t matter, because I enjoyed the experience rather than focusing on recording it), but I was really looking forward to the results of this weather study. Now I can’t even find the bookmarks to the original article, and I saved them in more than one place. It ran on WUWT some days before the eclipse, and was well received. But there have been no results that I’ve seen, so I wonder if it was a scam. I hope I didn’t broadcast all of my personal data to someone, somewhere.