By P Gosselin on 14. April 2024
Dr. Michael E. Mann and the IPCC claims of a hockey stick temperature trend are challenged.
A paper published by a team of scientists of the Russian Academy of Sciences led by В. V. Klimenko presents a quantitative reconstruction of the mean annual temperatures of northeastern Europe for the last two millennia. The study was done in cooperation with the Alexander von Humboldt Foundation (Germany).
Result: it was modestly warmer 1000 years ago than it is today.
The reconstruction of the mean annual temperatures is based on dendrochronological, palynological and historical information, and shows the comparative chronology of climatic and historical events over a large region of Northeast Europe:

Figure 1. Map of the study region showing locations for which indirect climatic data are available.
Yellow circles indicate palynological data, green circles indicate dendrochronological data, and black circles indicate the most important historical evidence. Triangles indicate the location of long-row weather stations in and around the study region: Haparanda (1), Vardø (2), Arkhangelsk (3), Kem (4), Petrozavodsk (5), Malye Karmakuly (6), Salekhard (7), Tobolsk (8), Syktyvkar (9), Turukhansk (10), Tomsk (11), Yeniseysk (12). Source: here.
Warmer in the years 981-990 and in mid 20th century
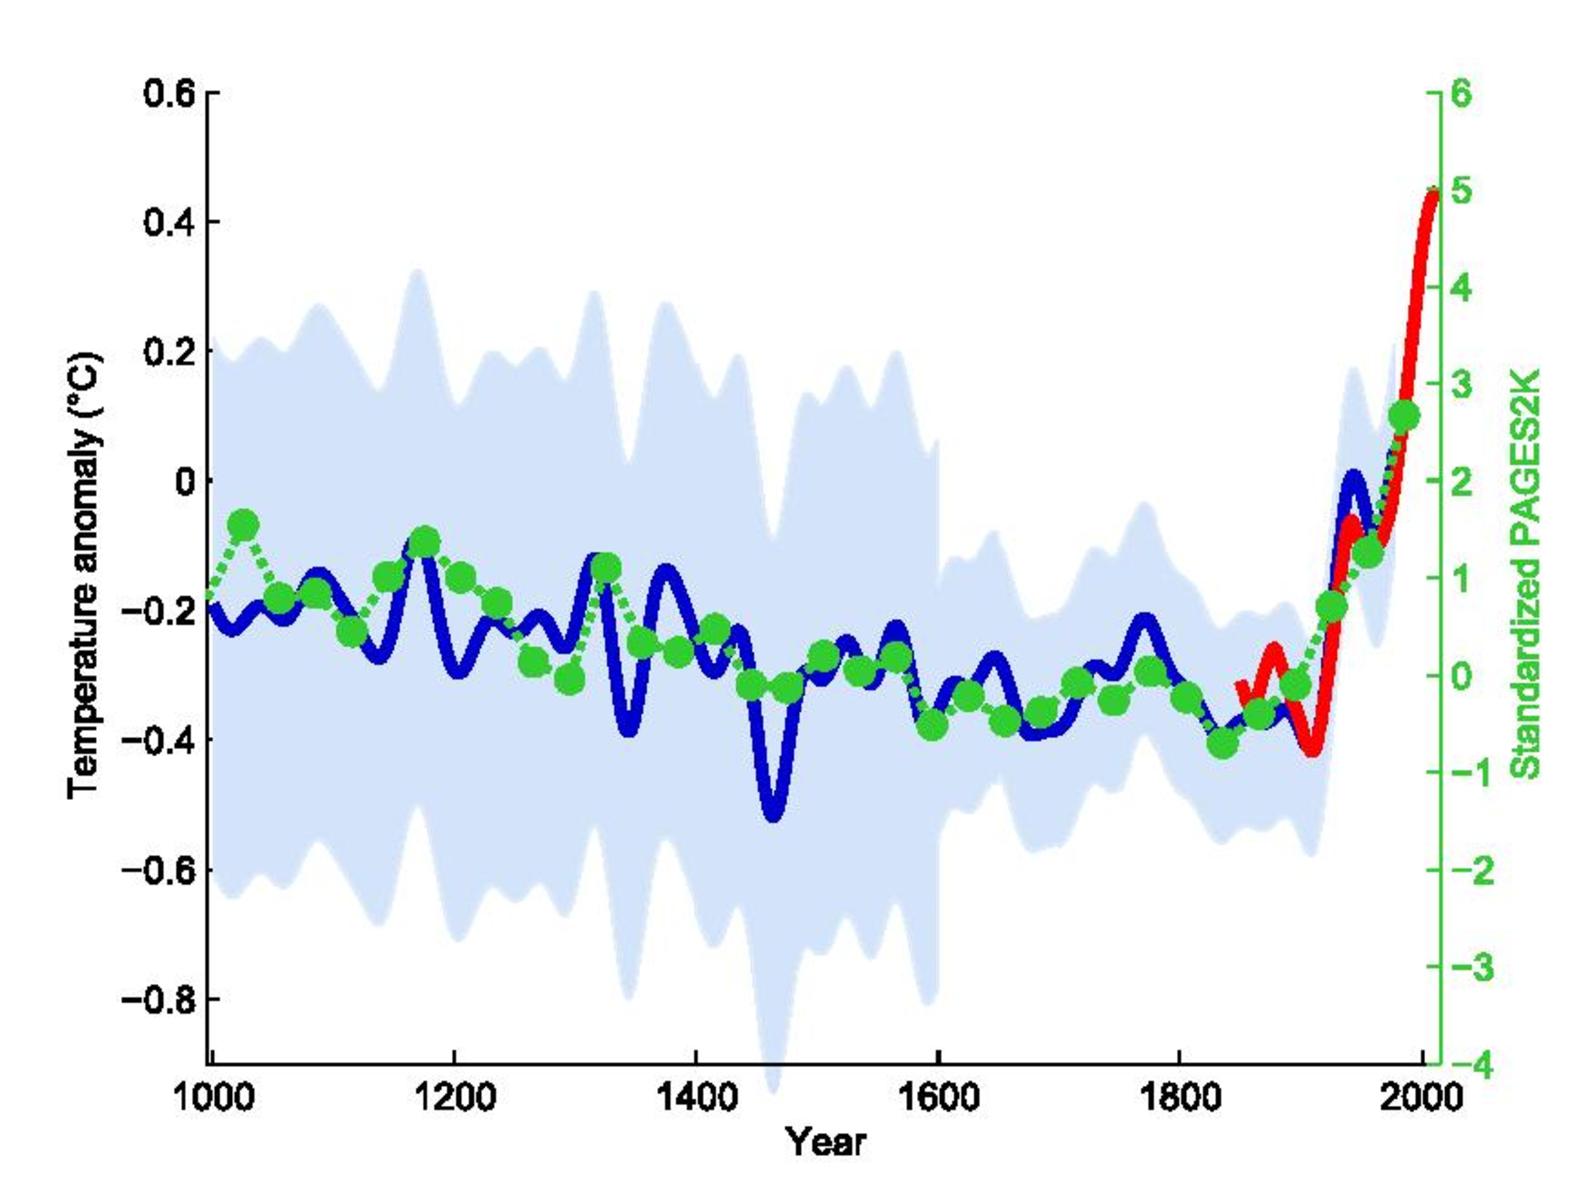
Unlike what papers authored by scientists close to the IPCC like to suggest (a flat temperature mean over the past 1000 years followed by a 20th century hockey stick blade warming),the Russian reconstruction of decadal mean annual temperature values shows major climatic events manifested both on the scale of the entire Northern Hemisphere and in its separate regions.

Figure 4. Final reconstruction of decadal mean annual temperatures for Northeast Europe (blue line)
and instrumental data (red line). The instrumental period is enlarged in the inset. Source: here.
According to the paper’s abstract:
In the pre-industrial era, the maximum annual mean temperatures in 981-990 were 1°C higher and minimum temperatures in 1811-1820 were 1.3°C lower than on average for 1951-1980. The constructed chronology has a noticeably larger amplitude of variability compared to hemispheric and pan-Arctic reconstructions.”
The paper concludes that the results of the reconstruction point to “major climatic events” such as the Roman Optimum, the cold epoch of the Great Migration of Peoples in the 5th and 6th centuries, the Medieval Climatic Optimum of the 10th-12th centuries, and the Little Ice Age (13th-19th centuries).
These were manifested both on the scale of the entire Northern Hemisphere, and its individual regions.
Hat-tip: inderwahrheitliegtdiekraft at X.
A reconstruction that is somewhat more consistent with history. I really doubt it is yet as warm as the Medieval Warm Period, particularly with crops.
Looks similar to the GISP2 ice cores. Why am I not surprised?
“I really doubt it is yet as warm as the Medieval Warm Period”
What “it”? Where was it warmer? Where was it cooler? Again we’re presented with means and averages of something that should not be averaged.
I see your point, but I was considering Greenland and Great Britain, for being warmer than the present in the MWP.
The really obvious in-your-face dendro data don’t seem to be favored by climate scientists. E.g. the 5,000 year old white spruce on the far NW Canadian Arctic coast, still rooted where it grew, now ~100km north of the present day treeline and modern white spruce (same species!!) of this size, yet another couple hundred km further south. This tree grew when it was 6-8°C warmer avg temperature than today. Assuming Arctic Amplification of ~ 2-times, this indicates that global avg T was about 3° higher than today.
Many other tree indicators, more stumps, tree lines, peatmoss (now permafrost etc…)
.. show the MWP was probably quite a bit warmer.
Love that tree stump evidence!
The climate alarmists have no answer for the tree stump data. They just try to pretend it doesn’t exist.
I predict Mikey Mann will remain silent….under the Fifth Amendment.
Based on his court performance, I doubt he even understands the numbers and the stats … but he is probably offended anyway and it could cause him to lose (insert back of envelope guess here) $ of funding
As long as the poor chap doesn’t get “really mean looks” when in a supermarket. What could be worse?
He’d better pray I never catch sight of the swine whilst I’m shopping…
The hockey stick in the header should be shown breaking over a bald head.
Or poking out of somewhere more fundemental.
Is that file safe to download? My McAfee AV program warns against it.
Your keyboard clicks go directly to Putin if you download it….
I’d prefer to whack him on the head.
Mann?
Its all in Russian anyway.
Unless he has the same graft as Trump and the largest share of the money goes to him personally
TDS.
Russian collusion with Trump has been debunked. It was a Hillary Clinton/DNC lie.
The only people taking money from Russians was Hunter Biden.
What graft, unlike Biden, there was no 10% for the big guy.
My McAfee warns me about anything slightly more conservative than Mao Zedong.
Another great Reality Check, but wait…….the data hasn’t been tortured yet.
Inaccurate local proxies are not capable of an accurate Russin average temperature and even less useful to estimate a GAT statistic derived from real time measurements.
The inaccuracies given in the paper are capable of justifying it claims.
Oddly, Russian Birstlecone pines featured prominantly in the hockey stick data. If we deem them innacurate, we must deem the Briffa and Mann hockey stick papers also useless.
See how that works?
Lol. Are you taking your brain nutrients?
No.
Just the p*ss.
Izeavinalaugh?
I am not convinced show me your evidence.
Damn russian nutters are problee cluding wiff the Greek nutter just to irritate the idiot shils.
It is concerning that the “average” temperature has increased continuously since the invention of the thermometer in 1714. The proxies used before that time have larger inherent errors than the claimed reconstructed anomaly, therefore are completely unreliable and only potentially useful as a general trend if 3 or so proxies point the same direction. Assuming the proxy trends align with the temperature records since 1714 is also a very bad idea.
An instrument engineer would be looking really hard at thermometer calibration differences since 1714, manufacturing materials and tolerance differences, data recording differences…..rather than just assuming “the climate must have changed”…..just sayin’…
Seems like a lot of reasons to not have religious like faith in the thermometer numbers.
Or that their spotty distribution around the planet could accurately reflect the average temperature of the planet. The earth suddenly got a lot warmer when the Russians stopped supporting the temperature stations in Siberia. That took out a lot of the lowest temperatures from the equation but not from the planet. The locations of the monitoring stations in parking lots and under air-conditioning exhausts, where they had been in meadows, raised the average temperature also. The “adjustments” in the records of government monitoring always raise the average also. Believers are very subject to being manipulated, duped and used by those seeking power. It is better to rely on knowledge than belief, so you do not aid those intent on destroying your nation. Faith and religion should be an individual thing for each person, not a power play to control the masses IMHO.
The biggest problem with the Siberian temperature numbers was that under the old communist system, the fuel subsidies remote towns and cities got was based on how cold the previous year was.
Lot’s of incentive to fudge the numbers downward.
With the end of the Soviet Union, the subsidies ended, and so did the fudging.
“Or that their spotty distribution around the planet could accurately reflect the average temperature of the planet.”
You’re still not getting it. There is no global temperature.
Or that their spotty distribution around the planet could accurately reflect the average temperature of the planet. The earth suddenly got a lot warmer when the Russians stopped supporting the temperature stations in Siberia. That took out a lot of the lowest temperatures from the equation but not from the planet. The locations of the monitoring stations in parking lots and under air-conditioning exhausts, where they had been in meadows, raised the average temperature also. The “adjustments” in the records of government monitoring always raise the average also. Believers are very subject to being manipulated, duped and used by those seeking power. It is better to rely on knowledge than belief, so you do not aid those intent on destroying your nation. Faith and religion should be an individual thing for each person, not a power play to control the masses IMHO.
Since the invention of the thermometer the earth has been EMERGING from the Little Ice Age and THAT requires it WARM up to become more NORMAL. The definition of Ice Age seems to include the earth having ice caps, so we obviously have a way to go to fully emerge from an Ice Age. That will require some warming.
Also attempting to remove CO2 from the atmosphere is suicidal as it is absolutely REQUIRED for photosynthesis! Photosynthesis is required to feed almost EVERY living thing on earth directly or indirectly!
Photosynthesis – 6CO2 + 6H2O → C6H12O6 + 6O2. This means that the reactants, six carbon dioxide molecules and six water molecules, are converted by light energy captured by chlorophyll (implied by the arrow) into a sugar molecule and six oxygen molecules, the products. The sugar is used by the organism, and the oxygen is released as a by-product. It makes BOTH our food AND breathable O2! Do we really need Zero CO2? Is there anyone out there who knows anything about actual science? Or is everyone Brainwashed with political ‘science’ into BELIEVING (believing is for religion) instead of reasoning & KNOWING (the foundation of science)?
Political science is about the manipulation of the masses. We need to counter manipulation with hard facts and reason. Co2 is chosen to vilify because it is released when we use fossil fuels for energy & controlling all energy use would control aspects of modern human life. That would require a world. Who is advocating this? The same group using the Climate propaganda and other justifications for control and division.
Just a small, inconsequential nit. The Ice age for this planet is the normal. Warmer is more comfortable, more habitable, of course.
There was a US politician who, several years ago, declared what we need to do is get all of the CO2 out of the atmosphere. I spewed coffee and ruined a functional keyboard when I read that claim.
Sort of like another US politician claiming we need to make all cars, roads, and rooftops white.
The ice age cycle we are now in has existed for some millions of years. During the past one million years, the climate has declined ten or twelve times into so called glacial ages (often mislabeled “ice ages” by the MSM) when temperature drops and ice sheets gradually expand from the poles to about 30 degrees north and south latitude. After about 100,000 years temperature quickly rises, ice sheets shrink (but do not disappear) and we enter a warm interregnum such as we are now in. The current interregnum is called the Holocene. Going back a few million years there were many similar cycles each lasting about 40,000 years. Before that, extending back billions of years, to the Earths creation, the normal climate was with no fixed ice at the poles excepting perhaps two “snowball earth” episodes lasting a few million years each.
I recall reading that England had thermometers in use in the mid-1600s. This does not take anything away from the points you make.
Good point. Galileo made “thermometers” but barometric pressure rendered them quite inaccurate until the evacuated mercury bulb design of Daniel Fahrenheit. It took another century to decide what zero and 100 should represent….the Hudson’s Bay company sent thermometers with their fur traders to Canada in the late 1700’s with many of their readings in Canada’s national archives. Apparently, those readings tend to be on the warm side, presumably because they carried the thermometers on their pack horses and didn’t let them sit in the shade long enough before recording a reading.
A bit like using buckets over the side of a ship and using that to measure sea surface temp….replaced by the inlet condenser temp of powered ships, where its interface with hot steam or motor ships cooling system
Mann’s hockeystick: rubbish.
Utterly and completely. Modern Climate ”change”… rubbish.
You’d think a University would know the difference between a regional temperature reconstruction –for Northeastern Europe– and a Global Temperature trend. But apparently they don;t, and neither does WUWT. It’s a rather basic concept.
The hockey stick uses a single tree to cover for the entire world for a 400 year period.
Funny how regional records only count when they show what you want to see.
A magic tree. So special that a monument ought to be built next to it saying, “this tree helped us save the planet”.
Can you provide a source for this?
https://climateaudit.org/2009/09/30/yamal-the-forest-and-the-trees/
More on the Yamal story:
https://climateaudit.org/?s=yamal
Summary:
http://www.bishop-hill.net/blog/2012/5/9/the-yamal-deception.html
P. S. Why is anyone still using trees as temperature proxies?
Tree rings are useful, but one must take into account all factors and publish the ambiguity bands. I have a book somewhere buried in my basement that has the original tree ring data reportedly used to construct the hockey stick. The error bands in the data presentation are significant. Noteworthy is the original data did not erase the what was called then the Medieval Optimum or the Mini-Ice age.
Nothing in those links supports the assertion that MBH98, or indeed any modern global reconstruction, relies on a single tree ring chronology for a 400 year period of the reconstruction, sorry. If I’ve missed something, you’ll be good enough to cite the exact passage.
Do your own research.
I am, I’m asking questions of the people making claims.
Classic play of the cornered. When you got nothing and have been caught lying say “do your own research.” Of course backing up what you say with quality references is what someone who is being honest does, but not always an option here.
He shoots.
He misses by a mile.
Simon, I hadn’t made one comment about this thread before advising Alan to hit the books himself.
So what’s the “lying” you just accused me of?
(Of course, I expect that you’ll provide a “quality reference” with your answer to my question.)
A lie is anything that disagrees with what Simon wants to believe.
He’s a nutter.
Well Mark where is your reference? I’ll wait patiently (and watch Trumps Trial for entertainment while I do) to see if you can come up with a reference for your daft statement? I’m guessing you will revert to diversion.
If , after all this time, you still haven’t learnt about Mannian maleficence and the “One Tree” (series from Yamal).
It can only be because of your deliberate ignorance.
Did you know, for instance, that Mannian fabrication methodology creates a hockey stick shape even with random data ?
We need to be accurate. Mann’s trick was the US Southwest Bristlecone Pines (stripbark). Briffa’s was the one Yamal Larch.
Not that I’m saying you’re wrong or anything (actually I am saying that), but do you have a reference for this claim about a single tree covering for the entire world for 400 years?
Sigh.
No Simon, they don’t mean that one single tree was covering the whole world for 400 years.
How big would such a tree have to be to do that?
What they’re talking about is the visible color- differentiated rings in horizontally sliced tree trunks from selected trees regarded to have been growing during the historic periods of interest to the research.
(Difficult to understand for you I guess. But keep coming here because we’re happy to explain these things to you 🙂 )
I am not the one claiming it was a single tree. If you had bothered to read the whole thread you would see the direct quote from MarkW. But here it is for ya soldier…..
“The hockey stick uses a single tree to cover for the entire world for a 400 year period.”
So best talk to him. The irony is you and I both agree.
Mark said that –
The hockey stick uses a single tree to cover for the entire world for a 400 year period.
You said –
this claim about a single tree covering for the entire world for 400 years
The single context was the hockey stick.
You dropped that off as neatly as Mann dropped off the unsupportive proxies.
Yawn.
That’s we do when we read one of your anti-science clown-like tediously idiotic posts.
You sure struggle to understand a simple explanation on why you didn’t understand.
OMG, your ignorance of Mannian statistics shines through.
Yes, one bunch of trees was selected for special weighting because it provided for the up-spike at the end..
Especially when his “statistical method” produced a hockey stick even with random data.
Briffa’s tree data was very inconvenient.. so he had to fudge his way around it at the end..
And of course, the earlier parts of the hockey stick were confounded by CO2 deficit.
…. you know, that absolutely essential gas for good tree growth.
You’d think you would know the difference between an apostrophe and a semi-colon.
But you don’t.
Are you expecting a Nobel Prize for spotting a typo in a Comment section?
Too bad such grammar police type scrutiny is not applied to the climate models…
You do realize that (a) typos happen and (b) ; and ‘ are adjacent keys.
Apparently the US has the best elections money can buy, and the best politicians who can buy the best Universities who use Political “science” to.decide who teaches “science”. Id a actual (uses Scientific Method honestly)scientist proposes a better supported and more logical observation,they are attacked, not with data & logic, but ad hominum. They often lose their jobs and are unable to practice their professions. That leaves us with “scientists” who parrot political agendas.
There is no such thing as a Global Temperature. The Earth does not have a “temperature”; only specific locations at specific times have that.
Yet the GISS fabrications from 1850-1900 uses numbers from only a small part of the globe.
Even now , it is mostly badly sited urban data… Very regional
I would think even a beetroot would know that.
It is a rather basic concept.
There is data from many areas around the globe showing the MWP was warmer…
Don’t be a CLIMATE CHANGE DENIER. !
A group of archaeologist’s did a high altitude field study in the Beartooth Mtns in MT.
One of the first things they found was tree stumps 500 ft above the present day tree
line.
The scientists are also finding that the high country wasn’t the same as we now see it. Old whitebark pine stumps have been dated to 1,100 to 2,100 years ago in places that are now 500 feet above where trees are growing now, Guenther said.
“These were happy, well-fed whitebark pine,” he said.
https://billingsgazette.com/lifestyles/recreation/archaeologists-uncovering-ancient-peoples-widespread-use-of-mountains/article_b589afe6-194b-58d7-a1b1-7442b8c10220.html
It might have been a bit warmer at that time…
Also true of the treeline in the Alps.
https://www.sciencedirect.com/science/article/pii/S0921818122002466
Why do people like AnalJ and Mrs Beeton try to claim that the MWP and RWP were not global?
Trees growing under glaciers.
Treelines much further up mountains and further North.
Peat forming where it is now frozen in permafrost. 😉
‘I’ll be honest with you Officer Obie, I slipped that envelope (with my name on it) underneath that giant pile of trash’
Not sure why it duplicated
Seems to agree with the original Mann data (only goes back to 1000CE
The devil’s in the details and the devils do not corroborate each other.
Have you posted the correct graph? The Russian data show AD1000 as much warmer that the 20th Century.
He’s FAKED it again !
You misspelt FACTS.
No it doesn’t it shows the peaks about the same (~0.8º). The Mann data shows wider uncertainly around 1000AD than the 20th century.
Steven McIntyre comprehensively trashes PAGES2K
PAGES2K (2017) – South America Revisited « Climate Audit
I like Willis’s comment
Here is Mann’s graph with the tree-ring data (hockey stick blade) removed and and the algorithm re-run.
I see from the graph that “Mike’s Nature trick” was not applied. Good for them.
“it was modestly warmer 1000 years ago than it is today.“
Except the graphs only go up to 2000. How much has the are changed in the last 25 years?
Here’s my graph of the area based on UAH, showing the difference between 1991-2000 and 2011-2020. The whole are has warmed by between 0.2°C and 1.4°C.
I make the mean difference over that area to be 0.75°C.
ROFLMAO.. Nice cherry pick
1990-1995 was pretty much the coldest in UAH NoPol
2011-2022 contains the large transient spike from the 2016 El Nino.
Gotta use those El Ninos while they are there, hey bellboy !!
FAIL !!!
Do you ever actually read the articles here – or do you just come to throw random insults?
I used the 1991 – 2000 period for the comparison because that’s the final decade in this reconstruction – the one being used to compare with the MWP.
As always you want to blame all warming on El Niño’s but ignore the fact that one of the biggest ones happened during the 1991-2000 period you are objecting to as a cherry-picked low point.
You will also be claiming no doubt that there was no warming up top 2015, and a pause since 2015, yet somehow you think it’s cherry picking to look at the 2011 – 2020 period.
Still, only 5 exclamation marks – so at least you haven’t reached peak hysteria yet.
So you admit you deliberately cherry-picked the data.
Silly boy, I had already pointed that out. !
There was no UAH NoPol warming from 2000-just before that transient El Nino.
Go for it El Nino-boy .. they are all you have. !
“So you admit you deliberately cherry-picked the data.”
So sad that bnice2000 realizes this is the only way they can win an argument – by repeatedly lying about what someone has just said, even though anyone can just read my comment.
“There was no UAH NoPol warming from 2000-just before that transient El Nino.”
And talking about cherry-picking.
This article is not about the north pole, it’s specifically about a small section of Northern Russia and Scandinavia. See the map at the top.
Here’s my trend calculations based on UAH grid data for roughly that area. Feel free to do your own work if you disagree.
I make the trend from 2000 to 2015 to be +0.22°C / decade.
Of course the uncertainties are large given the highly variable nature of the region.
Here, by the way is the global picture over this “pause” period. Most of the cooling in the Arctic over this period is coming from Greenland. Much of the rest of the Northern regions were warming, in some case quite quickly.
Look at the cycles.
What the paper appears to be claiming is that at only one location in Russia and only for a period of about 10 years it was warmer than the average global temperature between 1950 and 1980. Which is hardly something to get excited about. The average temperature anomaly in their paper is lower than the current anomaly and furthermore their data only goes up to 2000 missing out on the 2 decades with the highest recorded global temperatures.
would you prefer the authors to lie by truncating the data and splicing on the modern record?
No way!
What sort of crooks would try to pull a deceptive stunt like that?
Mann’s nature trick was a perversion of scientific integrity. By eliminating tree ring data that didn’t match instrumental data he created the illusion of historical climate stability that was not reflected in reality. It made the narrative more persuasive which was good enough for the folks funding climate research.
Funny how the tree ring proxy data connected so cleanly with the satellite data. Should take those odds to Vegas.
The lie abides. The “Nature trick” had nothing to do with eliminating tree ring data, it refers to appending the instrumental record from 1980 onwards, when the last proxies end. It’s always interesting to me just how pervasive these lies become and how uncritically and gullibly the WUWT readership accepts them.
Wasn’t “when the last proxies end”.
It was done because the younger proxies diverged from what the older proxies revealed.
And it was thought to be more supportive of the desired “narrative” if the divergence in the proxies could be “tricked” away by grafting (grifting) on the instrument record data.
Yes, you’ve restated all the elements of the lie quite nicely, but telling a lie well doesn’t make it the truth. The divergence issue is a feature of a tree ring chronology published by Keith Briffa in 1998, it has nothing to do with Mann’s 1998 multiproxy reconstruction. MBH98 had no divergence over the 20th century. But the most recent proxy record in MBH98 ended in 1981, so to bring the reconstruction up to the then present day of 1998 for a figure in his Nature paper, Mann plotted the instrument record alongside his reconstruction. That’s the “Nature Trick” but it has nothing to do with the divergence issue in the latewood density of some tree ring series.
Briffas data does not diverge
It shows the LIA and the 1940’s peak then cooling, very nicely.
You CANNOT use daily mal-adjusted urban-tainted instrumental data added onto lower resolution proxy data.
Mathematical mal-practice…. which of course, you condone.
Indeed, Briffa’s chronology does diverge – the series deviates from the instrumental record around 1960:
The instrumental data shows this pattern as well, and the latewood density series tracks it nicely until around 1960 or so, when it begins to diverge.
Alan, your proficiency as a verbal contortionist is mildly entertaining, but I’m afraid that Kamala has stolen the spotlight on this act.
Find another calling son, before it’s too late.
Alan,
It’s crap and you know it.
You now have ‘proxy’ data running through today. Put it together. See how the ‘proxy data’ correlates with the real data. Is it a reasonable proxy or not? Is the response obvious? Would it be honest, today, to splice record data that shows the ‘proxy’ is really not a proxy?
Why was it reasonable 25 years ago?
We have different proxy records, collected more recently, that run closer through “present day.” But all proxy records terminate at the moment they were collected.
It’s important to understand how proxies are actually converted from whatever quantity has been measured into a temperature (and this only after careful research has shown that the quantity being measured correlates to temperature). Part of the instrumental record will be reserved as a calibration set, and part of the instrumental record will be reserved as a validation set. Both sections of the instrument record must fully overlap the proxy reconstruction. The calibration set is then used to convert the measured quantity into temperature change. The validation portion is then used to verify the “predictive” capability of the calibrated proxy (if the section of the proxy covering the validation period does not correlate with the validation section of the instrumental record, the proxy has failed validation).
So that’s precisely how we know that a reconstructed temperature series is reasonable or not.
When Michael Mann published MBH98, he had a set of proxy records that only extended up to the year 1981. He calibrated and validated those reconstructions using the instrumental data through 1981. But his study was published in 1998, and he wanted to show how global temperature had evolved not just to 1981, but to present day (not as part of his reconstruction, as part of a single data visual in his paper). To do this, he simply plotted the instrumental temperatures through 1998, as a separate line, alongside the plot of the proxy reconstruction, that ended in 1981:
There is nothing, not even the tiniest little bit, objectionable or inappropriate in doing this. Indeed it is literally the single one and only way he could have shown temperatures covering the period 1981-1998. The whole false “controversy” over this decision is an intentional effort to mislead people.
Possible name for a website, if WUWT ever intends to re-name.
It would be far better for a website that won’t allow contrary views.
“There is nothing objectionable …”
In your defense of mann, you are implying that Richard Muller is a liar or an idiot.
“This justification (for splicing) would not survived peer review in any journal that I am willing to publish in.”
“No, that is not acceptable.”
The lecture in which the quote you cite came from does contain many egregious misrepresentations from Muller, I don’t know if he was intentionally trying to deceive his audience or not, but the lecture has nothing to do with Mann’s 1998 reconstruction. Muller is talking about a graphic that scientist Phil Jones made for the cover of a WMO report, in which he wanted to plot several temperature reconstructions, including Mann’s 1998 reconstruction and Briffa’s 1999 tree ring reconstruction.
In one of the hacked climategate emails, Jones emails some of his colleagues and says about his graphic, “I’ve just completed Mike’s Nature trick of adding in the real temps to each series for the last 20 years (ie from 1981 onwards) and from 1961 for Keith’s to hide the decline.” Muller misquotes this email in his lecture (again, intentional or not who can say – it’s not a good look for Muller either way), saying, “A quote came out of the emails, these leaked emails, that said “let’s use Mike’s trick to hide the decline”. That’s the words, “let’s use Mike’s trick to hide the decline”.”
The actual email has a quite obviously different meaning than Muller is claiming. “Mike’s trick” is to plot the instrumental temperatures from 1981 onwards (which Mann does in his Nature paper), but Jones extends this to plotting instrumental temperatures from 1961 in Keith’s reconstruction (the one with a decline) to “hide the decline.” Whether Jones should have plotted the data this way is certainly debatable, but Jones’ plot has nothing to do with Mann’s study, it concerns a cover graphic for a single WMO report (that most of us only know exists because of this incident) Jones made.
I’ll state it here just so the conclusion is quite clear: Mann’s 1998 study ends in 1981 and has no decline, Briffa’s 1999 tree ring study has a decline after 1961, and Jones hid that in his graphic. Muller is telling falsehoods.
So, Muller is a liar.
Got it.
Seems we are running out of honest people on the ‘climate change is big, scary, and we need to do something, anything, everything, about it before it is too late’ side.
I don’t know if Muller was lying or merely ignorant (again, either way, not a good look), but at the time of these comments he was quite a skeptic of mainstream climate science. That’s why he founded Berkeley Earth, to see if the global surface temperature estimates were as bad as the contrarians were claiming (spoiler alert: they weren’t).
But of course, that’s a rabbit trail, you’re trying to pivot the discussion to avoid having to acknowledge your misconceptions. Not a good look for you, either.
You:
“… and only after careful research has shown” correlation.
Without the correlation, mann simply spliced, lied, and hid the non-correlation. His careful research led him to cover up and mislead.
You:
“… and only after careful research has shown” correlation.
Without the correlation, mann simply spliced, lied, and hid the non-correlation. His careful research led him to cover up and mislead.
No, he deliberated truncated data he didn’t like.
No way he could use Briffa’s data as it was…
Well, of course, no one using Briffa’s 1998 series could use the series as-is, because it diverges from the instrumental data post 1960. But MBH98 does not use Briffa’s 1998 series, because both studies were published just a few weeks apart.
Uh no.
The “divergence problem” appeared in tree ring data starting (depending on the type of tree) between 1950 and 1980. The proxies started showing a decline in temperatures when the thermometers were showing the opposite.
The satellite data was cleverly appended to the tree ring data at the point in time they started to show temperature decrease rather than increase. Even a close examination of the graphs would fool most people until the exact thing done was explained.
However, the divergence problem persists to this day. So… if the tree rings go the wrong way for 1/3 of the instrumental record, why would we assume they are accurate for the previous 1000 or 2000 years? Highly unlikley that they were accurate over those time periods, we just don’t have an instrumental record to compare them to.
“ temperatures when the thermometers were showing the opposite.”
Actually, raw temperature data, especially in the NH, showed a DECREASE in temperatures from 1950-1980
Biffa’s tree data matched real temps quite well during that period.. that is why Mickey had to chop it off.
LOL. You own graph shows the exact departure from the instrumental record that Mann was trying to hide.
The raw instrumental record from Arctic regions shows a peak in the 1930/40s, then a significant drop until about 1979. (the new ice age scare)
1979 being the lowest point since at least 1900.
The divergence problem is a real thing, it just isn’t a thing in Mann’s 1998 reconstruction. The lie is to intentionally falsely conflate the two.
it’s not an assumption, the tree ring series showing the divergence issue are consistent with other proxies prior to the 1960s, so the recency of the divergence is confirmed. In fact it is believed to likely be a response to the rapid pace of the modern warming.
WRONG…. Rapid pace of CO2 enrichment. !
Urban warming, which the surface data represents, does not cause isolated trees to grow faster.
“a response to the rapid pace of the modern warming.”
1998 was an El Nino.. then from 2001-2015 , there was no atmospheric warming.. so your conjecture is meaningless and baseless.
Tree rings are a woeful temperature proxy anyway, especially as the atmosphere recovers from CO2 deficit.
And you still haven’t answered my question..
What is in it for you to continue to support the AGW scam.
Can’t be scientific integrity, because you don’t have any.
Payment of some sort ???
How do you explain the drop in temperatures from 1940 to 1980 in Briffa’s data shown by bnice2000 above?
The drop in global temperature in the mid-19th century is a real feature of the temperature history, and is present in the instrumental record as well:
The problem is that the latewood density of high-latitude species of trees stop correlating to global temperature after around 1960 or so.
Once again, you post the laughable GISTEMP Global Temperature series. No such thing as a “global temperature”.
What do you think the series bnice presented represents?
Appending instrumental data onto tree ring data as Mann did is already fraudulent, and discredits the work immediately. Trees are not thermometers.
That is not remotely true. This is another contrarian meme said by people why don’t even know why they’re saying it. Plotting instrumental temperatures alongside a proxy temperature reconstruction is perfectly acceptable. The proxies are calibrated using the instrumental record to begin with.
Really? What is the mathematical relationship between temperatures and tree rings?
I would refer you to the relevant literature, the field of dendroclimatology is quite mature. Here is a nice non-technical article from the NCEI:
https://www.ncei.noaa.gov/news/how-can-tree-rings-teach-us-about-climate#:~:text=Depending%20on%20their%20location%20and,wider%20rings%20for%20warm%20periods.
Where is the mathematical relationship? It doesn’t seem to be in your link.
You’ve asked an ill-posed question, like asking, “what is the mathematical relationship between candy and wrappers?” You have to consider what you mean by tree-rings (width, density, isotopic composition?), tree species, location (regional, global, hemispheric?), temperature (seasonal, annual?) etc. Again, refer to the relevant literature.
And it’s exactly what the authors of the Russian paper, which is the subject of this article, did.
Yes, excellent point. I don’t see anyone up in arms over that.
In other words the uncertainty of the proxy data, any such proxy data, has a higher uncertainty range than the differences trying to be identified. Tree ring proxy data is no different. The measurement uncertainty of the proxy data is in at least the units digit and far more likely in the tens digit. Was the average temp at any point 10deg or 5deg or 15deg?
From all the firewood I have cut about the best you can say from tree rings is the weather in Year X was better for tree growth than in Year Y. Way too many unknowns even today to get much closer than that. How does science know if a growing tree was shaded by a bigger tree 500 years in the past? No video’s back then!
The uncertainty in proxy reconstructions like MBH98 is significant, you can see the uncertainty for that study in figure 5b from the paper:
And the uncertainty increases as you go back in time. That does not preclude us from making comparative statements about the general trends of climate evolution shown in the reconstruction.
And you gleaned that insight just from looking at chopped firewood! Imagine if you did a comprehensive study using carefully cored trees from around the world and developed experimental and analytical methods to establish the relationship between the proxy and climate variable.
I’ve been using the same woodlot for 40 years. And all you can tell from the 40 most recent tree rings is what year the growth was better for *that* specific tree.
Even if you analyze the nutrients in each ring you simply can’t tell WHY the level is as it is. Closer trees may have died lowering the root competition for nutrients. Or closer trees may have sprouted increasing the competition for nutrients. Same for shading.
“That does not preclude us from making comparative statements about the general trends of climate evolution shown in the reconstruction.”
Of course it does! Exactly how did the reconstructed (solid bar) line get determined? An average? An average of what?
Your graph is almost worthless. I can’t even differentiate *where* the 2sigma error lines are from the actual data!
Seems to correlate very well with the Viking habitation of Greenland from 900 to 1400 AD
> minimum temperatures in 1811-1820 were 1.3°C lower than on average for 1951-1980
Tambora! That this reconstruction captured such a transient albeit large event makes me trust their paper more than would normally be justified.
A very interesting temperature proxy was talked about on one of Tom Nelson’s podcasts a few months ago. Chinese tax records from 900 years ago recorded crops growing further to the north than today. Seems to fit the hypothesis here pretty well.
I believe the Chinese left detailed records of the dates on which lakes and rivers froze or melted, as well as crop yields, dates of planting and harvest, etc, etc. Such records demonstrate that the MWP and LIA reached East Asia, and were not limited to Northern Europe, as many Climate Cultists insist.
Weather history is our friend.
Real climate scientists study old written records for hints as to how the climate behaved in the past, and old newspapers have even more information about what the weather and temperatures were like in the past.
No Hockey Sticks in the written records.
Weather history is also the enemy of Climatistas.
Odd that warm spike from around 980 AD, the warm AMO during the Oort solar minimum begins nearer to 1000 AD:
Damn those Russians, always messing it up for those WEF types