Guest Post by Willis Eschenbach
In my meand’ring peregrinations of the multiverse, I came across the following about a bay up near the northernwest corner of California.

The article is full of people hyperventilating about the imaginary effects of a claimed three-foot (one meter) sea level rise in “a few decades”.
Riiight … not happening.
I will admit, however, that their claims of a high rate of sea level rise at Humboldt Bay surprised me. Sea levels along much of the northern west coast of North America are small or negative, because of the geological uplift of the land. I expected Humboldt would be the same. Instead, when I went to the NOAA sea level site I found the following. Eureka in the map below is the city on the shores of Humboldt Bay.

So the article is correct in one regard. Measured sea level is indeed rising fast in Eureka … but curiously, the next two tide stations to the north, Crescent City California and Port Orford Oregon, show falling sea levels.
Say what?
I was surprised because the west coast of North America is constantly being wedged upwards by the Pacific tectonic plate. The Pacific plate is diving downwards under the North American plate as they collide. This forces the entire west coast up vertically over geological time.
And surprisingly, in many areas the rate of uplift of the land is greater than the rate of sea level rise, leading to all the scenic cliffs and mountains you see in photos of the North Coast. As shown on the map above, the two tide gauge stations nearest to Eureka (Humboldt Bay) are Crescent City, CA, where the sea level is dropping, not rising but dropping, at -0.8 mm per year; and Port Orford, Oregon, which is barely negative but still dropping at -0.06 mm per year.
So Humboldt Bay is an anomaly, with a sea level rise of 5.0 mm per year. What’s going on?
Now, in my fortunately misspent youth, I crab-fished commercially one winter out of Humboldt Bay, freezing my fingers breaking up frozen bait for the crab pots at 5 AM on the way out through the entrance shown below. So I have some understanding of the local turf. Humboldt Bay is a type of bay that is unusual on the west coast of the US but is very common on the east coast. It consists of a long narrow bay created by a long thin natural sand barrier offshore from the mainland, in the form of long sandspits and or sand barrier islands parallel to the mainland coast.
Humboldt is formed by two such long sand spits, imaginatively called “North Spit” and … well, you guessed it. The natural opening between them has been artificially extended by a seawall at the end of each spit, as seen below.

Humboldt Bay, Bay Entrance and City Of Eureka, 40.1°N
Humboldt is a fearsome bay for fishermen, because during the year an underwater sand bar forms across the entrance. This means that at certain somewhat unpredictable states of wind and tide, you can get a sudden “sneaker wave” that breaks all the way across the space between the seawalls, closing out the entire entrance with whitewater … ugly.
Or the wind can whip the waves up and it breaks constantly across the entire entrance, and the Coast Guard declares the entrance closed, and if you’re outside, it’s a long way and dangerous way to the nearest harbor. Only the Coast Guard goes in or out then, and it’s not pretty.

(And as a man who has worked on the ocean as a commercial fisherman from Monterrey Bay to the Bering Sea, I must take a moment to thank the women and men of the US Coast Guard for putting their lives on the line and being a commercial fisherman’s best friend in time of danger. You folks have the profound appreciation of every commercial fisherman I know.
… an important digression, but a digression nonetheless … so now we return you to your regularly scheduled programming.)
To keep the Humboldt Bay entrance open, it’s necessary to dredge it out every year. The dredged material is ~ 90% sand, 10% silt.
And that brings up an interesting question—the silt is coming from the rivers that feed Humboldt Bay. But where is the endless supply of sand coming from?
The answer is, a beach on the west coast of the US is more accurately described as a hesitation in a slow river of sand flowing endlessly southwards. All the sand almost anywhere on the coast is constantly being moved south by the combined action of the prevailing currents, the beach waves, and prevailing northwest winds. All of these are incessantly picking up bits of sand and moving them just a bit southward.
You can see the shoreside ocean depths by color in the aerial view above. And you can see that having the two artificial seawalls has impeded the southward flow of water and sand. The shallows extend outwards in a circle around the mouth of the seawalled entrance to Humboldt Bay.

Now, if you were putting a tide gauge, would you put it out on the tip of one or the other of the shifting, moving North and South sand spits … or would you put it over on the mainland side of the bay?
Well, one assumes for valid historical reasons, the tide gauge is actually located at the Coast Guard station at the edge of the Samoa Dunes State Recreation Area on the North Spit, in the location shown both above and below.

But not on shore, of course. On a pier. Or to be more accurate, taking up an entire concrete pier. Per the station home page:
The bench marks are on the Coast Guard Base property. The tide gauge is at the east end of the southern pier of two finger piers directly east of the 3-story Coast Guard station building. Station Description: Instruments are hanging in the loft of the Coast Guard Boat House.
Here’s a photo and an overhead view. Looks like a combination two-boat boathouse and tide gauge station.


Further complications abound. Check out the nautical chart below.

The docks and buildings on the upper right side of the graphic above are the Coast Guard station and the location of the NOAA tide gauge.
In the chart above you can see the effect of the north breakwater on the slow southward-flowing river of sand. On the north side, the sand has filled in the corner between the north breakwater and North Spit. It has extended and grown the beach outwards in that corner, and the shallows now extend to the tip of the breakwater.
Sand on the move.
Next, note the regularly dredged entrance channel shown in white. It extends well into the bay. And it’s dredged right up to the edge of the Coast Guard docks to allow for the docking of large vessels.
So: To review the bidding:
• The NOAA tide gauge is located, not on solid ground, not even on mainland ground, but on an offshore barrier spit made of … sand.
• Its nearest neighbor is the Samoa Dunes State Recreation Area, which like North Spit in general is made entirely of … sand.
• The tide gauge is sitting in a large building on massive heavy concrete piers that extend down into … sand.
• The area just farther into the bay from the tide gauge is dredged annually to remove … the sand.
• The local sand flows and the shape of North Spit have been greatly impacted by the construction of two large offshore breakwaters, and by the annual dredging of the entrance channel.
And with that as prologue, are you surprised that the wildly anomalous sea level record strongly suggests that the North Spit tide gauge is slowly sinking into … sand?
The good news is, other than for the small towns of Fairhaven, Manila, and Samoa which were foolishly built right on North Spit, the Humboldt Bay sea level catastrophe is canceled—sorry, no refunds for those who bought tickets.
Those small towns may or may not be sinking—after all, the spits have been there a long, long time. That means that historically, the sand constantly being removed from the spit by wind and water has been replaced by new sand moved onto the spit by wind and water from the ocean side. So for those towns, likely no immediate threat.
The other good news is, I’m sensing a whiff of desperation from the crowd pushing the “EVERYONE PANIC, IN A DECADE WE’LL BE DEAD” line of patter … after five decades of failed serial doomcasting, seems more folks are starting to wise up.
And the best news? That would the fact that I’m still on the green side of the grass, not the brown side … and at 77 years old I give thanks for that every day.
My best to all, hold your friends and family close, seize the day, life is far too short,
w.
My Usual Ask: When you comment, please quote the exact words you are discussing. Makes things clear.
Sea Level Data: North Spit, Crescent City, Port Orford
PS: Why doesn’t NOAA adjust the data for the land subsidence? I suspect it’s from a lack of data. According to Sonel, the “Co-located GPS” is RedwoodsCCCN2004 … which is way down at the south end of the Bay and not located on either of the spits. It shows subsidence, but only at -0.85 mm/year, clearly less than that of the tide gauge at North Spit.
[UPDATE]: Further research revealed a 1959 US Geological survey entitled “Geology and Ground-Water Features of the Eureka Area Humboldt County, California“. It says that North Spit and South Spit are sand for a long, long way down. It says inter alia (emphasis mine):
On North Spit the dune sand forms an important aquifer. Most wells are sand points driven deep enough to penetrate the fresh-water lens overlying the ocean water. They supply water for domestic, municipal, and industrial purposes.
The dunes are best developed along the North Spit between the entrance to Humboldt Bay and the mouth of the Mad River, where they reach an altitude of more than 70 feet and attain a maximum width of three-fourths of a mile. The dune sand is loose, subangular to subrounded, fairly well sorted, fine to coarse-grained, and gray or brownish gray. The base is not exposed, and no wells are known to penetrate the full thickness of the deposit. Therefore, the thickness is uncertain, but it may be more than 100 feet.
Finally, the fresh-water lens in the dune sand on North and South Spits is recharged almost wholly from deep percolation of rainfall. The topography of the dunes forms natural catchment basins, which provide sufficient water for deep percolation. Discharge from the fresh-water lenses is by pumping and by natural discharge to the Pacific Ocean.
Horrors! A sand spit is eroding! We all gonna die right soon now.
Nice expose, Willis. I see in the same edition of the subject rag, there’s also an article complaining that every US state has two US Senators. Very UnProgressive!
G’Day Frank,
“…every US state has two US Senators.
In the beginning, Senators were ‘appointed’ by the State governments. Their original mandate was to see how a proposed law might affect the interests of their State. The Seventeenth Amendment changed that to an ‘elected’ position, which meant they became responsive to the will of the ‘people’. Not necessarily the same thing.
Actually, living life is the longest thing you will ever do. But that doesn’t mean you should ever ignore littoral drift which happens 24/7.
Nor should we ignore the “literal” drift we are subjected to, 24/7. lol
your sand analysis suggests the measuring device mounted on a sinking foundation is measuring a strictly local to the building itself change in sea level. Thus maybe an unofficial measurement somewhere local would be more accurate. Or they could remove the measuring device from the building and fix it to a sky hook thus removing the sand induced variable. The sand sink rate would be the local rise rate plus the measured sink rate previously noted.
To get a ‘better’ result, they should add a fourth floor to the boat house and dredge right up to the pier several times a month.
Why they may be able to get the pier to sink 10mm/yr if they work at it.
NOAA has updated all its U.S. tide gauge stations data through 2023. The data continued to show no coastal sea level rise acceleration patterns for its hundred of coastal stations. This outcome continues to exist despite flawed propaganda claims by climate alarmists since the 1980s that coastal sea level rise acceleration started 4 decades as falsely portrayed in the phony Democrat Senate hearings in Washington DC. Complete incompetence.
Sea level rise acceleration was a Hansen thing starting in 1988. One of his last papers before retiring had it >1/2 meter by 2050.
“1/2 meter by 2050” 35 years into a 62 year span (1988-2050) that only looks to be off by maybe 300%. For Hansen that’s not bad. Hansen.s not all bad BTW. He doesn’t think much of wind and solar as the cornerstone of energy policy. For the right reasons. He advocates for nuclear power to the great annoyance of green energy “experts”.
Salute!
yeah, the subsidence versus the actual sea level rise issue has always bugged me.
And then there’s actual damage to the existing bays, bayous and marshes from building canals and levees and….
My experience is from South Louisiana, and subsidence is a biggie due to messing with the Mississippi so our hydrostatic pressure is lower than just a hundred years ago(you know a blink of your eye). I personally can see some of my relatives’ home foundations exposed since they were built in the fifties ( I am over 80).
The warmistas do not seem to understand the big picture, and one true influence upon the tidal readings at many places is not global warming, but actual human activity involving “digging and filling”.
For actual measurements, we may need to have a program of elevation sensors based on titanium rods that rest on the deep continental keel of their location – true “bedrock”, he heh. Although I trust my elevation at the fishing cabin high in Colorado, I realize my sensor cemented to a rod resting on bedrock may provide very slightly differences in altitude from the center of the Earth over next thousand years, maybe even hundreds cause the continental base itself is moving. GASP!
So one idea from this old engineer might be to spread about a hundred inexpensive GPS surveyor quality sensors and measure distance from Earth center. With a cheap GPS and good post processing of data we could get to the mm level accuracy(hint: do carrier wave processing with modern time chips that work down in nanoseconds to look as phase angles).
Gums sends…
We do.
Your post reminds me of a video entitled: “River of Sand.” It’s still available on the web. It explains where the sand comes from and how it moves down the West Coast.
Another good post showing how dodgy much of the basic ‘climate information’ is.
Your debunked AMOC story is still rattling around as ‘climate news’.
Regarding the sign “Danger to Mariners”: why would the outgoing tide be more dangerous than the incoming tide? One would think that there would be more breaking waves through the pass during an incoming tide than during an outgoing tide, since the tidal flow adds to the waves during an incoming tide, but fights the waves during an outgoing tide.
This story about shifting sand reminds me of some beaches in western France, near the estuary of the Loire River. Between 1985 and 2010, I frequently visited a west-facing beach called Tharon, located about 7 miles south of the mouth of the Loire River. In 1985, there was a concrete retaining wall about 3 feet high, on which some small beach cabins (changing rooms) were located. By 2010, sand had piled up to such an extent that the retaining wall was only a few inches high, and covered with sand in some places.
About 20 miles to the northwest, there is a famous south-facing beach called La Baule, which attracted high-end tourists with its hotels and casinos, but the beach was eroding away, and had become full of gravel and small stones. By 2010, there was a plan to transport sand from Tharon back to La Baule in huge trucks, because the hotel owners couldn’t have tourists complaining about a rocky beach.
If there had been tide gauges at these beaches, they would record a rising sea level at La Baule, and a falling sea level at Tharon, only 20 miles away. This would have nothing to do with a rising sea level due to melting ice caps, but only local beach erosion by prevailing westerly winds and the waves they generate.
Regarding your first paragrapg, almost all waves are caused by the wind blowing over the surface of the water, and the faster the wind the bigger the waves. If the wind is onshore the difference in surface speed is less on the incoming tide and greater on the outgoing, so on the ebb the waves will be bigger, and the bigger the wave the more dangerous it is in shallow water.
Very true, south Texas coast is mostly sand, much fossil from shelf, pitiful tides less than 2 feet, but so much onshore wind it attracts windmills. Much money has been wasted on small inlets since jetties accumulate alongshore drift and shoals still form in the channel at the ocean end. When the height of the wave is more than the distance between crests which occurs on the few strong ebb tides and high winds it is not fun. Such experiences should be required for all these ‘experts’ writing papers. It would also help to read old papers on hydraulics.
The Agullas current off the south east of South Africa is notorious for high waves when the wind is against the current. Rogue waves to 30 meters.
Same issue in the UK with “we’ re all doomed” stories as the East Coast houses slip into the sea. As they have done for a long, long time….
I think the owners of these properties have every right to say “we’re doomed”.
on-the-edge-inc–316261.jpg
But they had a nice view while it lasted…
Willis, it would be interesting to know how deep into the sand the tide guage pile goes and what is on the bottom of it. If they put some kind of foot on the bottom it might not in fact be sinking, although that is what it looks like at present.
And +100% about your Coastguards.
Thinking about this a bit more, I am surprised they haven’t worked out where the sand they dredge out every year is coming from. Many decades ago on the river Forth mildly radioactive particles were added to the mud dredged from the entrance to Grangemouth and tracked to see where they went after they were dumped in the various designated dumping grounds. ( It was known that the mud particles came down the river. )
So looking at the chart the sand is most likely coming out of the lagoon rather than the sea, but it would be easy to find out.
At Grangemouth, to the surprise of very few locals, on really big spring tides by the time the dredger dumped the second load of the tide at the nearest dumping ground five miles away some of the first load had arrived back at the port entrance – but that is a different story!
Good expose of the cheeky use of local data for the fear mongering tendency of Net Zero/Greenie Death Knell/CAGW religion. Eureka/Humboldt Bay has another geologic characteristic that seems to be producing a coastal anomaly. Notice the concave east curve of the ocean front from just south of Eureka north to Brookings, in adjacent Oregon. This is the west limit of the Exotic Klamath Terrain, an obducted sea floor mafic chunk of crust. The obduction partly occurred just north of Brookings, where the Otter Point formation is actually a melange zone. All of this means that a very dense chunk of crust was slid up onto the margin of the America Plate, sometime in the Mesozoic, and the dense (heavy) terrain depressed some parts of the margin. Look at the beach development along this concave east ocean front, the usual cliffs are lacking. Willis is right about the local problem with shifty sands and tide gauges. but the problem is probably also associated with the exotic Klamath Terrain.
Very nice Willis, the more you report like this the more desperate they will become. Concentrate on informing the common guy, he will put an end to this nonsense when he learns that he has been bamboozled big time.
Related material:
Sand:
find Washaway beach – North Cove, WA – – look at the Galleries
https://www.washawaybeach.com/history/
Tectonic:
There is a rotation of the Cascade arc from Northern CA into B. C.
The clock-wise rotation is shown on maps here:
Steady rotation of the Cascade arc | Geology | GeoScienceWorld
Note the eastern Oregon location of the pivot (OF pole) with the shorter arrows compared to the western margins.
Much reading can be found by a search for: CWU PANGA
If the boat house were settling we might expect that the floors are no longer level. All river deltas sink when flood control interferes with their replenishment. The shores of ancient Lake Bonneville are punctuated with peninsulas made of sand and gravel brought down by streams trapped in the peninsulas of their own making (it helps that the shore receded gradually). The silt brought down by these streams is found in the valley and lake bed–the smaller the particles the further they go out to sea. Lake Bonneville never had any currents like the Pacific, but the fact remains that sand and silt tend to travel downhill, not laterally along the shoreline, especially down the steep beaches of the Pacific. There’s a good chance the Eel and Mad rivers have shared an outlet in fairly recent times. Curiously the Mad River, like the Smith River north of Crescent City, flows northward for a stretch right along the coast, which might be explained not by any ocean current but by the reshaping of the earth’s crust from melting ice pack a mile thick. But it’s more likely a random and recent process, more like the sand peninsulas of Lake Bonneville; rivers should probably be included in the list of components contributing to the formation of barrier islands.
Brilliant work, Willis!
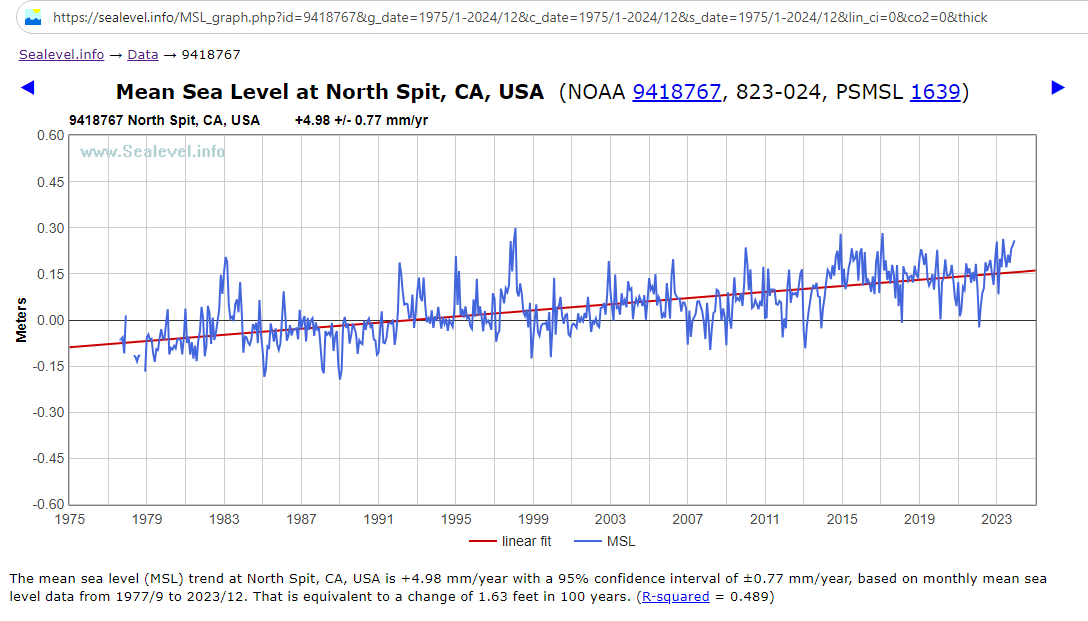
North Spit also has only 46 years of measurements, which is generally considered too short to establish a robust trend:
https://sealevel.info/MSL_graph.php?id=9418767&g_date=1975/1-2024/12&c_date=1975/1-2024/12&s_date=1975/1-2024/12&lin_ci=0&co2=0&thick
For comparison, here’s Crescent City, CA, which has 91 year long measurement record:
https://sealevel.info/MSL_graph.php?id=9419750&g_date=1930/1-2024/12&c_date=1930/1-2024/12&s_date=1930/1-2024/12&boxcar=1&boxwidth=3&thick
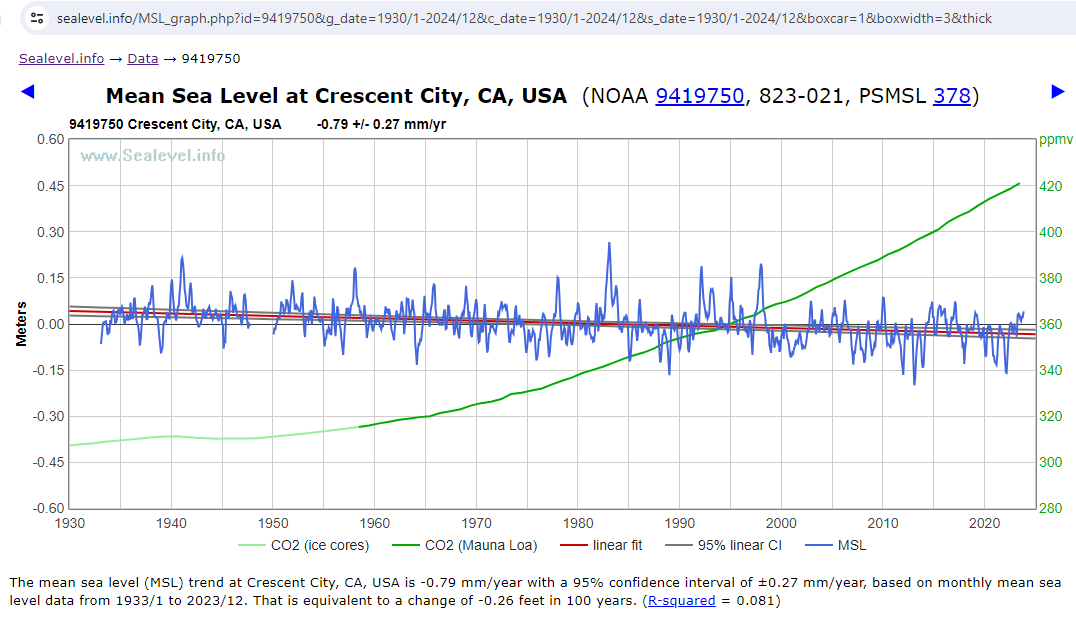
Neither site has experienced statistically significant acceleration.
The green trace is CO2. See how much it has affected the sea-level trends?
You’re exactly right about the flowing sand, too. This is a classic 1965 educational film from Encyclopedia Britannica Films and the American Geological Institute, courtesy of the LSU Center for Geoinformatics:
https://www.youtube.com/watch?v=FqT1g2riQ30
It explains how sand beaches are affected by manmade structures and the forces of nature.
(It is 20 minutes long at normal speed, but I preferred watching it sped up to 1.5x normal.)
Excellent. Ignore my comment.
Thanks for the YouTube reference Dave. As a kid I spent many a summer on the South Carolina beaches watching them grow, subside and drift, and the things people did trying to stop ’em. That film does a good job of explaining the results :<)
It didn’t take a lot of finding (you know me, you know what)
17 comments so far and a few read my mind and wondered ‘Where is all the sand coming from‘
Jim M answered that with ‘River of Sand’
An interesting/confusing play on words – is the movement of the sand-bar down/along the coast = ‘the river’ or is there a real and more conventional river at work?
Toward the end of the film, (dated but good/informative) it tells us that a real river is involved and a brief look at Google Map makes it crystal clear that the ‘Mad River‘ is feeding sand to the sand bar:
Film: Beach: River of Sand
Fantastic, so off we go to look up the Mad River, if not just to find out where it got its name. We checkout the wiki first to find the attached.
A litany of ‘erosion‘ caused by urban building, clear cutting, logging, road building, excessive sediment and impaired turbidity
Also, where the opposite occurs = when John H pointed to ‘Washaway Beach’
and where the ocean is claiming immense amounts of land.
Straight away you’ll read about: The dam on the Columbia River
Amazing stuff Phlogiston, innit?
What was that Mexican place called where the same was happening as at Washaway Beach, the story covered here also:
El Bosque, or something like that?
i.e. A small village on a sand spit (at the end of a river) was dissolving into the sea
hello edit button, my old friend.
https://en.wikipedia.org/wiki/Mad_River_(California)
It looks like the answer could be ‘in the sand’.
Getting an accurate, reliable “measurementt” of less than 1mm from a “Co-located GPS” would be somewhat of a miracle. Of course, miracles do occur, and frequently in the case of low precision devices measuring temperature differences of less than a tenth of a Fahrenheit degree..
We might wish that someone would come up with a better metaphor than canaries — those birds would stop singing when they died of firedamp poisoning. They’d also stop if the lights went out, they died from other causes, or when the gas exploded. A canary in a coal mine is even less accurate, precise or reliable than the tide gauge built on sand.
Willis, I’m willing to go along with your much of analysis although sand, unlike clay, actually isn’t very compressible (although it is certainly erodable) and I was under the impression that the normal practice when building on sand is to drive piles deep into the sand and build on them. That’s presumably why the pier at Santa Monica is still around despite carrying the weight of, among other things, a Ferris wheel and carousel.
However, my understanding is that there’s a lot of geologic evidence that the California,Oregon,Washington coasts aren’t actually rising much long-term except locally in a few places like Mt Soledad between La Jolla and San Diego. South of Cape Mendocino the coast is moving slowly North along the San Andreas fault complex. The San Andreas is technically a complex bunch of right lateral strike-slip faults with little or no vertical component. You can check that with the record of the San Francisco tide gauge during April 1906. No impact at all visible. I’m pretty sure the spectacular cliffs between Monterrey and Morro Bay are the product of erosion, not uplift.
North of Cape Mendocino the uplift is as you describe. Sort of. What actually seems to happen is that the subduction of the Pacific Plate under the North American plate is kind of sticky. It gets stuck. Pressure builds. The land above it is pushed up slowly by material that can’t get past the blockage. But eventually the pressure gets to be too much and the blockage breaks free. The land above it then drops a meter or two. This is accompanied by a magnitude 9.0 (give or take a bit) earthquake and probably a nasty tsunami.
It is thought that there have been 43 such “instant” downward elevation adjustments in the past 10000 years. That’s one every 232 years. The last one was in 1700 A.D. That’s 325 years. Might want to think twice about buying beach front property on the Oregon or Washington Pacific coast.
Use the first part of the following to learn of the 1700 episode:
The orphan tsunami of 1700 —Japanese clues to a parent earthquake in North America
Willis, it’s good. I hate to use the appeal to authority, but I worked with NOAA for many years as a contractor. I know them well. The parts I worked with, NWS and NESDIS, work hard to deliver accurate data to the public in real time. Anyway, to answer your question about subsidence, NOAA has no authority to address it; USGS does. Your tax dollars at work. NOAA tracks sea level with satellites carrying radar. Since 1992, their satellites have measured sea level. It’s rising very linearly at 3.1±0.4 mm/year. All other changes are subsidence or land rebounding, usually now the glaciers are gone.
https://www.star.nesdis.noaa.gov/socd/lsa/SeaLevelRise/LSA_SLR_timeseries_global.php
If you are in the neighborhood it’s worth stopping in at the Samoa Cookhouse for their family style breakfast. Right close to the CG station on the spit. Old photos and artifacts from the logging heyday of the Redwoods in Humbolt County. Spent 10 years on Simpson and Palco timberlands helilogging.
Willis – stand by for some more sediment. The COPCO dam breachings have turned into a disaster. A century of sediment is flowing into the Pacific from the Klamath River.
https://californiaglobe.com/articles/klamath-dam-removal-its-an-environmental-disaster/
Littoral drift is not necessarily north to south everywhere. At Yaquina Bay, it’s south to north, as seen by sand piling up to the south of the south jetty.
Adding STORY TIP to the preceding.
But will they ever learn??
Thanks, Neil. I’d seen that about the dam. My only comment was “What did they expect?”
I mean, the dam has been there collecting silt for decades. Seems like they should have let the water out slowly. Because blowing the dam is guaranteed to wipe out every living thing in the river.
That’s the bad news. The good news is, the river will heal and the various species will (mostly) repopulate it. For example, a long section of the upper Sacramento River was totally carpet-bombed by a train derailment that spilled railroad cars full of poison into the river. Killed every living thing. But as soon as the residual poison was gone, the River healed back quickly.
And this is not poison in the case of the Klamath. It’s silt, a natural component of the river since forever. So the build-back will be fast.
One slower-recovering species will be this years salmon spawn. But that’s why nature set it up so the salmon spend 3 or 4 or 5 years at sea. That way, the total destruction of one year’s spawn doesn’t mean the end of the species. But there will be cyclical low returns until that cycle repopulates from other salmon with bad clocks, salmon who return a year early or late.
w.
Neil, you say:
However, I’d said (emphasis mine)
And that’s exactly why I ask people to quote the exact words they are responding to …
Regards,
w.
It seems odd to me that the Climate Cult puts so much effort into ‘homogenizing’ temperature data but ignores doing the same with sea level data. It’s well known (to most) that water runs downhill. This would indicate that localized anomalies in sea level data are likely a result of gauge elevation, prevailing winds, currents, or other localized considerations. It seems to me that ‘homogenized sea level numbers (or maybe even a single ‘homogenized sea level’ would tell us exactly what is needed to explain the coming catastrophe . . .or maybe it doesn’t. The latter would explain why it isn’t done.
Tom ==> Your solution is the problem. There is so much computational hubris involved with “Global Sea Level” and its rise and fall that reality has been obscured entirely.
Sea Level is only a a concern where the sea hits the land. None one notices or cares that there are humps and low spots in the middle of the ocean (which there are) which are not filled by water running downhill.
Not only are land and buildings on the sand spit of Humboldt Bay subsiding, but the collective intellect of the local media also seems to be on rapid decline.
That area of California seems to have its share of press. We spent some time on land in NW California and the Oregon coast, even up the Smith River after staying in the redwoods. Also had relatives that once lived in Klamath Falls so was curious about the dam removal since it seemed like a long way for salmon to go with all the tributaries leading into the main river. This is not the only incompetent ‘restoration’ going on and it would be interesting to find the details about their pre-destruction study and wonder what they forgot to check. It has happened elsewhere.
https://californiaglobe.com/articles/klamath-dam-removal-its-an-environmental-disaster/