The eruption of the Hunga Tonga-Hunga Ha’apai volcano on January 15, 2022, produced the largest underwater explosion ever recorded by modern scientific instruments, blasting an enormous amount of water and volcanic gases higher than any other eruption in the satellite era.
Two research papers have now detailed how that water vapor rapidly affected the Earth’s stratosphere between 10 and 31 miles above the surface, causing an unexpectedly large loss of ozone and an unexpectedly rapid formation of aerosols.
“Up until now, sulfur has been the primary focus of research on eruptions,” said Elizabeth Asher, a CIRES research scientist now working at NOAA’s Global Monitoring Laboratory. Asher led one of the two recent studies while at the NOAA’s Chemical Sciences Laboratory. “Studying Hunga Tonga showed that other gases, like water vapor, can have a profound impact on these outcomes.”
Hunga Tonga offered a unique opportunity to observe the immediate atmospheric impacts of a massive volcanic eruption. When news broke of the eruption, Karen Rosenlof, a senior climate scientist at the Chemical Sciences Laboratory, immediately contacted colleagues on the island of La Réunion, which sits in the Indian Ocean 8,000 miles away from Hunga-Tonga but lay directly in the path of the dispersing eruptive plume. Only days later, Asher and several colleagues from CIRES, the University of Houston, and St. Edward’s University were on flights bound for La Réunion carrying miniaturized atmospheric instruments in their baggage.
The rapid deployment of balloon-borne observations at Réunion Island confirmed the unprecedented amount of water vapor – an estimated 150 million tons – that was injected into the stratosphere by the eruption. The balloon payloads also carried instruments to measure ozone and sulfur dioxide, in addition to carrying a POPS (portable optical particle spectrometer) particle instrument to determine the abundance of injected aerosol, which was used to calculate the rate at which new aerosol particles were formed downwind of the volcano.
The rapid response observations by NOAA and partner scientists provided insights that would have been impossible if the measurements were a month later.
“Our measurements showed that stratospheric ozone concentrations decreased rapidly – by as much as 30% in air with the highest water vapor concentrations – in the immediate wake of the eruption,” said Stephanie Evan, a scientist from the Laboratoire de l’Atmosphère et des Cyclones in France and lead author of the other recent study, published in the journal Science. Evan and colleagues continued to measure ozone concentrations depleted by around 5% across the Indian and Pacific oceans two weeks following the eruption.

Scientists have long understood fundamentally that chlorine-containing molecules react with sulfate aerosols containing water vapor in the stratosphere converting them to an active form that destroys ozone. According to Rosenlof, however, these were the first measurements that captured the effect.
While Evan examined the impacts to ozone, Asher focused her attention on the particle measurements collected by the POPS. Volcanic aerosols are profoundly important for global climate, as demonstrated by the 1991 Mt. Pinatubo eruption that cooled the planet by 0.5°C (0.9°F) for nearly two years. They can also act as surfaces upon which rapid chemical reactions can take place, leading to the destruction of ozone.
By combining data from the balloon measurements with global satellite data, Asher and colleagues found that a large, dense layer of aerosol particles formed in the stratosphere faster than had ever been seen before. These findings were published in the Proceedings of the National Academy of Sciences.
“The tremendous amount of water vapor that this volcano sent to the stratosphere led to a rapid production of sulfate aerosol particles that we were able to observe within days of the eruption,” explained Asher. Under normal atmospheric conditions, sulfate aerosols form from sulfur dioxide on a timescale of about a month. In this case, rapid measurements provided critical clues for determining the chemical and microphysical processes required to cause these effects – clues that would have vanished if the measurements had been taken a month later.
Such measurements are critical for furthering scientific understanding of aerosol processes in the stratosphere, which remain one of the largest sources of uncertainty in climate predictions. Volcanic eruptions in particular are of significant interest because they are considered natural analogs for stratospheric aerosol injection — a proposed method of climate intervention that would spread reflective particles like sulfur dioxide in the stratosphere to intercept solar radiation and cool the Earth’s surface.
Who to blame? That is the question.
God? There is a legal precedent for action.
There is a Marxist somewhere right now trying to figure out a way to tax God.
so sue him! 🙂
Watch The Man Who Sued God.With Billy Connolly.
An ex lawyer now fisherman sees his fishing boat sunk by a lightning. His insurance company claims “Act of God”. Sue the insurance company or God/churches?
That’s a fictional case based on several cases that have actually been brought. One succeeded, on a weird technicality, all the others lost – mostly due to how, exactly, does someone serve Himself with the lawsuit?
If God is omnipotent then surely He knows He has been served?
“Children, you can’t just allow yourselves to get served! It’s on!”
That would be thanks to His omniscience.
I blame the people who decided that Chemistry is now called Chemical Sciences. I disavow them.
Since Math is now racist, is Chemistry next? Or should Physics get that honor?
math is integral to all sciences. it is systemic to all (equally).
but since equal is bad, we would indeed have to pick one.
I vote for Astronomy first. Then we can go after Chemistry … then Physics.
Actually, maths was developed by, and has facets of many different cultures and “races”
It is a truly multi-cultural language.
I for one gratefully thank ALL races and people who had a hand in the development of mathematics.
Just because some “races” didn’t have any input into its development because it developed fast than their culture, is their problem, not the problem of mathematics.
As is very often the case, the person calling someone or something “racist”, is usually the most racist person around.
When I was in college, the notion was that anything with a ‘science’ label appended wasn’t—political science, social science. We knew that economics wasn’t ‘sciency’, so it was just called economics. We knew that chemistry and physics and geology were science, so they were just called chemistry and physics and geology.
Apply those basic common sense rules to ‘climate science’ and you get the political/social expected outcome. Worked then, works now.
Calling economics a science is far more valid a use of the word than social studying or politics or psychology.
One of the tenets of scientific experimentation is making a single change then observing what happens. With economics that can be done, for example by raising or lowering a tax on one commodity like gasoline.
With the “social sciences” that’s essentially impossible. Everything to do with human, feelings, emotions, interpersonal interaction etc is “squishy” and “fuzzy”. That lead to that study of psychology papers which determined the vast majority of them are complete BS because the tiny differences supposedly observed are smaller than the researchers tightest error calculations.
When it comes to money and the cost of things, how people react to a change is much simpler to determine and can be “binned” based on a variety of factors like how household income or area where the people live relates to how or if their purchasing of the price changed item changed. Marketers do this all the time to determine the best price for a product to get the best sales across the range of the targeted buyers.
Delve into asking questions such as if people like a product or if they’d recommend it to other people, a large percentage of people will lie, or at least give answers they think the surveyor wants to hear.
There is economic study – but the practice of economics as in the mainstream today is garbage.
Mainstream economists have failed to predict crashes, have failed to identify bubbles, have justified all manner of oligo-and mono- polies, etc etc. Among the more egregious nonsense: “efficient market theory” and “rational actor behavor”.
Therefore economics – both in practice and in use (via government policy), as well as in the “not Nobel” prize, is not a science. It is ideology.
If we would remove carbon from the periodic table, then carbon dioxide would not form from combustion.
Most of the stratospheric water and salt elements and molecules have now drifted into the Southern Hemisphere, whence they originated. This may have contributed to the hot summer in South America, a possible factor in the deadly Valparaiso fires, and maybe the winds driving them.
Trump.
Does this mean the science isn’t settled after all? . . . I mean, I was told all along that it was CFCs, not water vapor and volcanic eruptions, that were “destroying” Earth’s ozone layer.
“… largest…unexpectedly…faster than had ever been seen before…”, all suggesting to those actual, practicing Scientists in The National Academy of Sciences, that there is so much we don’t know about the complex and even chaotic climate controls, that maybe the doomsday scenarios need to be toned down a bit. Don’t wait for it.
So this is a kind of “Black Swan Event” for climate scientists?
The question must then be asked –
“how many more “Black Swan Events” must climate science be presented with before they acknowledge that –
we don’t know about the complex and even chaotic climate controls
“Volcanic eruptions in particular are of significant interest because they are considered natural analogs for stratospheric aerosol injection — a proposed method of climate intervention that would spread reflective particles like sulfur dioxide in the stratosphere to intercept solar radiation and cool the Earth’s surface.”
There was no apparent reaction one way or another in terms of UAH MSU temperature for a year and a half after the eruption, until the spike beginning in the middle of 2023, which is probably unrelated. Not sure what this eruption did, but I’ll leave that to the experts in that field.
Ships passing in the night and all that.
From what I’ve read the ozone and water vapor changes should produce warming while the SO2 produced cooling. The SO2 would fall out first and water vapor very slowly. It could be the effects were balanced over the first year and then the warming influence has taken over. This article didn’t provide much information on the continuing effects.
Right, and what’s so odd about the spike beginning in the middle of last year is how sudden and pronounced it was. No gradual leading up to it, a slow but gradually accelerating climb, just boom, there it is.
Although the Tambora volcanic eruption occurred in April 1815, the infamous “Year Without a Summer” was recorded in 1816 … some 18 month later.
1815, 1816 . . . weren’t those years towards the end of the Little Ice Age, which lasted some 500+ years total?
Yes, but the Little Ice Age bottomed out something like 1650-1750 – if things had stayed warm like in the middle ages you’d all be grumbling about the current Pope like all the other Catholics right now and probably have a rosary in your pocket, for good measure. Nothing breeds revolution or “protests” like empty bellies.
Science and technology would probably be a few centuries or maybe decades ahead – Henry’s theft of the monasteries set back modern steel production at least 2 centuries, for one example.
The best thing that could happen to this world is that the temperature keeps going up, slowly as to not give the nutters any excuse, so that, with the increasing CO2 levels, this big blue marble keeps getting greener.
Not really, see attached graph.
Where’s the “graph” from? It shows the medieval warm period just as warm as 500s during which there was another climate catastrophe like or worse than the Little Ice Age. And the Medieval Warm period was warmer than now not cooler – they were farming more northerly and at higher elevations than we can now despite our advanced technology. So I call bull caca on your graph. Did you get it from Dr. Mann?
PCman999,
Google and Google Images can be your friend.
The graph is featured at https://en.wikipedia.org/wiki/Little_Ice_Age .
If you had bothered to click on the attached graph that I posted so as to enlarge it (apparently a needed hint for you), you could have the read the following attribution under its bottommost right:
“From graphic by Ed Hawkins. Data from PAGES2k (and HadCRUT 4.6 for 2001- ). Reference period: 1850-1900”
I gently suggest you convey your criticism of the graph back to Wikipedia, not me, where I’m sure they will give it all the attention that it deserves.
Surprisingly, there are a lot of people who don’t think very highly of Wiki’ on topics that have become politicized.
That’s not at all surprising to me, but I challenge you to provide an alternative source of online encyclopedic knowledge . . . especially one that does better than Wikipedia is providing extensive footnotes/references to each of its published articles.
Waiting . . .
BTW, for Wikipedia—politicized topics or otherwise—and for all other Web “sources”, caveat emptor.
Ah…the “Mann-ipulated Temperature” graph that eliminates both the Roman Warm Period and Medieval Warm Period and warmer the Nadir of the LIA
WTF you talking about? . . . the Medieval Warm Period is clearly identified on the graph I posted and referenced.
Please provide a scientifically objective alternative graph.
Big loss of ozone -> more UV reaching the ocean surface feeding the coming El Nino event.
OK, the experiment has been run, courtesy of nature, on a truly massive scale. Is there any objective, scientific evidence—any at all—that the 2022 Hunga Tonga-Hunga Ha’apai volcanic eruption created any measurable global cooling?
And why would we want a cooler climate anyway?
The Earth is still in a 2+ million-year ice age with 20 percent of the land frozen.
The Cenozoic Ice Age began about 34 Ma, with the glaciation of Antarctica, with the formation of the Southern Ocean. Ice sheets started to cover the Northern Hemisphere as well some 2.6 Ma, after the Isthmus of Panama closed.
Anyone trying to mess with the CO2 emissions should be arrested for crimes against humanity!
Nothing better for this world than it continuing to warm like it has been for the last few decades.
Well, whatever the mechanism, the effect is to save global warming, despite there being no way to claim CO2 as the cause.
And the ocean impact:
Your HadSST4 graph doesn’t show an anomalous rise is sea surface temperature until more than one year after the Jan 2022 Hunga Tonga-Hunga Ha’apai eruption. Strange.
See also johnesm comment above.
Yes, and the ocean temp peak was supported by both El Nino and anomalous North Atlantic highs, backing down Nov. Dec. Not simple indeed, though the first graph shows the leap in water vapor persists, and the effect may be lagged.
Hunga Tonga turned out to be a nothing burger as far as planetary climate despite NOAA’s rather grandiose claims and impressive graphics. Reflects badly on the cooling aerosol effects previously claimed for the Pinatubo eruption which are used to hype CAGW.
Aside from the aerosol discussion, there is this paper regarding the warming connection between SSTs and Stratospheric Water Vapor (SWV)
Increase in Lower Stratospheric Water Vapor in the Past 100 Years Related to Tropical Atlantic Warming
https://agupubs.onlinelibrary.wiley.com/doi/full/10.1029/2020GL090539
Abstract
Lower Stratospheric water vapor (SWV) is one of important drivers of global climate change. Increases and decreases in lower SWV have been found to strengthen and offset global warming effects, respectively. Using several data sets, we find that sea surface temperature (SST) warming in the past 100 years has caused an increase in SWV. SST warming over the tropical Indian Ocean and the western Pacific has resulted in a drier stratosphere. However, tropical Atlantic Ocean warming has resulted in a significantly wetter stratosphere and is the main contributor to the increasing trend of SWV in the past 100 years. The responses of Rossby and Kelvin waves over the Indian Ocean and western Pacific to Atlantic warming have led to a warmer tropopause temperature, resulting in more water vapor entering the stratosphere. This study suggests that SWV trend may simply be the result of a game between warm pool SST and tropical Atlantic SST changes.
“And the ocean impact”
Before the HT-HH event UAWVC lagged SST, but in 2023 the SST lagged UAWVC.
I doubt more stratospheric WV warms the ocean as the WV is so widely distributed. Wouldn’t more WV then eventually cause runaway warming if it could do it all?
Bob, thanks for graphing that comparison. I am noticing two sharp rises, one in stratospheric WV and one in SSTs, and wondering what might be the connection. I am aware of theory that more SWV reduces ozone, resulting in increased solar energy warming the ocean. Obviously, a sudden volcanic injection of H20 is not business as usual for the SST/ SWV connection.
It looks like about 18 to 24 month delay of El Niño onset near Papua New Guinea and SST effect to WVC effect.
But WVC effect was much quicker with Hunga Tonga
But total atmospheric water column averages about 2.5 cm/m^2 which is 25000 gm/m^2 so a 0.3 gm/m^2 increase in the stratosphere just has no effect on IR, cloud cover, aerosol quantity, albedo….nothing….claiming “a profound impact on these outcomes” is bullshit.
DM, I can’t find a definition for the MLS metric. Maybe this is a better graph from NASA:
Figure 3. Total water vapor mass between 70 hPa (approximately 17.5 km) and the top of the atmosphere estimated globally (top) and in the tropics (bottom) between 2016 and April 2022.
Interesting graph, Ron. A latitude or elevation missing off one of them. NASA website is saying Millan’s paper is saying 146 megatons of H20 were ejected into the stratosphere. So .146 Gigatons. This would seem to be less than 1/2 enough to explain the summed H2O increase amount on those graph’s vertical axis.
Both graphs have the same elevation, 17 km to TOA. The 146 million tonnes of H2O are the global rise, and tropical latitudes have half the total but also show the same rise.
Apparently, all the volcanic water went into the tropical stratosphere.
Column 20 to 80 km?
What does that mean?
That entire column had about 1.7 g water vapor/ m^2; should that be m^3?
How does that convert to ppm, especially with the density of atmosphere decreasing?
Water vapor at 20,000 meter? Would it not condense on particles and freeze?
Yes, 1 sq. m. from elevation 20 km to 80 km.
10 tonnes of air over every square meter at atmospheric pressure….
Yes, 1 sq. m. from elevation 20 km to 80 km.
10 tonnes of air over every square meter at atmospheric pressure….
At 20 km about 540 kilos of air remain above you up to 80 km.
540×10^3gms/18=30,000 gram moles
1.7 grams of water= 1.7/18= .04 gm moles
.04/30000=1.3 ppm
But the difference after Hunga Tonga was only .3 g/M^2 so only 1/4 ppm
In the stratosphere that is a lot.
The following paper seems pretty thorough and shows a spike up to 10 ppm from the usual 4 ppm at that time period, in Fig. 4, which is about 25 km up, and not worldwide.
https://www.pnas.org/doi/10.1073/pnas.2301994120
Thank you for responding
1.7/18 = 0.091 g moles
At 3000 meter el. T is – 4.5 C, from the table
Water vapor molecules would condense/freeze on particles?
99.2% of water vapor is in lower atmosphere
The ppm of CO2 and H2O above 4000 meter el. is extremely low, and neither would be a factor regarding GW.
Where does the 540 kilo come from?
The pressure is the weight of air above that point. At 20 km the pressure is 5.475 kpa so. 5.475/101.325 = .054 of the weight of air above you at sea level. .054 times 10 tonnes = .054 x 10,000= 540 kilos.
I see I made an error in using the mole weight of water instead of the MW of air, which is 29.
So 540 x 10^3 gms / 29 = 18,600 gm-moles of air per sq. m. above 20 km ( actually ignoring the amount above 80 km…..
so the last two ppms would be 2.1 and 0.4
Thank you for your clear explanation.
Few of us are familiar with the concepts, and calculations, which for experts are “Duck soup”
Those low ppms would have no impact regarding GW
To summarize:
There is about an 18 to 24 month delay of El Niño onset near Papua New Guinea and sea surface temperature, SST, effect to water vapor column, WVC, effect.
WVC effect was much quicker with Hunga Tonga
Air pressure is about 10 metric ton/m^2, or 101.325 kPa.
Air pressure at 20 km is 5.475 kPa
Weight of air above 20 km is 5.475/101.325 = 0.054 x 10000 = 540 kilo, or (540 x 10^3 g)/29 g mole = 18600 g mole.
Pre-Hunga Tonga, vapor weight was 1.7 g/29 = 0.06 g mole, or 0.06/18600 = 3.15 ppm
After-Hunga Tonga, WVC increase was 0.3 g/m^2, or 0.3/1.7 x 3.15 = 0.55 ppm
I added your image to my article
El Niños and the Hunga Tonga Sub-Surface Volcanic Eruption
https://www.windtaskforce.org/profiles/blogs/hunga-tonga-volcanic-eruption
BTW, this article uses water vapor ppm to prove CO2 plays a minuscule role regarding global warming
Ignoring the weight of air above 80 km – no problem:
“At 80 km altitude the
atmospheric pressure is down to 0.01 hPa, meaning that 99.999% of
the atmosphere is below that altitude.”
https://projects.iq.harvard.edu/files/acmg/files/intro_atmo_chem_bookchap2.pdf
Until Hunga Tonga water content had been on a fairly steady rise up 0.1 (g/m3) from 1980 to 2022. That’s about a 6% increase over 40 years. Water vapor is a GHG (powerful GHG)what affect would a 6% increase have on global temperatures?
Dang not 1980 to 2022. Wrong graph. 2006 to 2022 A 6% increase in 16 years.
You bring up a good point!
If added water vapour from a CO2 warmed world was supposed to balloon the warming to 3-5 °C, we would have seen something of that by now, not the trend of about .15°C/decade that’s fairly consistent over the past half century – there should have been some acceleration!!
Instead we have the satellite temperature series that only show a steady trend because of the step-function of 0.2°C after every El Nino, in spite of steadily increasing CO2 emissions.
The world doesn’t seem to care about CO2 or water vapour.
But El Nino didn’t happen till later and roughly at the expected time….is there a huge eruption every ten years or so? Any way that should cause the winds to shift and the thermocline changes visible with an ENSO event?
From the article: “Volcanic eruptions in particular are of significant interest because they are considered natural analogs for stratospheric aerosol injection — a proposed method of climate intervention that would spread reflective particles like sulfur dioxide in the stratosphere to intercept solar radiation and cool the Earth’s surface.”
Well, the Earth did not get cooler after this particular eruption.
These studies didn’t address the effects of this eruption on temperatures, and maybe it’s too early for that, but it looks like they gathered good data by getting to work on it right away.
Tom Abbott:
Although a VEI5 eruption, Hunga-Tonga injected no more SO2 aerosols into the stratosphere than a VEI4 eruption, most probably washed out passing through the seawater, but even so, there should have been about 0.2 deg. C. of cooling, which did not happen.
Attached is a view of the SO2 emissions during the eruption:
It was overwhelmed by the warming?
Nice graph of the SO2 emissions from the diesels in Jakarta, not much else going on – and HT-HH is not even in the frame, right? It was way over to the right and south, almost to the date line, above New Zealand.
I don’t think any SO2 would be on a track to Indonesia.
I wonder if it rained a lot in Australia during that time – SO2 and other volcanic particles might seed the clouds.
Article says:”.., first measurements that captured the effect.”.
I find this an odd thing to say. This effect has been captured for years by measuring the “ozone hole”. Volcanoes in Antarctica have been putting chlorine and sulfur dioxide into atmosphere for years and was theorized that PCS’s were effecting the ozone.
Am I missing something?
Am I missing something?
A fat government grant?
Ozone is diamagnetic so the “hole” over the South Pole is to be expected.
However, the ‘hole’ only exists while the circumpolar vortex is present. Surely the magnetic properties of ozone don’t depend on wind velocity or direction!
Actually, Antarctica has very few active volcanoes venting directly to the atmosphere—something like two that are semi-active—despite its large areal extent . . . nothing like “putting chlorine and sulfur dioxide into atmosphere for years”.
The last significant eruption of the Mt. Erebus volcano in Antarctica was in 2020. The other semi-active volcano in Antarctica, on Deception Island, last had a significant eruption in 1970.
I am not clear what your comment is for. There does not need to be a “significant eruption” for volcanoes to be venting gases into the atmosphere. And if they or either one does it more than once then my statement was accurate.
Volcanoes in AntarcticaThermal vents, geysers and hot springs/pools in Yellowstone National Park have been putting chlorine and sulfur into the atmosphere for years . . .The graphic shows that the eruption released H2O, HCl, and SO2. I remember back when the ozone hole was first discovered that a marine scientist was curious about ocean wave spray releasing salt (and its chlorine) and if it also played a role.
Honga Tonga did not launch fresh water, it released sea water and enough convection to reach the mesosphere. Among the many things I’d like to know about the eruption is how much salt aerosols made it into the stratosphere.
Yes, there are lots of questions to be answered about this eruption and its aftermath.
We have a long way to go to understand how the Earth’s climate operates.
Supposedly, the US government has retrieved UFOs- going back to the ’40s- yet they still can’t figure out how they work. If they can’t figure out how a room sized machine works, they certainly can’t figure out how the planet’s climate works.
If they can’t figure out how a room sized machine works
Have they tried CO2?
Well, there are theories- the main one is “vacuum energy” for propulsion. But even if that’s it- making it happen is something else. Some of these craft were almost empty- according to some reports, especially that of Bob Lazar. It’s a fascinating topic- that I think might be real- or maybe not- me being the ultimate skeptic. I did see one though- back in ’84- one of the well known Hudson Valley sightings.
I think the Romulans will turn out to have been right, quantum singularity.
Lazar had said quantum singularity – the ultimate Mr. Fusion, anything you throw in would be converted to energy at about 30% of it’s mass. About 30% as good as having a free source of antimatter.
He was making things up by the way.
““vacuum energy” for propulsion”
Ahh. if only they could harness the brains of AGW cultists. !!
Those UFO’s are about as imaginary as the catastrophic global warming scam.
When a huge flying saucer lands on the White House then – maybe….
Chris
Klaatu barada nikto
I think it was “verata,” but I get it.
see if your brain can hold anymore information
TMZ Presents: UFO Revolution
a 3 part series on Tubi- summarizing the last few years
https://tubitv.com/tv-shows/200044921
Well, I guess that shows the US really didn’t have any UFOs…
Unless the eruption magically partitioned out ~5mt of sodium chloride out of the seawater on its journey into the stratosphere … and beyond.
Didn’t Willis E have a post on this? Not much was detected? The current UAH spike has produced a record anomalous high “in the satellite era” but (to me anyway) describes a rather curious El Niño which leapt to a maximum, now two month pause when it should be climbing, soon on the way down to an early neutrality in June 2034. Another 30 month La Niña upcoming? Perhaps another Willis E study – the one where he says that ‘global warming’ is producing more La Niña over El Niño?
Did you mean June 2024 . . . or is your crystal ball really that clear?
Fat finger. But some predict neutral in March April 2024. Short?
Not sure that last bit is correct. There does seem to be a correlation between El Nino’s and the rapid 80’s/90’s warming and also that there are more La Nina’s than El Nino’s since the warming slowed down in the last 20 years (ish). What is missing from that is any causation whatsover so far – UAH hints that El Nino’s may correlate with global warming and La Nina’s correlate with global cooling but that’s about as far as anyone’s got.
You mean something like this?
And since 1995?
Super El Nino of 1997-98, followed by The Pause until Super El Nino of 2015-16, then cooling until abrupt warming from mid-2023.
That chart is obviously from a while ago…
But as I think I have mentioned a couple of times before… 😉
… only the 1997/98 and the 2015/16 El Ninos, and now this one, have disrupted the zero-warming trend. (Bob Tisdale notes a minor one in 1987 that caused a slight step change)
These long periods of zero-warming between El Nino events were labelled “the pause” by the AGW cohort and lukewarmers…
This is totally the wrong terminology. They are the normality, El Ninos are the warming events.
I should have put “The Pause” in quotes.
Super El Nino of 1982-83 was the big one of that decade, but 1987 was strong, too, as your chart shows.
IMO, El Nino of 2023-24 wouldn’t be Super without boosting by non-ENSO factors, chiefly the Tongan eruption, but also clean maritime bunker fuel.
I don’t think Monckton would like you referring to him as the AGW Cohort or a lukewarmer, it was he who started posting about ‘the Pause’ here about ten years ago.
The graph in my first post (just below this one, at the time of posting) showed a “zoomed in, from the 2015/6 El Nino to latest” version of my UAH comparison to an ENSO/SOI proxy (ONI in my case).
Attached to this post is the complete graph, from (January) 1979 and including CO2 for comparison.
A full mathematical analysis really ought to be done, but IM(NS)HO the good old “Mk I Eyeball” does rather more than “hint that” there is a slightly higher correlation between “UAH and ENSO” than there is between “UAH and CO2” …
I use ONI (V5) as an ENSO proxy, which has just been updated to January 2024.
I agree about the “curious” aspect, and think the delay (~15 to 18 months) from the Hunga Tonga-Hunga eruption to the increase in UAH (LT) temperatures is much too long.
I also think that it’s too soon for any “prime the pump” conjectures to have been tested at all, let alone for a “thorough debunking” to have occurred.
I think this is the main point, the science is not settled, going to take time, pretty interesting atmospheric experiment regardless how it plays out.
Good graphs. No question in my mind that ENSO-driven sea surface temperature (SST) changes are subsequently reflected in global temperature changes (including the 1946-1976 cooling period, as illustrated by bnice above). In addition, there is a clear relationship between ENSO events and rate of growth changes in atmospheric CO2 (see below), but with CO2 lagging temperature changes. This change in rate of growth is also accompanied by 13C/12C ratio changes which must be addressed when establishing a working hypothesis.
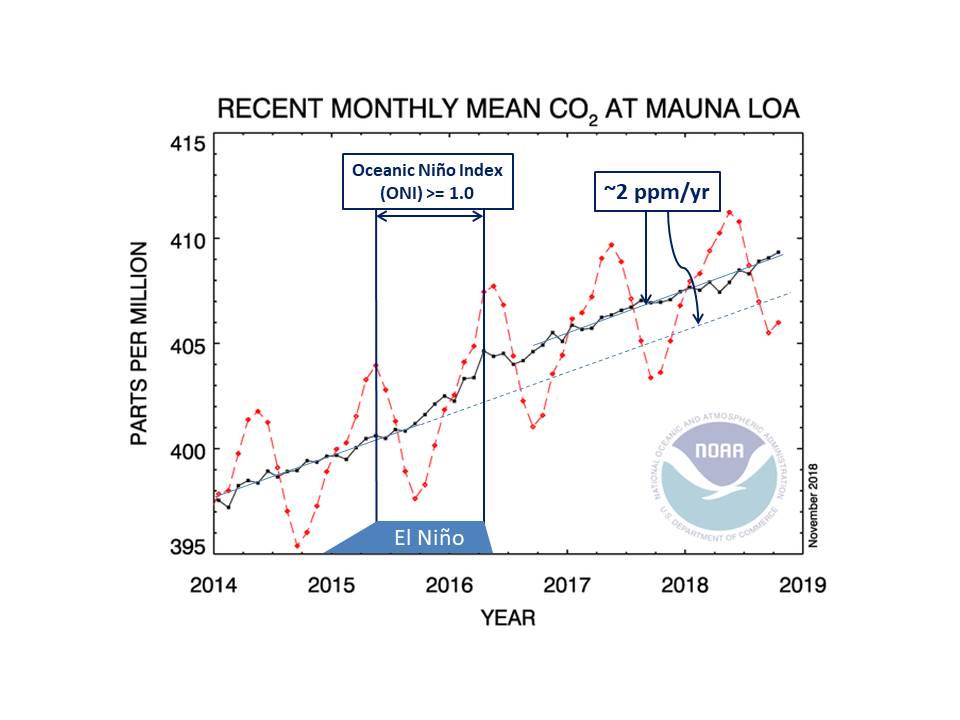
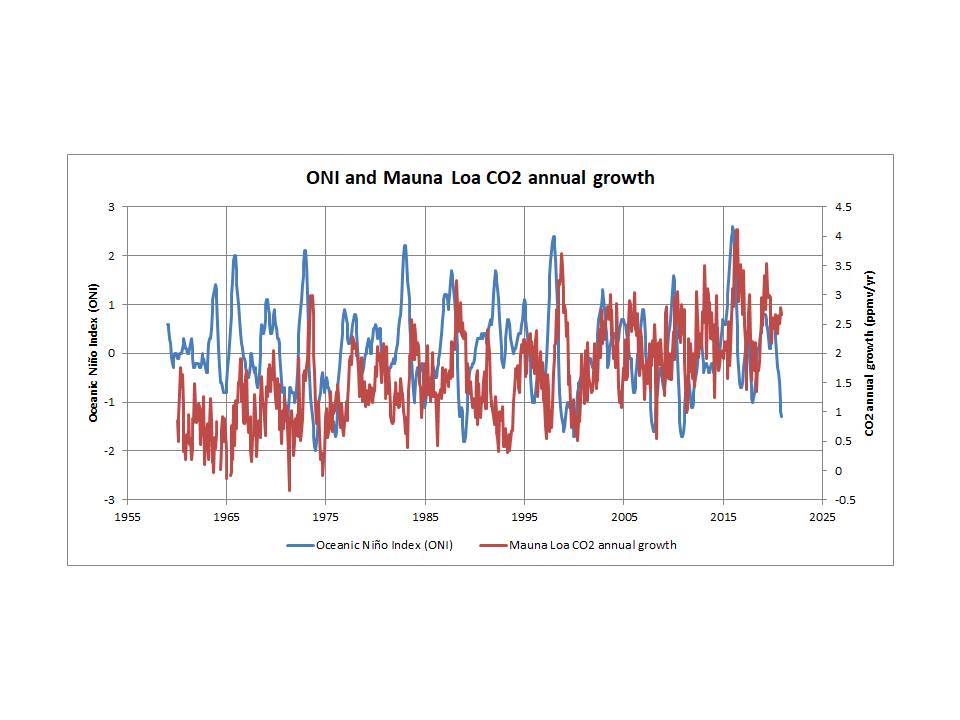
I should add that the CO2 data are from Scripps.
I think Willis post was a year ago, nothing unusual detected at that time, i have no reason to doubt that, but now a year further on may require re-analysis?
We don’t know anything about the stratosphere. It is the UV radiation that determines the temperature in the upper stratosphere.
“A minimum atmospheric temperature, or tropopause, occurs at a pressure of around 0.1 bar in the atmospheres of Earth1, Titan2, Jupiter3, Saturn4, Uranus and Neptune4, despite great differences in atmospheric composition, gravity, internal heat and sunlight. In all of these bodies, the tropopause separates a stratosphere with a temperature profile that is controlled by the absorption of short-wave solar radiation, from a region below characterized by convection, weather and clouds.”
https://www.nature.com/articles/ngeo2020
Due to its distance from the Sun, Neptune receives just 0.11% of the integrated solar UV radiation energy that Earth receives. Moreover, the flux of radiant energy emitted from Neptune’s internal (i.e., planetary) energy is ∼ 2.7 times greater than this solar component.
“Like Jupiter and Saturn, Neptune has an internal heat source — it radiates more than twice as much energy as it receives from the Sun.”
—https://geol105.sitehost.iu.edu/images/gaia_chapter_2/neptune.htm
Likewise, due to its distance from the Sun, Uranus receives just 0.26% of the integrated solar UV radiation energy that Earth receives. In fact, the total power radiated by Uranus in the far infrared (i.e. heat) part of the spectrum is 1.06 ± 0.08 times the total solar energy absorbed in its atmosphere, indicating that the dissipation of internal (i.e., planetary) energy predominates over received total solar energy, much more compared to just the received total solar UV radiation component.
Regarding Titan,
“Exothermic chemistry is found to be the dominant source of heat, with
electron-impact excitation and suprathermal electron heating becoming significant at high
altitudes.” Received solar UV radiation is not mentioned as a significant energy source.
— Heating Titan’s upper atmosphere, De La Haye, V., et.al., JGR, Vol. 113, 19 November 2008
(download available at https://deepblue.lib.umich.edu/bitstream/handle/2027.42/95339/jgra19338.pdf?sequence=1 )
Therefore, the nature.com article that you referenced to support your statement “It is the UV radiation that determines the temperature in the upper stratosphere.” does not appear to be credible for the above-mentioned planetary bodies.
At pressures below 100 hPa, only the shortest solar radiation can affect the air temperature due to the small number of particles. This can be radiation with higher energies than UV, such as gamma rays. The amount of water in the stratosphere is negligible, compared to O2 in the Earth’s stratosphere.
“These two reactions thus form the ozone–oxygen cycle, wherein the chemical energy released by ozone creation becomes molecular kinetic energy. The net result of the cycle is the conversion of penetrating UV-B light into heat, without any net loss of ozone. While keeping the ozone layer in stable balance, and protecting the lower atmosphere from harmful UV radiation, the cycle also provides one of two major heat sources in the stratosphere (the other being kinetic energy, released when O2 is photolyzed into individual O atoms).”
https://en.wikipedia.org/wiki/Ozone%E2%80%93oxygen_cycle
Nice . . . but I was specifically talking about the upper atmospheres of Titan, Uranus and Neptune, not Earth.
On any planet with a dense atmosphere, the tropopause is at 100 hPa (0.1 bar). Regardless of the chemical composition of the atmosphere. The tropopause is the region of lowest temperature between the troposphere and the higher layers of the atmosphere.
The Atmosphere of Neptune: an Analysis of Radio Occultation Data Acquired with Voyager 2Show affiliationsLindal, Gunnar F.
Abstract
The vertical structure of Neptune’s atmosphere is studied on the basis of recordings of the tracking signals received from Voyager 2 during its occultation by Neptune. The measurements began at a planetographic latitude of 62 deg north and ended near 45 deg south, and cover an altitude interval of about 5000 km. The 1-bar isobaric surface has equatorial and polar radii of 24,766 +/-15 km and 24,342 +/-30 km, respectively, and a corresponding oblateness of 0.0171 +/-0.0014. At this pressure, the temperature was 72 +/-2 K. The tropopause was detected approximately 40 km above the 1-bar level at a pressure of about 100 mbar. A comparison with IR observations indicates that the gas at the tropopause consists of 78-84-percent hydrogen by number density with the rest being mostly helium. The temperature in this region was 52 +/-2 K.
“A comparison with IR observations indicates that the gas at the tropopause consists of 78-84-percent hydrogen by number density with the rest being mostly helium.”
Well, molecular hydrogen, being a homonuclear diatomic molecule does not absorb solar UV radiation that is concentrated in the 0.2–0.4 micron part of the EM spectrum.
Also, helium is a very poor absorber of solar UV radiation, having only one weak absorption line at about 0.39 microns wavelength.
In the upper stratosphere, oxygen molecules (O2) absorb short wavelength ultraviolet radiation, causing them to dissociate into highly reactive oxygen atoms. These atoms then diffuse through the stratosphere and at heights of mainly 30-50 km, they combine with additional oxygen molecules to form ozone (O3). Ozone acts as a potent absorber of longer wavelength UV radiation (200-340 nm), effectively shielding the Earth from harmful ultraviolet rays.
The presence of ozone in the stratosphere is responsible for the increasing temperature observed with height. Without this crucial molecule, the mixing between the troposphere and stratosphere would occur at a much faster rate, leading to a significantly different atmospheric structure. The ozone layer not only helps regulate the temperature of the stratosphere but also prevents harmful UV radiation from reaching the Earth’s surface.
https://atoptics.co.uk/blog/ozone-and-the-stratosphere/
“Ozone acts as a potent absorber of longer wavelength UV radiation (200-340 nm), effectively shielding the Earth from harmful ultraviolet rays.”
So , the significant drop in measured UV levels, would mean that more UV would have been reaching the tropical oceans.
This would contribute energy towards the coming El Nino, maybe warming an area far larger than is usual. This could explain why the El Nino happened at an odd time of year, and why it has had such a wide-ranging effect.
Might also explain the rather low Antarctic sea ice last year as the southern ocean warmed somewhat.
Darn it.. too early in the morning (post above was at 6am my time)
“the significant drop in measured
UVlevels,” ->the significant drop in measured ozone levels,
I can’t access the paper NOAA links to. Does anyone know if it says what happened to the sodium atoms when the chlorine atoms were released?
Try this page, there are two papers by Asher listed:
https://csl.noaa.gov/news/2023/393_1220.html
Numerous elements and compounds were also delivered into the stratosphere, among them: sodium, chlorine, magnesium, calcium, potassium, phosphorus, iron, mercury, uranium, iodine, bromine, fluorine, sulfur, nitrogen, oxygen and silica to name but a few. What effect this will have on global weather is anybody’s guess.
Story tip. That 150 million tons of water was seawater, containing around 5 million tons of salt – sodium chloride. Does the deployed instrumentation have the capability to monitor sodium and chlorine concentrations?
They specifically discuss chlorine compounds being the actor reducing the O3
Without a doubt, we’ve seen some pretty awful weather over the last 2-3 months, very unusual to typical Dec/Jan/Feb weathers. The first thought that struck, during those turbulent days, was that the volcano, coupled with El Niño, were probably likely culprits.
You may have. Here in the UK its been absolutely normal. Cold, boring, hovering a few degrees above zero °C , dull. grey, full of wind.
We call it ‘Sunak Season’.
The same in Southern Nevada and Southern Utah.
Just weather. Nothing we haven’t seen before.
If I had a garden in Las Vegas still, I would be planting tomatoes by the middle of the month. I do that to force the last hard freeze to occur, a sacrifice to the weather gods. Then replant the next weekend with tomatoes that will produce in May and onward until nighttime temperatures get too high for the flowers to set.
Home grown tomatoes are sooo much better than store bought.
I live 1000ft up in the Pennines. I’m used to significant weather. But, rainfall where I live has been above average, and likewise the wind.
Is oxidation. O3 is “destroyed” by becomeing O2 + an oxide of the reacting chemical, like CO. So 2O3 + C => 2O2+CO2. or 2O3 + S => 2O2+SO2.
It would be as fair to say that the reaction releases breathable oxygen.
Let’s not rely too much on the CFC/Montreal hype.
Water vapor ppm vs altitude
For you wilpost…
Thank you
Water vapor is 20,000 ppm at 1 km, but on average is 4037 ppm
I added image to my article
El Niños and the Hunga Tonga Sub-Surface Volcanic Eruption
https://www.windtaskforce.org/profiles/blogs/hunga-tonga-volcanic-eruption
.
Refer to this URL to see images
https://www.windtaskforce.org/profiles/blogs/natural-forces-cause-periodic-global-warming
Water Vapor Compared With CO2 in the Atmosphere
.
CO2 in atmosphere was 423 molecules of CO2/million molecules of dry air at end 2023, or 423 ppm, but in densely populated, industrial areas, such as eastern China and eastern US, it was about 10% greater, whereas in rural and ocean areas, it was about 10% less.
https://svs.gsfc.nasa.gov/4990
.
Water vapor, worldwide basis: Water vapor is highly variable between locations, from 10 ppm in the coldest air, such as the Antarctic to 50,000 ppm (5%), such as in the hot, humid areas of the Tropics.
Water vapor in atmosphere, worldwide average, weight basis, is about 1.29 x 10¹⁶ kg, or 7.1667 x 10^14 moles
Atmosphere weight, dry, is about 5.148 x 10^18 kg, or 1.7752 x 10^17 moles
Water vapor percent, weight basis, is about 1.29 x 10^16 / 5.148 x 10^18 = 0.002506, or 0.2506%
Water vapor fraction, mole basis, is about 7.1667 x 10^14 / 1.7752 x 10^17 = 0.004037, or 0.4037%, or 4037 ppm
Water vapor molecules, worldwide average, are about 4037/423 = 9.54 times more prevalent than CO2 molecules
Water vapor in temperate zones, north and south of the equator, where most of the world’s population lives, is more prevalent, than the worldwide average of 4037 ppm.
Water vapor, in temperate zones, is about 9022 ppm, at 16 C and 50% humidity. See Note
Water vapor molecules, in temperate zones, are about 9022/423 = 21.33 times more prevalent than CO2 molecules
Water vapor in the Tropics, with high temperatures and high humidity, is much higher than elsewhere. As huge quantities of water vapor, produced near the equator travels toward Earth’s poles, it transports energy and creates weather. Variations in the Earth topography of different regions result in different weather outcomes. See video in URL
https://nhpbs.pbslearningmedia.org/resource/nves.sci.earth.vapor/monitoring-earths-water-vapor/
Water vapor, in the Tropics, is about 29806 ppm, at 30 C and 70% humidity
Water vapor molecules, in the Tropics, are about 29806/423 = 70.46 times more prevalent than CO2 molecules
.
NOTE: At 16 C and 50% humidity, water vapor in air is 0.0056 lb H2O/ lb dry air, or 2.5424 g H2O/ 454 g dry air After converting to moles, 0.009022 mole H2O/mole dry air, or 9022 ppm.
A mole of water vapor is 18 g, a mole dry air is 29 g
https://www.engineeringtoolbox.com/water-vapor-air-d_854.html
After a warm dry summer here in western canada it was a warm fall and mostly warm winter so far, except 5 days of record cold. As there is no “science” i’m aware of that shows how 2ppm more CO2 year over year could have caused that, i can only assume this massive volcano suddenly injecting all this water and garbage far up into the atmosphere had something to do with it?
I make no claim to explain what and why but it seems reasonable?.
Not sure we will ever know for sure what the total effect of HT has been…
The fact that some people say “none”, when the 2023 El Nino event has been a such an unusual one, is a bit puzzling.
Yes, it’s certainly been an odd year. Usually we lose the garden in Calgary to frost or worse some Time in September, this year first frost was basically Nov 1.
i loved it but was definitely unusual.
Has to be some explanation. A large underwater volcano blowing a significant chunk of the ocean into the stratosphere seems likely to have caused something.
may be something else completely,
I think there’s a case to be made that the planet’s vulcanism isn’t all that rare and affects the climate more than is thought.
The biggest supervolcanic eruption in Earth’s history was the La Garita super in SW Colorado’s San Juan Mountains, around 28 MYA. It was preceded by several smaller eruptions that led up to the big one called the Fish Creek Eruption. Various estimators say the ejecta of the latter was in excess of 2,000 cubic miles. Here’s a dramatic if somewhat loose concatenation of facts on the event by the Crestone Eagle (small newspaper in the Four Corners area):
https://crestoneeagle.org/a-history-of-the-la-garita-caldera-the-supervolcano-in-your-backyard/
It would be interesting to know what that eruption did to the climate and Earth’s critters. Unencumbered by any specific knowledge of the geology it appears to me that the Antarctic Glaciation that led the way into the Oligocene Epoch around 30 mya may have been connected.
RE: “Fish Creek Eruption”… make that “Fish Canyon”.
Also… 2000 Cu miles should be 1200.
Looks like the Fish Canyon Eruption is the “smoking gun” to why Antarctica iced up!
The Oligocene is known for extensive effusive vulcanism in the Sierra Nevada (Calif.), as well as other locations in the world. The ash buried the Eocene landscape of California, resulting in a new stream pattern after the vulcanism subsided, and led to a reversal of topography in the foothills of the Sierra Nevada. Geomorphic features such as Table Mountain (quartz latite lava) near Sonora (CA) and throughout the Mother Lode is evidence of the Oligocene vulcanism.
The unexpected radiative impact of the Hunga Tonga eruption of 15th January 2022 | Communications Earth & Environment (nature.com)
“We find that the Hunga Tonga-Hunga Ha-apai eruption produced the largest global perturbation of stratospheric aerosols since the Pinatubo eruption in 1991 and the largest perturbation of stratospheric water vapour observed in the satellite era. Immediately after the eruption, water vapour radiative cooling dominated the local stratospheric heating/cooling rates, while at the top-of-the-atmosphere and surface, volcanic aerosol cooling dominated the radiative forcing. However, after two weeks, due to dispersion/dilution, water vapour heating started to dominate the top-of-the-atmosphere radiative forcing, leading to a net warming of the climate system.”
Nature provided an ‘experiment’ (Hunga-Tonga) that once again proves the ‘climate science’ is NOT settled. How surprising, since:
Indeed, Rud. Resources by which the HT event can be measured — perhaps Willis Eschenbach? — includes the EA5 data set, using the EU’s Copernicus Climate Change System.
https://climatedataguide.ucar.edu/climate-data/era5-atmospheric-reanalysis
This data set is searchable with registrations, and it blends hourly vertical measurements with surface and satellite data. EA5 looks, to me, like a major resource that’s being overlooked.
It came to my attention only days ago, after Kenneth Richard at notrickzone, on a new Journal of Climate paper finding a measured 40% lower ECS for 2xCO2. SEE here
https://notrickszone.com/2024/01/22/new-journal-of-climate-study-reduces-doubled-co2-climate-sensitivity-by-40-to-0-72c/
This data set looks like a major resource for evaluating specific theories about the climate — maybe, especially in solving the Hunga Tonga eruption.
First of all, it is important to realize how thin the troposphere is, especially in winter in mid- and high latitudes. The more the role of the stratosphere and the ozone zone, where the shortest solar radiation directly acts.
