The alternative climate reality that the U.K. Met Office seeks to occupy has moved a step nearer with news that a group of its top scientists has proposed adopting a radical new method of calculating climate change. The scientific method of calculating temperature trends over at least 30 years should be ditched, and replaced with 10 years of actual data merged with model projections for the next decade. The Met Office undoubtedly hopes that it can point to the passing of the 1.5°C ‘guard-rail’ in short order. This is junk science-on-stilts, and is undoubtedly driven by the desire to push the Net Zero collectivist agenda.
In a paper led by Professor Richard Betts, the Head of Climate Impacts at the Met Office, it is noted that the target of 1.5°C warming from pre-industrial levels is written into the 2016 Paris climate agreement and breaching it “will trigger questions on what needs to be done to meet the agreement’s goal”. Under current science-based understandings, the breaching of 1.5°C during anomalous warm spells of a month or two, as happened in 2016, 2017, 2019, 2020 and 2023, does not count. Even going above 1.5°C for a year in the next five years would not count. A new trend indicator is obviously needed. The Met Office proposes adding just 10 years’ past data to forecasts from a climate model programmed to produce temperature rises of up to 3.2°C during the next 80 years. By declaring an average 20-year temperature based around the current year, this ‘blend’ will provide ”an instantaneous indicator of current warming”.
It will do no such thing. In the supplementary notes to the paper, the authors disclose that they have used a computer model ‘pathway’, RCP4.5, that allows for a possible rise in temperatures of up to 3.2°C within 80 years. Given that global warming has barely risen by much more than 0.2°C over the last 25 years, this is a ludicrous stretch of the imagination. Declaring the threshold of 1.5°C, a political target set for politicians, has been passed based on these figures and using this highly politicised method would indicate that reality is rapidly departing from the Met Office station.
Using anomalous spikes in global temperature, invariably caused in the short-term by natural variations such as El Niño, is endemic throughout mainstream climate activism. ‘Joining the dots’ of individual bad weather events is now the go-to method to provoke alarm. So easily promoted and popular is the scare that an entire pseudoscience field has grown up using computer models to claim that individual weather events can be attributed to the actions of humans. ‘Weather’ and ‘climate’ have been deliberately confused. Climate trends have been shortened, and the weather somehow extended to suggest a group of individual events indicates a much longer term pattern. Meanwhile, the use of a 30-year trend dates back to the start of reliable temperature records from 1900, and was set almost 100 years ago by the International Meteorological Organisation. It is an arbitrary set period, but gives an accurate temperature trend record, smoothing out the inevitable, but distorting, anomalies.
By its latest actions, the Met Office demonstrates that the old-fashioned scientific way lacks suitability when Net Zero political work needs to be done. Trends can only be detected over time, leading to unwelcome delays in being able to point to an exact period when any threshold has been passed. Whilst accepting that an individual year of 1.5°C will not breach the Paris agreement so-called guard-rail, the Met Office claims that its instant indicator will “provide clarity” and will “reduce delays that would result from waiting until the end of the 20-year period”. The Met Office looks forward to the day when its new climate trend indicator comes with an IPCC ‘confidence’ or ‘high likelihood’ statement such as, “it is likely that the current global warming level has now reached (or exceeded) 1.5°C”. In subsequent years, this might become, “it is very likely that the current global warming level exceeded 1.5°C in year X”.
Why is this latest proposal from the state-funded Met Office junk science-on-stilts? A variety of reasons include that climate models have barely an accurate temperature forecast between them, despite 40 years of trying. Inputting opinions that the temperature of the Earth might rise by over 3°C in less than 80 years is hardly likely to improve their accuracy. There are also legitimate questions to be asked about the global temperature datasets that record past temperatures. Well-documented poor placing of measuring devices, unadjusted urban heat effects and frequent retrospective warming uplifts to the overall records do not inspire the greatest of confidence. At its HadCRUT5 global database, the Met Office has added around 30% extra warming over the last few years.
Chris Morrison is the Daily Sceptic’s Environment Editor.
My favorite was Dessler saying that if observations differed from model output the observations must be wrong. That’s where they are heading.
Heading? I think we’ve been there for some years.
There are many problems with real world data. There are gaps in the record, issues with equipment changes, macro and micro site changes. It’s a real mess. On the other hand, models suffer from none of these problems, therefore model data must be superior to real world data.
/sarc**2
If the starting point is 1850, I believe a back of an envelope estimate of the warming until 2023, based ONLY on the ECS of CO2 from the HITRAN database, would be more accurate than surface temperatures, especially from 1850 with few land thermometers, and fewer ocean measurements, almost entirely in the Nothern Hemisphere.
Even more useful would be to just accept the fact that climate constantly changes through every lifetime of every human who ever lived on our planet, summer are warm, and winters are cold, That
is just the way it is on Earth. Now get on with your life or move to another planet.
Until some genius decides to tweak the algor ithem.
Where and when did he say that, please?
Can you link to your source?
I think it may have been on a twitter feed but not sure. It is, however, representative of some ‘scientists’ that have publicly said that observations may be wrong and a theory or model may be more accurate – check the internet, lots of examples. I think climate enthusiasts don’t like real world observations as they’re messy and don’t fall into neat little boxes like computer models do (I know several computer programmers that think along similar lines).
Oh dearie me, the little putz hasn’t been paying attention again. !
Dessler is so stupid he actually debated Climate Realist Steven Koonin and made a complete fool of himself with the usual wild guess predictions of doom and appeals to authority logical fallacies.
This despite the fact hat Koonin is a scientist and not a good debater — too polite when Dessler spouted nonsense … repeatedly.
I’m sure there was an article here on the debate.
I think I saved a screen shot of it but it was so many years ago it would take me longer than I have time for to find. I think it was in a blog discussion in either Climate of Doom or “And Then There’s physics”.
Ditch Actual Measured Temperatures and rely on Model Temperatures…
DON’T LOOK UP!
There was an article a few years ago, I think here, that Canada declared the last 100 years of temperature data unfit for purpose so model projections of the past 100 years were replacing the measured data in the official climate record. I haven’t seen an mention of that since. Has it happened?
Yup. https://torontosun.com/opinion/columnists/goldstein-feds-scrapped-100-years-of-data-on-climate-change
At one time, you could get historical temp records from across Canada since the given weather station was installed at weatherstats.ca/metrics/temperature.html. However “Environment Canada” was renamed “Environment and Climate Change Canada” presumably to emphasize their new woke attitude. Many of the stations did not show the universal warming claimed by the new “Climate Change” part of the department, so rather than continually fight with grumpy people armed with their own facts, EC found it expedient to find a reason to drop access to the old data and substitute data “homogenized” with the nearest Urban Heat Islands, and then during CoVid drop it altogether. So very 1984 ish.
Measured temperatures were ditched long ago in favor of “adjusted” and “infilled” temperatures, with the exception of the US CRN.
Very true
I would NEVER jump to the conclusion that USCRN is honest or accurate.
The integrity of the people who compile the numbers are just as important as the raw data.
It is puzzling that NOAA’s
NClimDiv is almost identical to their USCRN?
One has almost all land weather stations improperly sited, per analyses organized by this website
The other is allegedly 100% properly sited.
That either means siting does not matter, or NOAA can be trusted
Here is my scientific analysis:
NOAA is run by leftist government bureaucrats
Leftists can NEVER be trusted because they are pathological liars
Therefore NOAA’s USCRN should not be trusted.
Ed Reid, you should publicize your free Right Insight climate blog where you write many good, concise articles that often get on my blog’s daily recommended reading list.
The Right Insight – Scholarly News Commentary
“It is puzzling that NOAA’s NClimDiv is almost identical to their USCRN?”
Not at all.
It is very obvious that USCRN is controlling the ClimDiv values.
Try taking the difference between the two, and watch as Climdiv, which was a bit higher in 2005, has gradually been brough closer to matching USCRN.
The only logical reason for that happening is such a linear fashion is if it an intentional re-adjustment
US temperatures would be a LOT higher were it not for USCRN.
Maybe USCRN is adjusted
or
NClimDuv is adjusted
or
Both are adjusted
There is no way to know
If you don’t trust NOAA people, then you must not trust ANY of their numbers
That’s where I stand
Some “corrections” are now being made. One has to wonder why, when CRN are supposed to be the newest, most accurate, overengineered weather stations in the world.
According to this, you see adjusted temps, but have no way to know why. If there are problems, they should leave the filed blank and let folks decide how to infill if necessary.
https://www.ncei.noaa.gov/pub/data/uscrn/products/monthly01/readme.txt
Seize on this and build on it!
These Met Office people have conceded that their past, historic, instrumental temperature record is unfit for purpose.
It is so bad that it needs a change to something else.
If it is this bad, it is not fit for the purpose of claiming that global warming is real.
Policies like “net zero carbon” are built on sand, not upon the rock, is the logical inference. Geoff S
Missed the point Mr. Scientist
No matter how inaccurate the temperature numbers are, there was GLOBAL WARMING since 1975, not global cooling. Australia is only 1.5% of Earth’s surface, not 100%
Climate Howling predictions (of CAGW doom) only require a warming trend since 1975 as their “back up”. And they have that.
If the global average temperature statistic was perfectly accurate, and perhaps UAH is close, we would still be hearing predictions of CAGW climate doom.
The scary CAGW predictions are unrelated to historical average temperature trends, lab spectroscopy measurements of CO2, and even climate model (computer game) predictions for 70 years using RCP 4.5.
My point is predictions of global warming doom are not based on data. They are based on worst case assumptions and an unproven water vapor positive feedback with no limit theory. Without any data to support CAGW, the CAGW predictions are not science. Science requires data.
In addition, the CAGW predictions have been wrong since 1979.
The CAGW predictions are used to scare people and ramp up government powers, for which they have been effective propaganda.
Global warming from CO2 and other causes is real and is good news,
Warm is good
More CO2 is good
Cold is bad
Nut Zero is a waste of money
But if you are a leftist, Nut Zero is a strategy to control the private sector, which they love to do. And they don’t care what Nut Zero costs, or that it is infeasible or that few nations take CO2 emissions seriously.
Any society that thinks CO2, the staff of most life on our planet, is a pollutant, is a deranged anti-science society.
The Honest Climate Science and Energy Blog
Unfortunately if we switch to a hydrogen powered society any potential water vapor feedback induced by paltry warming will be indeterminate when compared to the massive quantity produced from a global population burning Hydrogen (which oxidizes into H2O)
According to the recently revised (Dec 2023) IEA ‘Global Hydrogen Review 2023’ annual production of hydrogen could reach 38Mt by 2030 if all announced projects are realised.
However 17Mt of this total is in projects at an early stage of development and only 4% of the 38Mt has reached a final investment decision (FID) Of the 38Mt 27Mt is based on electrolysis and low emission electricity and 10Mt on fossil fuels and carbon capture utilisation and storage (CCUS)
Any switch to a hydrogen powered society is some long time off
Maybe there will be enough excess solar energy to develop it once the Dyson Sphere is completed.
Forget hydrogen
Waste of money
Bad for gas pipelines
Forget fusion power
Coming in 10 years for the last 50 years
What we need is a perpetual motion machine to generate power
Bring on the non working Orbo from Steorn…not
I rather suspect the opposite, that AH2O vapor will be no more than noise against to what comes off the oceans daily.
Oh c’mon – you claim the warming has kept on going since 1975 with ‘adjusted’ and blatantly falsified temperature records as your only points of reference? How can you be sure that we didn’t start cooling after the warming period? What if the hiatus of the early 2000’s was followed by a gradual cooling, how on earth would we ever tell from the outrageous farrago of lies that comprise the temperature datasets?
Can you point to one unbiased or uncorrupted point of reference to support your ‘warming since 1975’ premise? Just one.
I trust UAH
I trust my instincts that SE Michigan where I live has significantly warmer winters with a lot less snow than in the 1970s, especially the past two winters. We LOVE warming here.
Either there is warming or cooling
The average temperature rarely stays in a flat trend
There is definitely not cooling since 1975 except in your imagination.
That may all change next year or in 10 years or 100 years
But there is a lot less snow shoveling here in SE Michigan and that is all we care about.
Yet apparently you don’t. Because UAH shows statistically significant warming.
ONLY at El Nino events.
There is absolutely NO human warming signal in the UAH data whatsoever.
It utterly destroys the AGW meme. !
The old El Nino tin hat conspiracy theory again.
Always ignore the La Ninas
Always ignore that the ENSO cycles are neutral in the 50 year long run
Always ignore that average temperatures revert to the long term rising trend after El Ninos and La Ninas.
I just wrote I trust UAH
Those words mean exactly what a normal person would think they mean
I never at any point wrote that there was ‘cooling since 1975’ – you made this up; basically you lied about me, made up something I’ve never written and humiliated yourself on a public forum. You stupid, self-serving, lying idjit.
“You stupid, self-serving, lying idjit.”
You noticed that too, did you 😉
I was willing to give him the benefit of the doubt until he shoved it in my face.
I prescribe sedation and a lobotomy for Mr. 5 degrees
Take your medications
“I never at any point wrote that there was ‘cooling since 1975’ – you made this up”
You provided the claptrap that I criticized. I did not have to make up anything.
You claimed that NOAA cooled the 1997 average temperature by 5 degrees F.. Total BS.
Cooling the past temperature would artificially increase the reported rate of global warming
Reverse that alleged 5 degree F. “adjustment: and the corrected numbers would show global cooling since 1997
Global cooling did not happen
NOAA did not lower the 1997 temperature by 5 degrees F.
And there was a warming trend since 1975 by EVERY methodology used to estimate the global average temperature.
That warming trend was 0.14 degrees C. per decade (UAH since 1979) and there is no indication that trend has ended, considering that the second half of 2023 is likely to be the warmest six months in 5000 years.
The author datamined some dataset and falsely claimed only +0.2 degrees C. warming in the past 25 years
I commented that the right nuber was 0.47 degrees C.
You started up with your alleged 5 degree F. cooling the past NOAA trick. Total BS
As a conservative trying to refute CAGW scaremongering since 1997, I can no longer tolerate BS or wrong data from other conservatives, which are a gift to leftist Climate Howlers. They are winning the CAGW propaganda war, and we have to be extra careful with our claims.
Curious question Mr Greene, would you rather have MORE or LESS snow shoveling per year?
Not warmer or colder trend
Not drier or wetter trend
(Climate is/was never stable/stagnant and will always trend either way)
Just MORE or LESS snow shoveling per winter season.
“If the global average temperature statistic was perfectly accurate, and perhaps UAH is close”
Sorry, Geoff, there can be no “accurate” global average temperature, because such a thing doesn’t exist. You can make an average and call it that, but that doesn’t make it so.
Exactly! Watch some of the animations on global temps. If the globe was warming why do warm and cold areas migrate around? If the globe was warming, one would expect warming locations to maybe expand, but not just move around.
The other issue is that GAT is made up of Tavg which should be declared unfit by itself. When I can see the same diurnal average in the Sahara Desert as in Topeka, KS, something is amiss.
________________________________________________________________
Same is true of GISTEMP. Two illustrations of that here and here.
So far this year GISTEMP has made 3,480 changes to their Land Ocean Temperature Index LOTI. By month that looks like this:
Jan Feb Mar Apr May Jun Jul Aug Sep Oct Nov Dec
365 236 345 248 238 384 371 251 380 369 293
These changes go on month after month year after year and result in the pattern illustrated in the two links above. The obvious bias cannot be denied.
The past temperatures change so much it is just as hard to guess the past temperatures as it is to guess the future temperatures.
And remember, the past temperature set the baseline for the mythical 1.5C warming.
So the more they adjust them downwards, the closer we get to CLIMATE CATASTROPHE (lol) !
We ARE close to a climate catastrophe: It’s called leftism and their deranged Nut Zero
I predict the US 1930’s dust bowl will eventually be revised to the 1930s snow bowl
And recall I predicted in 1997 that the climate would get warmer, unless it got colder. And I was right.
The past temperature basis is a VERY ROUGH estimate of the Northern Hemisphere average temperature in 1850 or 1880 that could be off +/- 0.5 degrees C. or MORE. No one knows
Charts at the link show locations of land weather stations in the old day. Not many of them outside US and Europe. Sea surface numbers are even worse.
The Honest Climate Science and Energy Blog: Sparse coverage of Earth’s land surface with land weather stations in the old days
This is Forrest Gump junk science
Bad historical statistics falsely claimed to have a +/- 0.1degree margin of error — could be 10 times larger
and wild guess data free predictions of global warming doom in 100 years, that have been wrong since 1979
That is a summary of the climate change movement. Their numbers resemble a bowel movement
You mean that can’t get precise past temperatures from tree rings and ice cores? They might do better studying the liver of a sheep.
Temperatures based on ice cores have a solid physical basis, namely the O-16/O-18 kinetic isotope effect. Tree rings, on the other hand, have no such basis.
but have they really proven that the results are accurate? and how accurate? are there any skeptics of the method? even if it’s good chemistry- won’t it give the temperature at that location, not the planet?
I don’t know- just asking questions. I remain a skeptic of all politics, religion, and even some supposed science. It just seems far fetched to think you can study ice cores and get accurate temperatures. There must be at least a few scientists who don’t agree?
You first need to assume that nothing ever affected the ice and that there is no movement of bubbles in the ice over thousands of years. I’m sure it’s been verified to show exact temperatures by M. Mann.
And that would be only at that site- unless the chemistry is more about the amount of CO2 and which isotope which might be worldwide- but then you’d need to correlate that with worldwide temperature. I think I asked about this a year or so ago and got some links- which I looked at but didn’t really understand. I’ll have to try again.
The bubbles are absorbed into the ice at a certain pressure, ie, at a certain depth in the ice core there are no bubbles. This seems to prove that there is movement of CO2 within ice.
The O16/O18 are accurate because they are calibrated with know correct proxies such as tree rings, pond pollen, coral growth from times before humans recorded such things, techy stuff like that.
known correct proxies?
Pretty sure he forgot a gigantic /sarc
sure, but- it’s probably the answer a climatista would give with a straight face- and certainly most “climate journalists”
One must wonder how scientists can believe ice cares from any location indicate global changes, yet when looking at CRN, make the statement that the U.S. isn’t indicative of the globe. A logical conundrum.
You can easily get the desired past temp from tree rings, just pick the right tree.
I think I did but it wouldn’t answer when I asked nicely!
Nor from air temperature thermometers.
The LOTI link in my 11:33pm post above is wrong, should have been LOTI
Bring back Michael Fish
He was always more careful after one particular incident.
Philip Eden who wrote for the Daily Telegraph years ago was the last of the decent weathermen.
https://en.wikipedia.org/wiki/Philip_Eden
I liked Ian McCaskill – a jolly fellow
A local TV station in Tampa FL is calling their weathermen “climate specialists”.
30-year weather is called the “climate” now.
John Kettley is a weatherman…
Freelance…
He is now but,
Sorry, it had to be done 😉
As it’s Christmas….
Good excuse as any! 😀
Wincey Willis is a weatherman????
Yes the first woman to become a weatherman, although that was before they went all PC and renamed them ‘weathercaster’s’.
I would trust the Old Farmer Almanac before I would their models.
Professor Richard Betts is a second-rate scientist. Because of his climate alarmist views he was promoted way above his ability. He is also very much a hypocrite.
Correction: third-rate.
Even a second-rate researcher would not come up with such a ludicrous idea.
May be better to rate him as a first class charlatan. Then he can claim, he’s been promoted.
He led a group off us on a walking tour in and around the University of Exeter. I found it interesting and asked him a number of questions and he hardly had an answer for any of them, usually he said something like “good question.”
At the end of the tour, he had us gather in a circle and he began an almost religion like somber rant on climate change, environmental degradation, etc., and he had tears running down his face at the end. My impression is that he’s a sincerely nice guy but a nutter, a literal tree hugger.
I Don’t Know?
“the target of 1.5°C warming from pre-industrial levels” So 359 AD would be considered “Pre-Industrial Times”. Spanish and Italian researchers recorded ratios of magnesium to calcite taken from skeletonized amoebas in marine sediments, an indicator of seawater temperatures, in the Sicily Channel. requests from the Intergovernmental Panel on Climate Change (IPCC) to assess the impact of historically warmer conditions between 1.5°C to 2°C warmer than today.
So reset that baseline, we have 3.0 to 3.5 °C more to go.
The Met Office proposes adding just 10 years’ past data to forecasts from a climate model
But when the Met Office unveiled their latest update:[Even Newer Dynamics for General atmospheric modelling of the environment (ENDGame)] they mistakenly made this comment.
New Dynamics has served us well over more than a decade: not only have we continued to improve the skill of our large scale forecasts at the rate of 1 day lead time per decade (so for example today’s 3 day forecast is as accurate as the 2 day forecast was 10 years ago) but we have seen the introduction of a very high resolution (1-1/2 km) model over the UK which provides unprecedented levels of detail to our forecasters.
So at this rate they will be able to get a 7 day forecast just a accurate as todays 2 day forecast in only 40 more years and 3,660 years to get to 10 year forecasts. Now if they could just get an accurate 2 day forecast they might have something to sell.
Is this the same “Richard Betts”, who heads the Climate Impacts area of the UK Met Office, claims his areas of expertise as a climate modeler and was one of the lead authors of the IPCC’s 5th Assessment Report (WG2). Says –
“Everyone (Apart from a few who think that observations of a decade or three of small forcing can be extrapolated to indicate the response to long-term larger forcing with confidence) agrees that we can’t predict the long-term response of the climate to ongoing CO2 rise with great accuracy. It could be large, it could be small. We don’t know. The old-style energy balance models got us this far. We can’t be certain of large changes in future, but can’t rule them out either.”
So the Plan is based on “We Don’t Know.”
It always has been. They’re guessing based on knowing less than a quarter of the mechanisms and data, much of which is wrong anyway.
what is going on inside these people’s heads – they really are demented
They’re on a mission….
They are going to save the world from the evil that has polluted it for years; nothing to do with climate change, they are socialist footsoldiers in a war to crush capitalism and the free market economy, installing a Socialist World Government over all of us. I wish it were just a bonkers conspiracy theory but I fear that that’s exactly what these people want. The only saving grace for us is that they were easily duped – they are mediocre minds who are, quite frankly, inept bungling idjits on the whole.
idjits with big guns
Bloomberg estimates $200 trillion to stop warming by 2050.
The millionaires and billionaires are planning on getting a big chunk of that.
They are the ones who own the media, control the politicians with campaign contributions, and the researchers with their grants.
Big-time money dreams.
I could have predicted this.
We all could have predicted this if we weren’t used to thinking that they were well-meaning but politically biased professionals. I’m leaning more and more towards them working within a solely political agenda, not slightly biased but completely captured by, let’s face it, a socialist agenda.
The rich people who own the media are the ones promoting the so-called “climate” agenda.
It has nothing to do with politicians seeking more power?
It has nothing to do with scientists seeking to promote their own careers?
It’s always some rich guy somewhere.
That’s the wonderful thing about
global warming climate change global boilingWeather Weirding. There’s something in it for everyone:Governments need new taxes – Weather Weirding
Didn’t use proper forestry practices and have big fires – Weather Weirding
Raise Insurance Rates – Weather Weirding
Inflate the currency and cause price increases – Weather Weirding
Mediocre scientist and need to get published – Weather Weirding
Ask me about it’s link to cancer or if it kills puppies…
‘Paris’ was 2.0degsC not 1.5. Where did 1.5 come from? Was it because reaching 2.0 was going to take a long time so we need to up the scare? What about the IPCCs SR1.5 issued just before the failed Katowice COP? Drivel. Excoriated. “Give up coal in 12 years”. And I’m one of the nineteen people in the world who have read it
The state of Wokeachusetts says this state is already about 3.5 deg F above a century ago. Strange, but I don’t see any emergency.
A century ago was just coming out of the Little Ice Age.
Over twenty percent of the land is still frozen.
“Where did 1.5 come from?”
It was purely arbitrary. Completely made up and as phony as Hans Schnelnhuber’s “tipping points.” It fulfilled a political agenda and nothing else. There was no and is no scientific basis for any of these.
Back in the 80’s, everybody was concerned that there were millions of hungry children in the US. I don’t remember the exact number. The number originated from the testimony of an activist in front of congress. He was asked how many children were going hungry every day.
He later admitted that he didn’t know, so he just made up a number on the spot.
What is it about left wing activists and their willingness to just make things up?
You can’t promote leftism by telling the truth
“Was it because reaching 2.0 was going to take a long time so we need to up the scare?”
I think that is exactly why they came up with 1.5C, instead of the 2C previous supposed tipping point. They pulled the 1.5C figure out of thin air.
Now you can understand why l have such doubts about the Met Offices claims for means temps over the summer which l expressed in a post a few days ago.
They are not to be trusted without question.
They are not to be trusted; period.
Exactly.
They are in the business of lying. Stephen Schneider explained it all about 15 years ago. None of them are innocent. As participants in the fraud called UNFCCC, all of them are dishonest, as this is all about partisan politics. We must always remind ourselves that IPCC is a political organization that has nothing to do with science.
“We have to offer up scary scenarios, make simplified dramatic statements, and make little mention of any doubts we may have. Each of us has to decide what the right balance is between being effective and being honest.”
I previously recommended this article on my blog’s recommended reading list despite a large error that was not important for the main point of the article.
But I wish conservatives would be more careful when using data that the Climate Howlers can fact check and then completely ignore the main point of the article.
From the article:
“global warming has barely risen by much more than 0.2°C over the last 25 years”
I normally do not like El Nino years as a start point for a trend, but both 1998 and 2023 had strong El Ninos, so that’s okay.
The official surface data say 2023 is +0.44 degrees C. warmer than 1998, not the +0.2 degrees C. stated on the article. That is a large mistake. (Not) “much more” than 0.2 C.” (degrees) was a deception.
1998 to 2023 = 25 years
+0.66 vs.+1.13 = +0.44 degrees C.
DATA SOURCE:
Climate Change: Global Temperature | NOAA Climate.gov
+0.47 degrees C.,
not 0.44 degrees C.
It’s 5am
I can’t subtract numbers
My dog ate the papers
Now isn’t that just weird. I thought that, since 2023 isn’t actually over yet, we should probably use 1997-2022 as the 25 years. So, with all good intentions, I looked up the global average temperature for 1997 and came across the NCEI/NOAA ‘Annual 1997 Global Climate Report’ which gave the Average Global Temperature for 1997 as 62.45°F. I then checked the global average temperature for 2022 which gave me a figure of 1.55°F over the 57°F average, which I took, not unreasonably, to be 58.55°F.
So, according to what I dug up, we’ve cooled by 3.9°F – apart from the flippin’ obvious (that we are being systematically lied to) what am I missing from this? Either NCEI and NOAA were lying when they produced the annual report for 1997 or they are lying now, hiding the truth behind the ‘anomaly’ smokescreen – or are we, in actual fact, cooling?
Dishonest data mining
The warming of +0.14 degrees C. per decade since 1975 has not ended. Data mining can distort the long term trend.
???
How is this ‘dishonest data mining’ pray tell?
The information was taken from the official NCEI/NOAA annual report on the climate 1997 and the official GAT of 2022 by NOAA – all official, widely published and accepted data.
Now you tell me why they should differ so much when, according to your 0.14°C/decade and building on the official data from NCEI and NOAA from 1997, the 2022 GAT should be 17.3°C/63.1°F or 6.1°F above the 57°F average instead of the published 1.55°F above the 57°F average?
Why, Richard? Why is there such a big discrepancy in the official data sources?
Because 30 or more years is climate and you reported a shorter term weather trend, as did the article, which also used awrong number.
The dataset goes back to the beginning of the current global warming trend in 1975 and the +0.14degres per decade is a trend line of 48 years of climate change that appears to still be in progress … but has no value for predicting the next 48 years, IMHO
You get one demerit for data mining and another demerit for trying to defend data mining. That’s two demerits. You have a long way to go to catch up with me, with 748 demerits issued by the wife since 1977, for various real and perceived offenses.
I am not data mining you buffoon. I want you to tell me why there is a huge discrepancy in the numbers. Look, forget about start dates and end dates, just comment on the difference between what we’re being told now are the ‘correct’ temperatures and what were the official, ‘correct’ temperatures from before 2000.
Why have NCEI/NOAA now got the 1997 GAT at 0.86°F above the 57°F average (57.86°F) when they previously and officially had it at 62.45°F? This is not cooling the far past to make the present warmer, something is seriously wrong if they’re having to ‘disappear’ nearly 5°F less than 30 years ago to maintain the fiction of the 0.14°F warming trend. I’m not data mining to make some strange point, I’m honestly trying to make sense of this.
You call me a buffoon, then you are a deputy assistant buffoon
The UAH dataset claims a +0.14 degree C. rising trend since 1979 (sorry I typed 1975 previously)
There is no logical reason to present an AVERAGE WEATHER subset of those data, of less than 30 years, which is significantly different than the long term CLIMATE trend
Which you did, and the author did, and he also wrote the wrong number. I’ll trust your numbers even though you now have three demerits.
The only reason justifying data mining the UAH record would be to report there were 8 years with no warming trend from 2015 to mid–2023, as Monckton used to do here. I criticized him for not including a second chart of the WHOLE UAH record and he did that for all his next articles.
You apparently are a slow learner or you just enjoy data mining.
Richard we appear to be talking at cross purposes. You appear to be firmly fixated on a trend between 1997 and 2022 or 1998 and 2023 whilst I am trying to work out why NOAA have cooled their official global average temperature for 1997 by nearly 5°F? Are you going to answer with something about this question or are you going to continue your tomfoolery and childish ‘demerits’?
NOAA claims the global annual temperature increased at an average rate of 0.08°C (0.14°F) per decade since 1880 and over twice that rate (0.18°C / 0.32°F) since 1981.
NASA-GISS and HadCRUT data get the most attention
What is the global average temperature absolute?
The 2022 surface temperature was 1.55 °F (0.86 °Celsius) warmer than the 20th-century average of 57.0 °F (13.9 °C) and 1.90 ˚F (1.06 ˚C) warmer than the pre-industrial period (1880-1900)
NOAA has NOT cooled their official global average temperature for 1997 by nearly 5°F?
The 62 degrees F. you referenced was for the Summer of 1997, NOT for the whole year.
Yoi get another demerit and a demotion to executive washroom attendent, left side stalls.
In fact, if there are inaccuracies, it is too much warming in the NASA-GISS and NOAA global average temperature trend, when compared with UAH which has much better coverage, far less infilling and trustworthy volunteer scientists compiling the data.
If that was the case, that it was just for the summer of 1997, why was it repeatedly referred to as the ‘annual average temperature’, the ‘1997 annual global average temperature’ and ‘1997 global temperature’. Sorry Richard, you’ve lied one too many times with this.
“The only reason justifying data mining the UAH record would be to report there were 8 years with no warming trend from 2015 to mid–2023”
You could also report that there was no warming from 1998 to 2015, going by the UAH satellite record.
NASA and NOAA, on the other hand, bastardized their surface temperature records and claimed that the nine years after 1998, were the “hottest year evah!”, each year being hotter than the last, according to these charlatans.
It’s all a big lie, of course. If you look at the UAH satellite chart you will see that NONE of the years after 1998, were warmer than 1998, until we get to the year 2016, which was one-tenth of a degree warmer than 1998.
So NASA and NOAA were lying about the years after 1998 being hotter than 1998, and being the “hottest year evah!” and they did so to try to scare people into going along with their human-caused climate change narrative.
https://www.pbs.org/wgbh/frontline/article/2014-was-the-warmest-year-ever-nasa-and-noaa-say/
“But the main takeaway, say climate scientists, is not that 2014 (note this article was writen in 2015) was the warmest on record, but that it continued an even longer-term trend of rising global temperatures. Nine of the 10 hottest years on record have occurred since 2000, according to NOAA, and of the top 20 warmest years on record, 14 have occurred since the turn of the 20th century.”
end excerpt
And, of course, that statement is one BIG LIE.
Here’s the UAH satellite chart. See if you can find any years between 1998 and 2016, where the temperature is warmer than 1998. You can’t find even one because there isn’t one. NASA and NOAA are lying to you. What do you think about that? Official government agencies mannipulating the data and lying to the American Public for personal and political gain.
Are linear trends even worth talking about in a cyclic process?
Up pr down is good enough for me
I don’t live in the average climate.
I prefer up over down.
I had noticed. Your up is down.
That’s five demerits Page
I’m sure your wife must love these games of yours but I’m not playing. You can keep your ‘demerits’ and your tomfoolery to yourself.
Scientifically, no.
Practically, to argue with people with rigid minds, you can do better if you talk their lingo, bad as it is. Geoff S
Only when you cherry pick the start and stop date to suite your purposes.
No! Too many confounding cycles of different variables. Oceans, sun, orbital, etc. to what is going on from even 60 years of only temperature. Climate science pointedly disappear when the term enthalpy comes up. Why have no research been done trying to arrive at enthalpy changes over the last century? It’s not like humidity has not been reported for much of the last century and the current century.
It’s much easier to do a calculation on max and min. Enthalpy would require some work.
Been following this since 2009 with a H/T to Nick at WUWT for the original find.
You are correct on the 1997
(1) The Climate of 1997 – Annual Global Temperature Index “The global average temperature of 62.45 degrees Fahrenheit for <b>1997” = 16.92°C.</b>
http://www.ncdc.noaa.gov/sotc/global/1997/13
But have to dig a little to get 1998.
(2) http://www.ncdc.noaa.gov/sotc/global/199813
Global Analysis – Annual 1998 – Does not give any “Annual Temperature” but the 2015 report does state – <i>The annual temperature anomalies for 1997 and 1998 were 0.51°C (0.92°F) and 0.63°C (1.13°F), respectively, above the 20th century average, </i> So 1998 was 0.63°C – 0.51°C = 0.12°C warmer than 1997
62.45 degrees Fahrenheit for 1997″ = 16.92°C + 0.12°C = for <b>1998 = 17.04°C </b>
Thru 2006 NOAA was still reporting 1998 as the High Temperature year.
Someone, some time, some where, changed the numbers and rankings.
Yep. That was my thinking. Why, though? The only reason I can fathom is because they have to – they can’t immediately change much of this years temperature, without people noticing, so they must bring past temperatures down into line. And the only reason to do that is if we’ve been cooling for a few years.
“Thru 2006 NOAA was still reporting 1998 as the High Temperature year.
Someone, some time, some where, changed the numbers and rankings.”
I think that happened somewhere around 2007. That’s when James Hansen started trying to downplay the warmth of the 1930’s. Previously he said 1934 was 0.5C warmer than 1998, then about 2007 he changed his tune and said 1998 was warmer that the 1930’s.
I think Hansen is a True Believer and he thought that the warming up to 1998 was caused by CO2, and he thought that the warming would continue beyond 1998, because more CO2 was going into the air every year.
But, despite more CO2 going into the air, the temperatures after 1998 started cooling and cooled right up to 2016.
Hansen started backtracking on the 1930’s being the hottest decade, and NASA and NOAA started mannipulating the surface temperature record to make it appear that the temperatures were getting hotter and hotter with each successive year.
Of course, the UAH satellite chart shows a completely different picture, and shows no years after 1998 as being warmer than 1998, much less warmer than the 1930’s.
So Hansen and NASA and NOAA started lying about the 21st century surface temperatures in order to keep their human-caused climate change narrative going.
Btw, a colleague of Hansen told Hansen (via a Climategate email) that he agreed with Hansen’s estimate that 1934 was 0.5C warmer than 1998. According to his data, he had the 1934, difference at 0.49C warmer than 1998.
I often wonder what Hansen’s colleague thought about Hansen later suddenly claiming 1934 was nothing special.
NASA and NOAA have been lying to the American people about the climate for years in furtherance of their political/personal agenda.
Their lies have cost, and will cost, the Western Democracies TRILLIONS of dollars and may end up destroying our societies in the process.
These are very serious crimes. Serial killer type crimes. Perpetrated by a small cabal of temperature data mannipulators with a political agenda. These people should pay for their crimes against Humanity.
1998 was an El Nino year with a temperature anomaly of almost 1 degree. You are comparing with an outlier. Naughty!
I was A JUVENILE DELINQUENT AS A CHILD BUT AM NOW TOO OLD TO BE NAUGHTY.
I did not start the comparing of 1998 with 2023.
The author compared 1998 with another year also with a large El Nino — 2023 — which is a fair comparison if you must data mine, which can also a deception.
The author grossly underreported the warming from 1998 to 2023 which was +0.47 degrees C. in the surface data.
The +0.2 degrees C. in the article was an exciting number for Climate Realists to tell all their friends … if it was correct, but it was far from reality.
We conservatives can’t afford to promote BS numbers. Leftists own that job.
“I was A JUVENILE DELINQUENT”
Nothing changes, does it !
We already have the media reporting model projections that never happen as if they are real events and they then enter the collective memory as such.
A day to day perception of climate change is thereby falsely inserted into the minds of the populace.
That is witchcraft rather than science with the models in place of runes.
I demand temperature numbers that are
Infilled
Homogenizes
Pasteurized
Time of day adjusted
Seasonally adjusted
Smoothed
Fried, dyed and laid to the side
Aged in a wood barrel for ten years
and finally
Adjusted with a FUDGE FACTOR
needed to get to the number
that the boss wanted to see
in the first place
before all the calculations.
It would be cheaper to use a cofuser game (computer model) random number generator
Although I’d recommend hiring a pretty female model to pick a number out of a hat.
I bet even those numbers would display a gradual temperature increase when run through Climate Model AlGorithims
Is it true that Neil Ferguson’s BSE and Pandemic models will be adapted for this purpose. Or did the University of East Anglia get the job?
This great Dilbert cartoon explains the recommended MET process for the global average ocean temperature, which no one cares about except some fish, and they can always swim away from the equator if the water is too hot:
Dilbert is at this URL if it doesn’t show up below:
The Honest Climate Science and Energy Blog: New ocean temperature measurement methodology
https://blogger.googleusercontent.com/img/a/AVvXsEiTyFH8ORacnk3865NK5dYIqnu45WoO_cL4B_ej0xL5a0OLfoB5OUMsSycaamYOg4Dv3IrrJbmJUn_-sWMNnMcPTCAnPfPE4SOi97gil0GGf6YSb2nPvQ8aotZIN7AgmtAOzEBFfagJaPiYQb4Y3VaSfqgfnE05od8tF4BMbdYAvMIf1o_QIgrW1c6e4KVz
Currently the BBC weather are claiming that there is near record high warmth for Chirstmas Eve.
So l want online to Zoom Earth to check the current temps in my local area and they were claiming they are at 14C. That looked rather high to me for mid-morning.
So l got my manual therometer out and put it out on the north facing window sill of a unheated room over the last half hour, and guess what! its only showing the temp to be 12.6C.
The BBC have noted your objection and have issued a response:
Maryam Moshiri may well be looking for alternative employment in the New Year…
Germany has places with temps around 10-12°C today.
Krishna Gans
l don’t doubt that its mild for the time of year, l just doubt that its as warm as the BBC weather claims it to be. While my therometer has shown l was correct to have doubts about their claims.
That’s why it’s a bit warmer:
According to the Central England Temperature (CET) data, 2023 is shaping up to be the second warmest year on record which starts in 1659. It’s just behind the current record warmest year, 2022.
The Earth is still in a 2.56 million-year ice age named the Quaternary Glaciation, in a warmer but still cold interglacial period that alternates with very cold glacial periods. Twenty percent of the land is still frozen either as permafrost or underneath glaciers.
Good to know.
You don’t know….. anything…
… that is your problem. !
You seem determined to remain stupidly ignorant.
Every asshole needs but a single thermometer.
Any need to resort to this sort of language? Honestly.
The global warming since the 1600s, especially the cold 1690s, should be celebrated in Central England.
Hurray!
“In the context of the last few centuries the summer of 2022 in Central England/ England and Wales was hot and dry. But it was not exceptionally so. The summer of 1976 and 1995 were both substantially hotter and drier”
https://mikehulme.org/the-2022-uk-summer-in-long-term-perspective/
The ‘summers’…. When it comes to annual average temperatures, later is warmer.
Also been an increase in Sunshine hours.. a very good thing of the Poms !!
There is also a population-based warming trend as shown by comparison with Valentia.
NO EVIDENCE of any warming from human CO2 though…
… as you would now be well aware if you were capable of any rational thought or understanding.
Thank goodness for the SLIGHT warming since the coldest period in 10,000 years.
Did you know that they used to grow wine grapes in the north of England, where they can’t grow them now.
Did you know that trees DO NOT grow under glaciers ?
Did you know that only 1000 or so years ago, tree lines were significantly further north, and higher up mountains.
Or are you intent on remaining an ignorant CLIMATE CHANGE DENIER !!
I think the Gulf Stream makes the UK and the Central England Temperature data unrepresentative of the rest of the world.
The UK has a unique environment created by the Gulf Stream. I watch cold fronts die all the time right before they reach the UK. They just kind of dissipate as they get close. Not all, but a lot of them do.
Same experience. This year’s summer my own thermometer read over 3 degrees centigrade less than their predicted ‘heat wave’. and ‘hottest day ever’.
We are being systematically lied to in order to protect their precious warming trend. I am slowly coming round to the idea that we aren’t warming at all but are, in fact, cooling and have been for a few years now. If that’s the case then the cooling is likely to increase and this modern ‘hide the decline’ is going to backfire badly but how many will die in the meantime because we didn’t know to prepare?
Don’t Look
Upat your thermometersThe Sun has entered a Grand Solar Minimum and NOAA is predicting the Sunspot Number, which reflects solar output, to start dropping in 2025 and continue dropping until it reaches zero in 2040 when their forecast ends.
https://www.swpc.noaa.gov/products/predicted-sunspot-number-and-radio-flux
Upvoted you again. You provided a legitimate link, and honestly reported what it says.
I’m going to assume that the down voters didn’t go there, just said “Ridiculous!” and moved on.
It is ridiculous – even more ridiculous than any of the other “forecasts” that I’ve seen coming out of NOAA.
Unless the next scam is “All of this nasty CO2 is going to extinguish the fires of the Sun! Panic harder! We need to fund the biggest Zippo lighter ever!”
No, the downvoters reacted this way because he does this on every article he can find and most us have read the exact same post of his over a dozen times already. Even a bot would vary it a bit.
Is that just like a feeling you’ve got? Every global data set we have, surface or satellite, land or ocean, is setting new monthly warmest records right now and has been for months. December will also set new warmest records globally.
Take a look at the UAH chart on the side panel here at WUWT. Does that look like it’s been cooling in recent years?
And I’m thankful for that. We have a long way to go to get to more optimum temps and the higher and better atmospheric co2 level that is driven by that higher temp,
I went all the way back to the official NCEI/NOAA ‘Annual 1997 Report on the Climate’ which gave the Global Average Temperature for 1997 as 62.45°F. Then I checked the NOAA website which is regularly updated and found they had the Global Average Temperature for 1997 as 0.86°F over the 57°F mean average. That means that NOAA, since publishing the official 1997 Annual Climate Report, have cooled the official temperature by a little over four and a half degrees. Why would they do that, I wondered? Surely they aren’t trying to tell us that the thermometers of 1997 were primitive, incredibly inaccurate ones that belong in a museum not in service? Then it occurred to me that this might be the only way to preserve the 0.14°F warming trend they’ve been trumpeting for the last couple of decades in a cooling trend. Why else would they need such a massive ‘adjustment’ to the temperature record just 26 years ago? Why else?
Richard Greene wouldn’t answer any of those questions when I asked earlier, in fact he did his best to avoid them entirely so I’d probably have to ask him what he’s been drinking? Been swilling the kool-aid, have we, Richard?
Did you look at the UAH data? You seem to be avoiding any mention if it. Are the satellite instruments also affected by a spurious warming,
I didn’t look at any datasets at all, I simply found two differing figures for the same 1997 GAT in an official NOAA/NCEI report and on their website and I don’t think this was an error, misprint or typo. I think that sometime between then and now, NOAA have adjusted the 1997 temperature downwards by nearly 5°F.
I just wanted to know why they would do that within a 26 year timeframe?
Right, and you concluded from not checking anything at all that it must be cooling, because… what? You want it to be?
This is ‘Richard World’ we all live in, right?
“Right, and you concluded from not checking anything at all”
But that’s not what Richard said, was it. He did check something. Something that showed a discrepancy between two NOAA/NCEI claims.
Your failed effort to discredit Richard is noted.
No, UAH is strong affected by El Nino events.
Even a moronic idiot like you must have realised that by now.
There is actually no evidence of any warming apart from this EL Nino events.
If the NOAA website claims the absolute global average temperature was 62.45 degrees F. and that was not the average summer temperature in 1997, then they were obviously wrong. I’m sure it is not the first error in a NOAA document.
You are hanging onto this error like a junkyard dog with a bone. Give it up or you will have to be sedated.
Have a peaceful Christmas day anyway and don’t let my trash talking bother you. Al Gore invented the internet for trash talking.
I haven’t even mentioned NOAA; you did that all by yourself.
What you are failing to address is that UAH, the WUWT poster-child of climate data sets, says more or less exactly the same thing as all the surface data sets.
Statistically significant and on-going global warming.
What say ye to that, RG?
From El Nino events only.
You still haven’t been able to present one tiny iota of evidence of any human causation.
And you KNOW won’t be able to.
I reckon even you have figure that out by now.
Oh, the magic ENSO that only warms and never cools. Lol!
“Does that look like it’s been cooling in recent years?”
Yes, there was definite COOLING in UAH data since the last El Nino.
Were you ignorant of that fact. !!!
Took another major El Nino release to stop that cooling trend.
“I am slowly coming round to the idea that we aren’t warming at all but are, in fact, cooling and have been for a few years now.”
What are you drinking?
The last six months of 2023 will be the warmest six months in 5000 years, globally, based on the best record available.
Please no climate predictions — we already have enough of them from leftists. Always scary. Always wrong.
Colder is bad news
At least predict warmer if you have to predict anything.
What are you drinking?
We are currently warmer than the Medieval, Roman, Egyptian and Minoan warm periods? Not according to any data set I’ve ever seen?
We are almost certainly warmer in the last six months of 2023 and probably warmer for the past 10 years.
Local proxy climate reconstructions have large margins of errors. They also have lower variations when averaged to create a fake global average.
The reconstructions claim the prior warming periods, after the Holocene Climate Optimum ended 5000 years ago, were about +0.5 degrees warmer than the past 10 years. That claim is statistically insignificant and proves nothing.
THERE IS ALSO NO DEFINITIVE PROOF THOSE WARMING PERIODS WERE COEPLETELY GLOBAL
I do not believe in global conclusions based on inaccurate, questionable local proxy data.
Richard Page,
I monitor Australian temperatures for signs that our warming is ceasing. Geoff S
https://www.geoffstuff.com/uahdec2023. jpg
Happens every time! Who inserted a space?
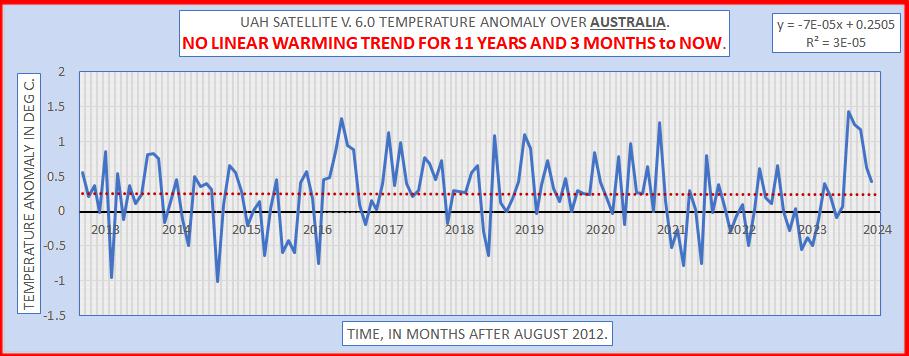
Every time this Australia UAH chart gets pushed here it has a new start date.
A couple of months ago it started in March 2012; but I guess we’ve moved on.
There’s you hilarious totally lack of any mathematical comprehension.. et again
Why do you like making an abject fool of yourself ?
Oh and are you STILL running away like a headless chook from saying how much warmer it must have been for forests to have grown where now there are glaciers.
You continue to make a fool of yourself by constantly and cowardly running away.
Best the little fungus can do is press the thumbs down.
That is its life !!
So what does it say if you put it outside?
If heat pumps struggle to maintain 12.6°C inside I think I’d rather have Gas Central Heat
l did put the therometer on the outside window sill so l could see the outdoor temp from inside the room. The heating was off in the room as it was in use at the time and the weather was mild.
sorry ” as the rooom was not in use at the time”
Just a update the temp for the day peaked in the early afternoon at 13.7C when the sun come out for a few minutes. But soon settled down to around 13C when the cloud cover came back.
At no point did it reach the 14C mark as the BBC weather were claiming was happening over the late morming and early afternoon
13.7C is essentially 14C, given that your garden is NOT the UK.
What do you want the UKMO to do, give 13.7C as the max for the day!
FYI: I took the dog out yesterday at 12:30pm and the thermo on my north wall read 14.4C.
Checking the Wetterzentrale obs page it gave this for 1pm ….
It obviously(?) depends on where in the UK you live.
I live in NE Lincs.
Yep here on South Coast of England been showing 12c all day
Their normal is around 1880! Europe was an ice cube.
This is the time Monet painted ‘Breakup of ice Grey Weather
depicting thick ice flows on the river Seine just west of Paris.Americans remember it as the 'Long/Hard Winter.
Is this their target climate? maybe we should bring back Cholera and Typhoid just for good measure.
My fridge is warmer now than it was back then!
Just check on the Mississippi River at Vicksburg in February 1899.
No river traffic. The temperature had dropped to 10 degrees below zero, some of the lowest in Vicksburg’s recorded history. Photo from the Old Court House Museum Collection
Similar thing happened in 1951
Tony Heller does get rather heavy breathing on his reporting of the cooking of temperature “records”, but he is essentially right.
So does the Met Office have it’s HQ, at Stradivarius House?
At least they’ve acknowledged the real-world data doesn’t match their computer-game guesses.
Betts ids one of a group of eight names successfully censoring a peer reviewed and published article by Alimonti et al. earlier this year, circumventing the scientific process like it was done by the catholic church in the middle age:
The names of these people are:
Greg Holland, Lisa Alexander, Steve Sherwood, Michael Mann, Richard Betts, Friederike Otto, Stefan Rahmstorf and Peter Cox
Details of the story can be found here:
https://rogerpielkejr.substack.com/p/think-of-the-implications-of-publishing
If a story like that was made up in a novel I would discard that book as far stretched outer worldly trash, especially given that at least three of those names should tippie toe very carefully IMHO when it comes to scientific achievements and ethics. Oh, they won the prices, but did they deserve any of them?
UK Met Office future plans appear to have been lifted directly out of the pages of George Orwell’s* book 1984.
In that book, the totalitarian regime of Oceania is able to manipulate their citizens into believing anything, which gives the regime as much power as they could possibly want. Substitute “UK Met Office” for “Oceania”, and there you go.
*N.B.: Eric Arthur Blair was an English novelist, essayist, journalist, and critic who wrote under the name George Orwell.
Right here we have a website that convinces people to disbelieve the evidence of their own experiences.
Who’s being fooled here, exactly?
“Who’s being fooled here, exactly?”
YOU.. ALWAYS. !
TFN,
To avoid leaving the impressions that you yourself are a total
foolidiot, please cite any “experience” you’ve had that disproves any of the evidence presented in articles provided at the WUWT website over, oh let’s say, the last five years.I’ll wait for such . . . but not too long for it is a simple question for a simple mind.
See numerous recent articles (often emanating from the ironically named ‘notrickzone’) that highlight cool spots around the world whilst ignoring the much more plentiful warm regions that are collectively contributing to the recent and on-going monthly warm global temperature records.
WUWT frequently features daft articles about cool regions even as it publishes record warm monthly temperatures from UAH that it even features on its main website side-panel.
I don’t understand how people can be so easily persuaded to reject global warming because of regional cold areas, yet can at the same time studiously ignore the continued monthly record warm temperatures globally.
So childish . . . I ask directly “please cite any ‘experience’ you’ve had that disproves any of the evidence presented” . . . and your respond with “See numerous recent articles (blah, blah, blah)”
But your response did reveal one thing that is obviously truthful: “I don’t understand . . .”
Thank you for that admission.
Good move for the Met Office. No more bending themselves into a pretzel to fit the agenda. Just fill in the numbers they need.
Decision based evidence making at its best, continues apace.
Fraud on top of fraud
Do I understand they feel have to do this because they’re not sure real temperatures will show a rise of 1.5 degrees C?
No, because the anomalies are obviously derived from the real temperatures.