From Dr. Roy Spencer’s Global Warming Blog
Roy Spencer
The Version 6 global average lower tropospheric temperature (LT) anomaly for November, 2023 was +0.91 deg. C departure from the 1991-2020 mean, statistically unchanged from the October, 2023 anomaly of +0.93 deg. C.

The linear warming trend since January, 1979 still stands at +0.14 C/decade (+0.12 C/decade over the global-averaged oceans, and +0.19 C/decade over global-averaged land).
Various regional LT departures from the 30-year (1991-2020) average for the last 23 months are:
| YEAR | MO | GLOBE | NHEM. | SHEM. | TROPIC | USA48 | ARCTIC | AUST |
| 2022 | Jan | +0.03 | +0.07 | -0.00 | -0.23 | -0.12 | +0.68 | +0.10 |
| 2022 | Feb | -0.00 | +0.01 | -0.01 | -0.24 | -0.04 | -0.30 | -0.49 |
| 2022 | Mar | +0.15 | +0.28 | +0.03 | -0.07 | +0.23 | +0.74 | +0.03 |
| 2022 | Apr | +0.27 | +0.35 | +0.18 | -0.04 | -0.25 | +0.45 | +0.61 |
| 2022 | May | +0.18 | +0.25 | +0.10 | +0.01 | +0.60 | +0.23 | +0.20 |
| 2022 | Jun | +0.06 | +0.08 | +0.05 | -0.36 | +0.47 | +0.33 | +0.11 |
| 2022 | Jul | +0.36 | +0.37 | +0.35 | +0.13 | +0.84 | +0.56 | +0.65 |
| 2022 | Aug | +0.28 | +0.32 | +0.24 | -0.03 | +0.60 | +0.51 | -0.00 |
| 2022 | Sep | +0.25 | +0.43 | +0.06 | +0.03 | +0.88 | +0.69 | -0.28 |
| 2022 | Oct | +0.32 | +0.43 | +0.21 | +0.05 | +0.16 | +0.94 | +0.04 |
| 2022 | Nov | +0.17 | +0.21 | +0.13 | -0.16 | -0.51 | +0.51 | -0.56 |
| 2022 | Dec | +0.05 | +0.13 | -0.03 | -0.35 | -0.21 | +0.80 | -0.38 |
| 2023 | Jan | -0.04 | +0.05 | -0.14 | -0.38 | +0.12 | -0.12 | -0.50 |
| 2023 | Feb | +0.09 | +0.17 | 0.00 | -0.11 | +0.68 | -0.24 | -0.11 |
| 2023 | Mar | +0.20 | +0.24 | +0.16 | -0.13 | -1.44 | +0.17 | +0.40 |
| 2023 | Apr | +0.18 | +0.11 | +0.25 | -0.03 | -0.38 | +0.53 | +0.21 |
| 2023 | May | +0.37 | +0.30 | +0.44 | +0.39 | +0.57 | +0.66 | -0.09 |
| 2023 | June | +0.38 | +0.47 | +0.29 | +0.55 | -0.35 | +0.45 | +0.06 |
| 2023 | July | +0.64 | +0.73 | +0.56 | +0.87 | +0.53 | +0.91 | +1.44 |
| 2023 | Aug | +0.70 | +0.88 | +0.51 | +0.86 | +0.94 | +1.54 | +1.25 |
| 2023 | Sep | +0.90 | +0.94 | +0.86 | +0.93 | +0.40 | +1.13 | +1.17 |
| 2023 | Oct | +0.93 | +1.02 | +0.83 | +1.00 | +0.99 | +0.92 | +0.62 |
| 2023 | Nov | +0.91 | +1.01 | +0.82 | +1.03 | +0.65 | +1.16 | +0.42 |
The full UAH Global Temperature Report, along with the LT global gridpoint anomaly image for November, 2023 and a more detailed analysis by John Christy, should be available within the next several days here.
Lower troposphere:
http://vortex.nsstc.uah.edu/data/msu/v6.0/tlt/uahncdc_lt_6.0.txt
Middle troposphere:
http://vortex.nsstc.uah.edu/data/msu/v6.0/tmt/uahncdc_mt_6.0.txt
Tropopause:
http://vortex.nsstc.uah.edu/data/msu/v6.0/ttp/uahncdc_tp_6.0.txt
Lower stratosphere:
http://vortex.nsstc.uah.edu/data/msu/v6.0/tls/uahncdc_ls_6.0.txt
Huge drop in USA and Australia with large increase in the Arctic which doesn’t matter at all.
My feet are still cold.
Today had the earliest ground covering snowfall in decades flakes large as quarter and half dollar coins came down, now it has stopped as the warm part of the storm is coming in tonight because of a 2,000 mile long atmosphere river crashing into the Oregon/Washington coast.
My feet are warm because I dress up for it. along with my Bomber Hat lined with Rabbit fur for the other end.
Current cold sweeping many NH countries has come too late to make a lot of difference to November Global.
Europe Plunges To -34.5C (-30.1F) As Heavy November Snow Sweeps Britain To Bulgaria; Record Coral Cover Exonerates Skeptical Scientists; + Powerful ‘Cannibal CME’ Inbound – Electroverse
Scott Duncan on X: “Brrrrr…. We just observed the coldest November night in Copenhagen (Denmark) https://s.w.org/images/core/emoji/14.0.0/svg/1f1e9-1f1f0.svg in over 100 years. Meteorological winter starts on Friday. https://t.co/4k7WqFTVn3” / X (twitter.com)
If it continues, December should see a significant drop.
It wouldn’t alter the global value much short term anyway, the warmth displaced by the Arctic cold goes to the Arctic!
“If it continues, December should see a significant drop.”
There is no drop in global temps at the end of November,
https://moyhu.blogspot.com/p/latest-ice-and-temperature-data.html#NCAR
Moe… who?
That’s a rabid AGW apostle site.
Also a reanalysis from many urban and unfit for purpose airport site.
Try again, with something that isn’t so agenda-contrived.
That’s Nick Stokes’ site.
He may have had a sticky keyboard the day he was trying to register the site name as MoFo’s.blogspot
I’m well aware who’s site it is…
That’s why I know it is a “rabid AGW apostle site”.
He uses it to fool simpletons.
You’ve forgotten to cover your *ss 😊
Where I am (Lincoln, UK) we’ve just had our first snowfall as well, couple of inches so far and still coming, although a bit intermittently at the moment.
In response to your clothing, what are you wearing on your head? 😁
El Nino usually brings hot/dry to Eastern Australia.
It is raining here… yet again !
Grass is going berserk !
Sooo much CO2 released from continual mowing !
I wonder if the co2 enthusiasts will still blame human co2 emissions when it comes all the way back down again?
The climate orcs are always ready for any directional change.
That’s the rub for alarmists. They are all giddy with the current warmth but deep down they know the El Nino will end and Hunga-Tonga effects will fade away. We could even see another La Nina next year. We are also nearing the AMO phase change and that could have a major cooling effect.
Sorry but l no longer trust the data that they give out any more.
Certainly not since the UK Met office have tried to claim that this year’s average temps for July and August in the UK were not far away from the average. When l know as someone who has been weather watching for the last 40 years knows that the temps during these months were often more like what we get during September rather then like summer.
So now any data they now give as fact l take with a large pinch of salt.
It is possible the weather you experienced was localised, but I can assure you, mean temperature wise, the CET for July and August was very average and corresponds to my experience as a weather watcher with a thermometer in the same place for over 50 years. June and September, however, were both incredibly warm, as was the entire Autumn, bar the last couple of days!
l don’t doubt that both June and September were well above average along with the Autumn.
What l do doubt is the claim that July and August were not far from average. When temps certainly during the evenings often felt more like l would expect during September then summer. l wished l still kept a weather record then l would know for sure. But what l do know for sure is that during July and August it often felt cold for the time of year.
So now you’re disputing the MO max/min recorded values based on your feelings at one point during the day…. Erm OK.
Getting a little boring now. Again a record for the month, beating the previous record for November, set in 2019, by 0.49 C.
This makes it the 5th month in a row that a record for that month has been set, following a June that was only second warmest.
The June – November average this year has beaten the previous record, set in 2020, by 0.39C.
2023 will certainly, barring an asteroid strike, set a new record.
And the new pause is officially no more. Though I dare say the new new pause will have already started last year.
Well, yeah. No one has ever proposed a reason for the warming that started at the end of the 17th century to come to a halt. Only 5 or 6 more new records until the running average rises to the minimum temperature rise so far this century predicted by the IPCC to make their hypothesis plausible. Still a long distance from reaching the best estimate of 0.4 degrees of warming per decade.
You love these EL NINOS, don’t you Bellboy.
Gives you a chance to wail and scream in abject chicken-little panic.,
Yes… it is getting very boring. !
You do know this is still cooler than most of the last 10,000 years, don’t you.
You do know that most people prefer to live in warmer climates, don’t you. !
Now, let’s see your scientific evidence of any human causation. !
You seem to be sadly lacking.
“You do know this is still cooler than most of the last 10,000 years, don’t you.”
Bollocks. You are so full of it and happy to show the world how you celebrate ignorance. And yet people here upvote your BS
https://scitechdaily.com/global-temperature-reconstruction-over-last-24000-years-show-todays-warming-unprecedented/
Wow, a hockey stick on a hockey stick… LOL.
Only person talking bollocks is YOU and the scammers you worship.
Please tell us again , how forests grew 1000 years ago where now there are glaciers.
Please tell us how tree lines 1000 or so years ago were far higher up mountains and a lot further north.
You are so, so stupidly IGNORANT that you would fall for even the most pathetic of CONS.
Here’s your chance Einstein… provide (like I have) some data with integrity that shows you are right.
There is NO integrity in the graph you have presented.
If you think splicing instrumental records on the end of highly averaged 200-year proxy data is “sound” science…
… it explains how you fall for even the most obvious scientific cons. !
Papers like that should NEVER get passed peer-review.. but it is “Nature”.. so to be expected.
Now….
Please tell us again , how forests grew 1000 years ago where now there are glaciers.
Please tell us how tree lines 1000 or so years ago were far higher up mountains and a lot further north.
You are still flapping mindlessly in your own wind.
200-year, highly average proxy data .. and they splice on instrumental data.
These guys are mathematical CLOWNS.
And anyone that falls for that sort of ignorant anti-science, is even worse.
Here’s your chance Einstein… provide (like I have) some data with integrity that shows you are right.
Data from all around the world shows the MWP, and Holocene optimum where real and global and WARMER than now.
I have posted these many times.
Why your incredible desperation to remain totally IGNORANT ??
Data from all around the world shows the MWP, and Holocene optimum where real and global and WARMER than now.“
But that’s not what you claimed. You said “You do know this is still cooler than most of the last 10,000 years, don’t you.”
So… Here’s your chance Einstein… provide (like I have) some data with integrity that shows you are right.
I’ll ask again.. since you seem unable to think for yourself for even a fraction of a second…
Please tell us again , how forests grew 1000 years ago where now there are glaciers.
Please tell us how tree lines 1000 or so years ago were far higher up mountains and a lot further north.
You cannot continue to ignore reality…
Even your “uncle” must know that.
“Please tell us again , how forests grew 1000 years ago where now there are glaciers.”
Are you not able to comprehend that the planet does not warm and cool uniformly? This alone explains your tree issue, that you seem to think sort the world climate denier issues. So see the world like a five year old, which explains your juvenile putdowns.
Are you this much of an idiot? Don’t you remember us all destroying you in the Michael Mann forum? You were showed a picture of a tree in the Arctic (no ice). And you replied with “microclimate”?
“You were showed a picture of a tree in the Arctic (no ice). And you replied with “microclimate”?”
Yep because it was right. You on the other hand thought it was some divine denier miracle. I did laugh out loud at that.
Do you know where the Beautford Sea is?
Is this a geography test? What’s your point?
Well if you read the caption below the picture, you would have seen that the tree is within a close difference to the Beautford Sea. Simon do you just like to troll or do you actually know what you’re talking about?
Point. ?
To show your incredible IGNORANCE.
All we have to do is keep your typing, and everyone gets to see it.
It is hilarious to watch. :-).
ROFLMAO.
Now you are just inventing rabid anti-science NONSENSE
Your stupidity level is now off the charts !!
WRONG
Your stupidity remains well and truly stuck on 11 !
You will get out of kindy at some stage in your pathetic little brainless life.
At least you have now ADMITTED that it was much warmer in those MANY places where trees have been found under glaciers.
As least you comprehend that much. !
Was much warmer EVERYWHERE.. but don’t let that fact disrupt your cult-like ignorance.
I see you as a 5-year-old.
Seems I over-estimated… by a long way.
So… Here’s your chance Einstein… provide (like I have) some data with integrity that shows you are right.
“Are you not able to comprehend that the planet does not warm and cool uniformly?”
And yet we are supposed to believe that the entire globe is warming?
If part of the globe is cooling and part is warming then the warming has to be enough to overcome the cooling when you calculate the average. That means that some places have to be REALLY warming.
If CO2 is well-mixed globally and yet part of the globe is cooling then why is that? What’s causing the local cooling when the rest of the globe is warming?
You are your own worst enemy with your logic.
“And yet we are supposed to believe that the entire globe is warming?”
We know that on average it is. No one with any knowledge of the science disputes that.
If part of the globe is cooling and part is warming then the warming has to be enough to overcome the cooling when you calculate the average. That means that some places have to be REALLY warming.”
Well… yes and they are. You can read about these variations monthly here. Let me know what you think. https://www.ncei.noaa.gov/access/monitoring/monthly-report/global/202310
“If CO2 is well-mixed globally and yet part of the globe is cooling then why is that?”
Because CO2 is not the only driver.
Sophistry. The issue is the “average”. The issue is that not everyplace is warming.
As far as your link: “During October 2023, 10.62% of the world’s surface had a record-high October temperature—the highest percentage for October since the start of records in 1951. Across the global land, 13.04% of its surface had a record-high October temperature. Meanwhile, 1.12% of global land surface had a record-cold temperature this October.”
So what? Once again, these are global averages. It does not address what you yourself said, that not everyplace warms or cools the same.
This is actually more proof that minimum temps are what is causing the increase in the global temperature average, not maximum temps. Increased minimum temps are GOOD! Longer growing seasons, more food, fewer deaths from weather, less expensive heating bills, and on and on and on.
It does *NOT* mean that the oceans will boil, or that we will see food shortages from crops burning up in the fields, or that the Earth will turn into a cinder if the average temp goes up 5C!
So why the world-wide push to impoverish the bourgeoisie?
There is no integrity in your chart since they are spliced together despite wide variation on resolution datapoints.
You try so hard to fail in logic….
Really? You better tell the university of Arizona then. Go on…..
Well someone needs to.
You certainly don’t have even the slightest competence to understand the mathematical maleficence involved.
You are a mathematically incompetent moron. !
Still no data huh to show your wrong and ludicrous your claim is that “this is still cooler than most of the last 10,000 years, don’t you.”
You huff and puff and spit vile… but still no evidence. You do know science is based on evidence don’t you? What a silly man you are.
If you haven’t bothered to look at the many times I have posted many charts showing very clearly that the Holocene existed throughout the whole of the planet and was considerable warmer than now.
Why should I bother posting them yet again
You will ALWAYS remain totally ignorant.
It is how you want to be. !
It is YOUR CHOICE to remain ignorant and to be a CLIMATE CHANGE DENIER.
Simon castigates you over a lack of evidence all the while ignoring requests to him to provide evidence that CO2 causes global temperature increases.
He doesn’t understand the word hypocrisy.
chrome-extension://oemmndcbldboiebfnladdacbdfmadadm/https://static.berkeleyearth.org/pdf/annual-with-forcing.pdf
Not whatta you got soldier.
Do you know why the GISS data starts at 1880? NOAA has temperature data back to 1850, which would extend the left side by around 20%
The title of the chart is somewhat misleading. It’s a time series showing temperature and forcing rather than temperature vs forcing. That would have forcing as the X axis.
What baseline is used for temperature? The 1880 – 1900 average is around the 0.25 mark.
“If you haven’t bothered to look at the many times I have posted many charts”
Boy did I know that answer was coming. Typical answer from the man who has got nothing, nothing and nothing. You are such a fraud…
But here is one, just for you.
DENIAL of the Holocene Optimum and the MWP and RWP
Talk about an IGNORANCE of science.. that is all you have.
REMAIN IGNORANT.. it is your only way of protecting your pitiful cult-like religious zealotry.
You are such an olympic level clown. Your useless graph is not global. It covers one minuscule part. Meaningless and pathetic, much like you. Try again man/boy.
The best part is I bet you searched for hours and that was the best you could come up with. All you did was prove my point. Already a great day.
The spike since summer obviously has nothing whatsoever to do with CO2.
Did I say it had anything to do with CO2?
The exact reasons for the spike is uncertain. Probably the emerging El Niño, but if so it’s unusual to happen at this time of year.
CO2 doesn’t cause the spike, but it has caused an underlying warming trend.(Assuming it’s not cause by random sine waves.)
Remove the warming trend and this spike is comparable to the one caused by the 1998 El Niño.
It’s also the case that the current El Niño is, as yet, nowhere near as prolonged or intense as the one that caused the global temperature records in 2016.
There’s a lot more heat to come.
“There’s a lot more heat to come.”
Oh dear, Fungal is playing with his crystal balls again !
Tell that to the NH countries current deep in snow and freezing their assets off !!
“There’s a lot more heat to come.”
We shall see.
I wonder if huge rise in temperatures so soon might mean the El Niño will peter out quicker. It’s just a completely uneducated guess at the moment, but this whole year has been so odd that I wouldn’t like to make any predictions as to how it will play out.
If the usual 4-5 month lag between El Niño and UAH persists then these high UAH temperatures are set to persist throughout the NH winter.
BOM’s weekly updates suggest there is no sign of any let-up with this current event as yet; but even if it stopped and went into reverse today, there are still months of high temperatures ‘built in’ to the lower troposphere’s response.
Which explains all the freezing cold and snow in the NH, right !
At least you now realise it is all El Nino..
and that there is zero evidence of human causation.
Now.
Please tell us again , how forests grew 1000 years ago where now there are glaciers.
Please tell us how tree lines 1000 or so years ago were far higher up mountains and a lot further north.
You seem to be forgetting to answer. 😉
NH temperatures are well above average at the present time.
Thank you for your anecdotes, though.
Yet lots of cold and snow everywhere.. Oh dearie me.
Please tell us again , how forests grew 1000 years ago where now there are glaciers.
Please tell us how tree lines 1000 or so years ago were far higher up mountains and a lot further north.
You seem to be forgetting to answer.
Snow cover has been higher than average, despite a higher anomaly.
There’s a lot more heat to come. Oh really, then come over here and start shovelling the several inches of your ‘heat’ that dropped tonight. That’s the problem with smearing temperatures from hot areas over the rest of the world in these ‘homogenised’ global average datasets, they mean bugger all. Show me a regional dataset of actual temperatures not invented ‘anomalies’, show me accurate data over the months of the year, with reference to previous months and it will mean something useful. If you can’t even do that then you are no damn use at all which is, frankly, all we expect from you.
Exactly. The most rural weather stations you will find will show regional variability most accurate of what is happening to our “climate.” Within those, one can look for the distribution of possible highest maximum and lowest minimum temperatures for any given month over a long period of time and see the change that has happened to our climate. I find it funny that the months with highest maximum temperature are seen during the 1910s-1940s.
Yee-haw.
Bellboy is FINALLY admitting that this tiny spike is TOTALLY NATURAL !!
What evidence can you cite to support the hypothesis that CO2 increase has caused a warming trend? The secular trend began in AD 1695, during the depths of the Maunder Minimum. Hence CO2 increase is a consequence of warming seas, not a cause. It might however be a slightly poisitive feedback effect thereof.
“What evidence can you cite to support the hypothesis that CO2 increase has caused a warming trend?”
I doubt there’s any evidence that would satisfy you. But something is causing the warming trend, either CO2 or postage stamps, or random sine waves. The point is what ever caused the trend did not cause the spike, but the spike wouldn’t be record breaking if it wasn’t for the trend.
“The secular trend began in AD 1695, during the depths of the Maunder Minimum.”
Any evidence for that? What data set are you using to determine that trend? What do you think caused the trend?
If you take CET for instance, there was no significant warming between 1695 and 1900. The warming rate was 0.0026°C / decade. Between 1700 and 1900 there was an insignificant cooling trend of 0.0054°C / decade. That could be described as a 200 year pause in your secular trend.
What is causing the warming trend is the same as what caused it even more strongly in the 18th and 19th centuries, and early 20th century.
Again, what evidence do you have that there were stronger trends in the 18th and 19th century? What periods and what data are you talking about?
And then, how do you establish that they had the same cause as over the last 50 years?
Here is Phil Jones’ chart of the last three warmings.
All three warmings are of the same magnitude. Two of the warmings occur before CO2 was an issue.
If two warmings are not caused by CO2, and the third warming is of the same magnitude as the first two, why should we assume that whatever caused the first two warmings stopped and CO2 took over from 1980?
I assume that the current warming is just one more in a cycle of warmings and there is no evidence to suggest otherwise.
And, btw, the correct way to read Phil Jones’ chart is to put the 1880’s and the 1930’s and 1998 highpoint on the same horizontal line on the chart because they were all equally warm, according to unmodified, written Tmax charts from around the world.
Phil Jones, is one of those dishonest temperature data manniplators who wanted to erase anything in the past that looked like equivalent warming to the present, so that’s the reason he shows the 1880’s and the 1930’s as being cooler than the present day. But Tmax charts and Tavg charts from all over the world show this is a BIG LIE and that temperatures in the past were just as warm as they are now. Without the benefit of CO2.
So what we have are three periods after the end of the Little Ice Age where temperatures warmed for a few decades and then the temperatures cooled for a few decades and the highpoints of the temperatures were of the same magntude and the cool points of the temperature declines were of the same magnitude (2.0C from warm to cold and back, according to the U.S. regional chart).
Climate Alarmists want us to believe that Mother Nature was in control over the first two periods of warming, but then Mother Nature took a backseat to CO2 in 1980 and is now the driving factor.
The logical thing to assume is that the warming since 1980 is caused by the same thing that caused the equivalent warming in the last two warm periods.
There is no evidence that CO2 has anything to do with it.
“Here is Phil Jones’ chart of the last three warmings.”
I was asking about the 18th century, and the claim that there had been a warming trend since the late 17th century. Your response is an out of date graph from the mid 19th century, which in other circumstances you would be dismissing as a fraudulent bastardized graph from an unreliable source. And it does not show continuous warming.
“All three warmings are of the same magnitude.”
They are not. They might all show similar rates of warming – but over different time periods. The first is only 20 years, the second, 30, and the third 35 years.
Actual warming is
0.163 * 2 = 0.326°C
0.150 * 3 = 0.450°C
0.161 * 2.4 = 0.547°C
Or to avoid the wrath of the sigfig police
0.33, 0.45, 0.55.
And of course the final warming has gone on for another 13 years, so assuming no change in trend, that would be 0.161 * 4.6 = 0.740°C.
Since 1975, there has been twice as much warming as there was in the brief 19th century warming trend.
And that’s ignoring the fact that in 1975 temperatures where already around 0.5°C warmer than they where at the start of the previous two warmings.
“I assume that the current warming is just one more in a cycle of warmings and there is no evidence to suggest otherwise.”
An unwise assumption. People have been using that assumption for the past 30 years to predict we were just about to enter a cooling part of the cycle.
“And, btw, the correct way to read Phil Jones’ chart is to put the 1880’s and the 1930’s and 1998 highpoint on the same horizontal line on the chart because they were all equally warm, according to unmodified, written Tmax charts from around the world.”
And there we go again. Happy to claim that the chart proves something about cycles, but at the same time claim it’s meaningless garbage.
“Since 1975, there has been twice as much warming as there was in the brief 19th century warming trend.
And that’s ignoring the fact that in 1975 temperatures where already around 0.5°C warmer than they where at the start of the previous two warmings.”
Ridiculous. You don’t know that for a fact. You are speculating using bogus temperature data.
The temperature record in your head does not match reality. Try looking at unmodified, regional temperature charts for a clue as to the real temperature profile of the globe.
“Ridiculous. You don’t know that for a fact.”
~Once again you are denying your own evidence. You were the one who dragged up HadCRUT 3, with some trend lines to claim something. But when I explain it doesn’t show what you where claiming – you just reject the data out of hand.
The early 18th century warming cycle coming out of the Maunder Minimum was of greater amplitude and duration than the late 20th century warming.
From 2011, before the CET was further “adjusted” beyond all recognition:
https://www.climate-lab-book.ac.uk/2011/trends-in-cet/
Again, could you supply some evidence for that. There are no reliable global records from the early 18th century. And when I bring up CET, which is usually used to make such a claim, I’m told it’s not admissible as evidence.
Regardless, it still doesn’t support your claim which was that current warming was part of a warming trend since 1695. If CET is to be believed there was pretty fast warming out of the extreme lows of the 1690s. But from the 1740, temperatures were falling back, and for the next 150 years or so, just ups and downs, no obvious trend.
There are no reliable global records period.
Then why use CRU to make your point below?
I, along with Mike, am making the point of the possible maximum peak of the stadium wave. He said he didn’t think 2016’s peak would be topped; that’s not at all a fringe point of view given that is was caused by a historically massive El Niño. It wasn’t until the mysterious spike reared it’s delightful head that it did.
And yet it got topped with the 4m preceding ONI at only 0.5…barely even an El Nino. And you probably already saw the graph I prepared with only the El Nino months which clearly shows that each El Nino is warmer than the previous.
Gulf Stream.
Exactly.
Mother Nature is causing the warming trends until proven otherwise, and it has never been proven otherwise.
So you admit there is NO EVIDENCE of CO2 warming.
Thanks, but we are well aware of that. !
“If you take CET for instance”
I’m skeptical that CET represents European temperatures.
Here is a Tmax chart of Norway, which is close to the UK, and it shows that the temperatures in the Early Twentieth Century were just as warm as they are today.
I think Norway’s Tmax chart is more representative of the temperatures of Europe.
“I’m skeptical that CET represents European temperatures”
It doesn’t. If it represents anything it’s Central English temperatures. There’s a clue in the name.
But some here, when it suits them, like to claim it’s a proxy for global temperatures. And the question remains. If you want to claim there has been a continuous warming trend in global temperatures since the 17th century, what data are you basing that claim on?
“and it shows that the temperatures in the Early Twentieth Century were just as warm as they are today.”
Early 20th century is not late 17th century. And the claim was that temperatures have been warming since then, not that they staid the same.
And once again,. your graphs are not showing annual average temperatures, they are showing a single monthly maximum temperature, and only go up to 2012. Also, apart from one cold year in 2012 and a couple of hot years at the start, that graph does not show temperatures just as warm in the early 20th century.
There’s a clear warming trend, with some big ups and downs along the way. Just eyeballing it I would say at the start of the 20th century the temps are around 14.5°C and by the 2010s they are around 16°C.
“I think Norway’s Tmax chart is more representative of the temperatures of Europe.”
Of course you do.
Here is an updated chart, going up to 2018, showing maximum temperatures for July, which is likely in most cases to be the same as the maximum annual temperature in your graph.
Here’s the same with a rolling 5 year average in blue.
And here are the maximum anomalies for year, rather than just July.
BEST. !. roflmao.
Urban warming writ large.
All the WORST data they can find. !
Gives more “room” for mal-adjustments and homogenisation scams.
If you spent less time hitting the exclamation mark key, and more time trying to understand the discussion, you might have noticed that I used BEST becasue that’s the data Tom Abbott used when he was claiming “it shows that the temperatures in the Early Twentieth Century were just as warm as they are today”.
As always you have no objection to a data set when you think it shows what you want to believe, but suddenly it becomes the “worst” when it shows something different.
BEST has always been junk right from the start.
Massively contaminated by urban warming, airports and many other “unfit-for-purpose” issues.
The manically mal-manipulated to give whatever result they want to get.
So much BAD DATA.. no way it can give a sensible result. !
If you had a working brain, rather than mindless regurg.. you would realise that.
“If you spent less time hitting the exclamation mark key, and more time trying to understand the discussion, you might have noticed that I used BEST becasue that’s the data Tom Abbott used when he was claiming “it shows that the temperatures in the Early Twentieth Century were just as warm as they are today”.”
See my comment and the link just above.
There’s more than one way to mannipulate the raw data. One way is legitimate, others are not. What method did you use?
“There’s more than one way to mannipulate the raw data. One way is legitimate, others are not. What method did you use?”
I’m not using raw data at all. I’m using exactly the same data you use, that from BEST for Norway.
Bob Tisdale produced the Tmax charts at issue here. He also used BEST data, but he warns about techniques that can bastardize this data.
So I’m wondering how Bellman used his data. Did he duplicate Bob Tisdale’s efforts, or did he pull a fast one on us as described in the article below by Bob Tisdale.
https://wattsupwiththat.com/2018/12/13/examples-of-how-the-use-of-temperature-anomaly-data-instead-of-temperature-data-can-result-in-wrong-answers/
In other words, one can use raw BEST data and come up with more than one temperature profile depending on how dishonest the person is.
We have to keep a close eye on these data mannipulators. They are tricky.
“So I’m wondering how Bellman used his data”
It’s perfectly simple. I went to the website, downloaded the data, and plotted the maximum temperatures for July. As I said, this was instead of your graph which selects the warmest month of each year. The only difference is they have now updated the record to June 2019.
I’m certainly not going to take any lessons from Tisdale about how to pull a fast one.
You may think you’ve done something special but what you’ve done is ignore that because of WEATHER, July isn’t always the hottest month! Plotting the same month ignores the fact that high/low pressure systems don’t set up the same way every year. Here in the central US sometimes July is the hot month and sometimes it’s August. When the hottest temps occur is entirely dependent on chaos, not on artificial delineations such as months.
Thus if you want to actually track Tmax you need to do it based on which month is the hottest. And even that is misleading. What *should* be done is to plot Tmax between June and September (in the NH at least) and pick the 30 day interval with the highest average in order to gain some understanding of the climate in real world terms.
The really sad fact is that it isn’t Tmax that even determines climate, it is enthalpy, minimum enthalpy and maximum enthalpy. Tmax in Las Vegas and Miami can be exactly the same value leading to the wrong conclusion that both have the same climate. They don’t. There isn’t a single temperature data set that correctly assess climate. Nor do any of the models since they don’t start with enthalpy but, instead, with temperatures that are actually meaningless when it comes to climate. The model outputs should be in terms of joules, not degrees.
“You may think you’ve done something special”
I really don’t.
“July isn’t always the hottest month!”
Which is why it’s better to compare the same month. But if you prefer here’s the warmest individual month ion any given year.
For the record between 1900 and 2018, the Hottest maximum monthly average was July in 100 years. June in 3 years, and August in 16.
You *still* don’t get it. Splitting the temperatures up by month is *NOT* the best way to get a picture of what is happening. Weather over time isn’t delineated by the calendar month!
The data is *still* split up by an arbitrary, artificial delineator – the month.
You didn’t understand what I wrote at all, which is not surprising at all either.
Comparing “months” doesn’t tell you anything. If you must use an arbitrary interval of 30 days, then find the hottest 30-day period in the year to compare. Some years that may be the last half of July and the first half of August. Or it may be the whole of August. Or it may be the whole of July.
The *BEST* way to actually look at this would be the accumulated cooling degree-days or accumulated growing degree-days. But climate science, and you, just can’t seem to get past using 17th century methodology.
Again, and again, you attack me for using the very data that’s being used to claim no warming since the early 20th century. I agree that trying to determine the hottest part of the year in order to represent annual temperature change is misleading. And you are are correct, even if you want to just know how hot the hottest part of each year is, using monthly data can be misleading.
One year might have a hot July, another a hot August and another have a hot end to July and start of August. The result is that the 3rd year appears to be colder than the previous two, just because it’s hot period was split between two calendar month. This is why it would make more sense to look at the average over the summer months, rather than select the hottest month.
The idea of looking for the hottest 30 consecutive days is better than using calendar months – but you will need to find the daily data. However it’s still a problem deciding how long a period you want to look at. What if one year there was an extremely hot week, surrounded by much cooler weather, and another year had above average, but not excessively hot, days for an entire 30 day period. Which would you consider to be the hottest? What if one year has many hot days, but spread across many months – should that be considered less hot than a year where all the hot days fell within a 30 day period?
Whatever you do, if you only want to look at the hottest parts of the year, will require some form of aggregation – and different forms, will probably give different results.
Bellman,
You’re still not understanding what he’s saying. Step away from your trendology ruler for a second, and try to think outside the box. “Do you have any experience with meteorology in your area? If you did, you would know that comparing two months, say August 2023 and August 2022, can be a futile endeavor. In this context, Aug 2023 might exhibit a higher anomaly than Aug 2022, yet have colder temperatures or lower maximums. This discrepancy could be attributed to a brief but intense heatwave occurring at the very end of the month, skewing the overall anomaly. This principle holds true for ALL anomalies. To comprehend regional, let alone global, climate patterns, it’s crucial not just to be a statistician but to grasp the nuances of meteorology. Mr. Gorman emphasizes that temperature trends aren’t neatly confined to 30, 60, 90, or 365-day intervals.
Anyone using words like trendology has already lost the argument. I’m not interested in marketing or fashion.
But seriously – I’m not sure what you think I’m disagreeing about. I live in England – I know how variable weather can be. That’s why I find trying to base claims of no global warming based on looking at one location or another, and ignoring everything but the hottest set of days is misleading.
All of this is a deliberate distraction from the question of global warming – climate, not weather. If you want to know if the world has been getting warmer or not, an obvious first start is to see if global average temperatures are increasing or not.
No, that’s the point being made. There’s no ‘global average temperature.’ Temperature cannot be averaged.
When two entirely different climates can generate the exact same value of anomaly, then that anomaly tells you *NOTHING* about climate. And those anomalies are what is being used to say the global average temperature is increasing and is a measure of the global climate change.
If you truly want to know about climate then you need a measure that can distinguish between two different climates. Not even degree-days are a good measure of that because two entirely different locations, such as Las Vegas and Miami, can have the same degree-day value while having vastly different climates because of humidity, pressure, precipitation, etc.
It’s like what Walter is trying to explain and CAGW advocates simply refuse to understand – there is no such thing as an average temperature or temperature anomaly that is meaningful when it comes to climate.
Freeman Dyson pointed this out many years ago but which climate science totally ignored. Dyson said the climate models were useless because they are not holistic, they don’t tell you anything about what is actually happening on the earth. The CAGW mantra is “rising global temperature bad” but they have no proof of that at all. It’s why we get so many predictions of bad things – failing harvests, more extreme weather, coastal cities being innundated by the ocean, etc. All generated from the assumption that rising global temps are bad so it’s results must be bad.
The proof of that is in the pudding. None of the cataclysmic predictions by climate science have come true. What we’ve actually gotten are higher harvests, less extreme weather, coastal cities not being flooded, etc. But for CAGW the tipping point is always ten years in the future – bad things *will* happen ten years from now. It’s no different than the guy on the street corner EVERY SINGLE DAY predicting the world will end TOMORROW. But tomorrow he’s right back on the same street corner.
Climate science isn’t science today – it’s religion. A religion based on false premises. And that just gets more and more obvious every year. Ask your local car dealer why EV’s are piling up on his lot!
“then that anomaly tells you *NOTHING* about climate”
You keep yelling that word. You really should look up what it means.
“In this context, Aug 2023 might exhibit a higher anomaly than Aug 2022, yet have colder temperatures or lower maximums.”
You nailed it! Now if only climate science would wake up! When two different climates can generate the same anomaly then the anomaly can’t tell you anything about climate.
Those who have actual responsibility for their output, who have people depending on them for their livlihood (e.g. farmers, truckers, depts of transportation, etc) have moved on from the archaic methods of climate science that is so littered with measurement uncertainty and inappropriate statistics.
Once you figure this out, there’s no going back on your climate “denialism.”
“but you will need to find the daily data.”
If the data wasn’t available then how are monthly averages calculated?
In fact, any number of stations have made 2min, 5min, or 10min data available for almost 40 years. If it’s not been recorded and saved then blame climate science for being short-sighted.
What *should* be done is not just a consecutive 30 day period but an accumulation over the entire year. That’s what agricultural science does when evaluating heat accumulation during a growing season or when calculating growing degree-days.
Climate science is living in the 17th century, depending on Tmax and Tmin temps accumulated over a month. Other science disciplines have left them far behind and, apparently, you as well. This is nothing new. I’ve been telling you this for two years – are you just now beginning to get a glimmer of the faults with the “global average temperature” used by climate science?
“If the data wasn’t available then how are monthly averages calculated?”
I’m not saying it doesn’t exist – but there’s a lot of work to actually convert into a regional average.
“In fact, any number of stations have made 2min, 5min, or 10min data available for almost 40 years”
Which is not much use when you want to compare current temperatures with the start of the 20th century.
“Climate science is living in the 17th century,”
You realize this entire discussion started with an unsubstantiated claim that temperatures have been rising since the 17th century. And aside from long reconstructions such as CET – nothing is based on 17th century methods. I think max min thermometers weren’t around until the late 18th century.
“Other science disciplines have left them far behind and, apparently, you as well.”
Not if they want to compare temperatures with the 19th and early 20th century they haven’t.
“I’ve been telling you this for two years”
And I’ve been explaining why nearly everything you you say is nonsense. It’s a futile exercise, of course.
“I’m not saying it doesn’t exist – but there’s a lot of work to actually convert into a regional average.”
how much work can it be to create a data set of date, time, and temp and then sort it in descending order by temperature? You are just whining in trying to use this as an excuse.
“You realize this entire discussion started with an unsubstantiated claim that temperatures have been rising since the 17th century.”
Doesn’t matter. The issue is that no one knows because of all the measurement uncertainty and lack of statistical rigor in trying to determine average temperatures on the local, regional, and global stage.
“Not if they want to compare temperatures with the 19th and early 20th century they haven’t.”
You and climate science must all be relatives of Teyve in “Fiddler on the Roof”! “TRADITION”!
We’ve got (or could have had) 40 YEARS of newer measurement techniques and newer analysis methods that we *could* be using today to compare to the old records and old methods to see just how bad the old ways are.
There is NOTHING that keeps climate science from running both in parallel – other than the fear that the old methods will be shown to have been inadequate and the money train will be derailed!
“You are just whining in trying to use this as an excuse.”
You still don’t get that if you make a claim you need to provide the evidence. Your the one who want this job done, it’s not up to me to do the work for you. If it’s as easy as you think – you do it.
“The issue is that no one knows”
Yet they keep claiming it’s true. So far – either global temperatures have been climbing since the 17th century, or it was warming at a faster rate at the beginning of the 18th century, or it was just as warm, in Norway, as it currently is/. All based on, as you say, a lack of statistical rigor. Again, if you want to make a claim, it’s up to you to show the evidence.
“You and climate science must all be relatives of Teyve in “Fiddler on the Roof”! “TRADITION”!”
Are, the traditional joke, you keep making every couple of weeks. Almost as if you are a slave to tradition.
You still can’t understand that the problem isn’t people wanting to use old methods, it’s that if you want historical data you have to accept the methods used at the time.
“We’ve got (or could have had) 40 YEARS of newer measurement techniques”
We’ve got over 40 years of satellite measurements – it’s what this article is about. They keep being held, here, to be the best data available. Yet when they show temperature rising, what happens? Everyone here starts complaining that they only go back 40 years.Temperatures were much warmer in the 1930s, why don’t they show that – they whine.
“You still don’t get that if you make a claim you need to provide the evidence.”
What evidence? You were whining about ti being a big job – it isn’t. The data *should* be there. I’ve been collecting it here since 2012 – using a Respberry Pi with limited memory! A simple SQL query can pull the data by year and a simple bubble sort in Perl or C will sort the temps to get the highest.
Climate scientists are being PAID to do things like this. I am working and going to school every day (at age 73!) and have no time left over to do it. Let grad students at college do this. It *IS* simple. And I *have* done it in the past when trying to work out cooling degree-days by month from my own data. I use SQL and Perl to extract 24 hour rain and 24 hour maximum temp from my database to use on the Kansas Weather Net run by amateur radio operators every morning and evening. I could easily stick those in a new database and at the end of the year sort the data using a simple bubble sort.
You *are* whining. Pure and plain. The fact that *you* don’t know how to do it does *NOT* mean that it would be difficult to do.
Climate science *could* have been doing this for 40 years. The fact that they haven’t and even refuse to begin doing so is quite telling as to what their real agenda is.
“You still can’t understand that the problem isn’t people wanting to use old methods, it’s that if you want historical data you have to accept the methods used at the time.”
The problem is that they ARE using old methods – because of tradition.
And are refusing to use newer, better methods. There is nothing that says that the new methods can’t be run in parallel with the old methods. The fact that *you* can’t accept that simple truth only shows that you have the same agenda as climate science!
“We’ve got over 40 years of satellite measurements – it’s what this article is about.”
You don’t even have the basics of data collection. Satellite data is sparse sampling. It can’t even identify maximum and minimum temperatures at any specific location – and without that it can’t actually identify climate anywhere. It is a *METRIC*, not a measurement. It is beggars the imagination of this engineer that it is even accepted as a measurement when it can’t actually measure anything. Adjusting for cloud cover is pure guesswork, much like parameterizing cloud cover in climate models. Cloud cover changes from minute-to-minute, day-to-day, and month-to-month. Thinking that a metric that can’t actually measure cloud cover at each reading can tell you temperature down to the hundredth digit is no different than a carnival fortune teller reading your future in a cloudy crystal ball.
“They keep being held, here, to be the best data available.”
Satellite data has measurement uncertainty in at least the units digit. If that’s the best data available then it is not fit for purpose, not even as a metric. So there is no misunderstanding, my use of the term “metric” is like measuring the efficiency of a production line by tracking the number of units produced per time. That metric actually measures nothing on the production line, it can’t even identify changes that have increased/decreased unit quality. The metric of units/time is useful but what it is telling you *must* be understood in detail – as well as what it is *NOT* telling you. Satellite data is the same thing. It is not a real measure of temperature or enthalpy. It is a *metric*. And it must be understood in detail to understand what it is telling you and what it is *NOT* telling you.
“Everyone here starts complaining that they only go back 40 years.Temperatures were much warmer in the 1930s, why don’t they show that – they whine.”
You don’t even understand what people are saying. Tmax temperatures were warmer in the 30’s – on a global basis. Tmax records *are* available, even in their uncertainty is higher than what is available today.
I have no problem with satellite-based metrics such as UAH – AS LONG AS THEY ARE USED PROPERLY. That includes recognizing their uncertainty *and* their limitations. That’s not whining. That’s being realistic about their capabilities. As a statistician you *never* actually question the data and whether it is fit for purpose. You just assume, as climate science does, that all stated values have no uncertainty – that the uncertainty is random, Gaussian, and cancels. And then assume that averages can increase measurement precision beyond the capability of the actual measurement devices. That is simply not being realistic about capabilities.
For someone who doesn’t like whining, you sure do a lot of it.
As it happens, I might be able to help you out a little. BEST have an experimental gridded daily data set. When I’ve ironed out using CDF in R, and enough time to compile all the data, I might be able to reproduce your requested regional data. In the mean time here’s the model you where asking about, warmest consecutive 30 day maximum temperatures for each year. It’s only for one grid point in Norway, the one closest to Oslo.
You first said the data wasn’t available and then said it would be too hard to use it.
But it seems you found it. It seems you used it pretty easily.
Why can’t climate science?
CET has a very obvious population based trend in it.
This is proven by comparing with Valentia.
Try not to be so ignorant. !
Not only that, but in recent years the UK has been BLESSED with extra sunshine hours… which just happen to coincide with the slight rise at the end of the CET data.
UK with more sunshine… .oh the inhumanity… WE MUST STOP THIS !!!
“CET has a very obvious population based trend in it.”
So you agree that CET doesn’t show this mythical warming trend since 1695. And even suggest what warming trend it does show is caused by humans. Maybe you should explain this to Milo.
“UK with more sunshine… .oh the inhumanity… WE MUST STOP THIS !!!”
So you admit the climate is changing. Good to know. And the three exclamation marks makes your argument particularly convincing.
Not to mention the CAPITILISATION!!!!!
You don’t seem to comprehend lower case…
… thought I might see if you had learnt to read capitals yet.
Absolutely ZERO EVIDENCE of human causation.
But you knew that didn’t you !
Or are you going to blame humans for extra sunshine in the UK.. that would be moronically hilarious… really low-grade slap-stick.
But hat is what the “climate change” agenda is all about… human causation…
… and you have FAILED UTTERLY to produce any evidence to support it.
I assume therefore, that you know all the anti-CO2 nonsense is totally farcical.
Writing things in all caps and bold, doesn’t help your argument. Nor does being constantly apoplectic. If you just calmed down, stopped hurling childish insults, and actually thought about what you were trying to say, we might get somewhere.
It’s an interesting question as to how much the warming in the UK has been caused by increased sunshine. Also to what extent increased sunshine might have been caused by warmer whether. I tried to look into it a few years ago, when another person of similar temperament to you kept insisting all the warming was caused by it being sunnier. I didn’t come to any firm conclusions.
There certainly is a correlation between the two, but it gets more complicated when you look at the details. However, it doesn’t seem to me that the increase in sunshine can explain all, or most, or the recent warming. And the question still remains, why did it start to get sunnier in the UK at just the time that global warm really took of? A significant change in cloud cover is climate change, whatever it’s cause.
“A significant change in cloud cover is climate change, “
At least you weren’t STUPID enough to blame it on human CO2. ! 😉
You seem to think “climate” is constant and never changes naturally.
That is an even more idiotic thing to think, wouldn’t you agree. !
You have no argument to help.
You are making provably baseless unscientific statements.. as you always do.
The sunshine increase + some population expansion easily explains ALL of the CET warming.
Correlation does not imply causation.
But, certainly there is good correlation between English temperature and Sunshine.
Here’s the annual correlation between 1920 and 2022.
However, looking at the best fit between the two, it does seem there is more warming in the 21st century than can be explained just by sunshine.
If I add CO2 I get a slightly better fit.
But as I say, correlation does not imply causation.
What is the correlation between English temperature and English tax rates?
You’re going to have to be more specific than that. Which particular taxes do you think will cause a change in temperature? Do you mean the income tax rate, allowance, National Insurance VAT? Or are you worried about total income from taxation?
I doubt there is much of a correlation. Tax as a percentage of GDP went up massively after the war, but has been relatively flat since then.
https://researchbriefings.files.parliament.uk/documents/CBP-8513/CBP-8513.pdf
But even if there was a correlation, try to remember that correlation does not imply causation. I don;t agree with much bnice2000 says, but it is at least reasonable to assume that increased sunshine will cause increased temperatures. Not so much tax rates.
“You’re going to have to be more specific than that. Which particular taxes do you think will cause a change in temperature?” (bolding mine, tpg)
The issue isn’t “cause”, it’s correlation. Just because CO2 rise and temperature rise are correlated it doesn’t mean there is a causal relationship. It’s the same for all taxes. Add up all the taxes paid by the typical citizen; federal income Tax, regional income tax, property tax, state sales tax, county sales tax, city sales tax, school district tax, and anything else you can think of. You will find a steady rise in the amount of taxes paid per year just like you have in CO2 or temperature.
You keep posting CO2 vs temperature as if the relationship *MEANS* something. It doesn’t.
If you could just read the threads you wouldn’t keep making such a fool of yourself.
I said twice that correlation does not imply causation. The only person suggesting that was bnice2000. He’s the one who posted the graph showing the correlation between Sunshine and Temperatures, and implied that was proof of a cause. I merely agreed there was a correlation.
You still are suggesting you can get as good a correlation between taxation and temperature as you can between sunshine or CO2, but as always you refuse to provide any evidence, and ignore the graph I gave you showing that this was unlikely. And of course, you ignore the fact that whilst correlation does not prove causation, there are better reasons to believe the both sunshine and CO2 will cause warming, than taxation.
“Add up all the taxes paid by the typical citizen; federal income Tax, regional income tax, property tax, state sales tax, county sales tax, city sales tax, school district tax, and anything else you can think of.”
If I ever need help with my taxes, I’m not coming to you for advice. None of those are taxes in England.
“You will find a steady rise in the amount of taxes paid per year”
And your evidence for that is…?
I assume you are ignoring inflation in that, in which case you are just saying you want to believe there is a correlation between rising prices or GDP rather than taxation – but as always you base this on guesswork rather than checking the figures.
As I said, in the UK taxation rose immensely after WW2 – it hasn’t changed that much since, as a percentage of GDP. It was highest in the 70s, and then dropped a little, but has increased over the last few years.
None of this resembles the changes in temperature over that period.
“You keep posting CO2 vs temperature as if the relationship *MEANS* something. It doesn’t.”
Of course it means something. I can’t help it if you can’t figure out what that meaning is.
Evidence? When I built this house in 1985 the property tax was $800. Now, almost 40 years later, it’s over $3100 – a more than 400% increase. That is similar to almost everyone living in Kansas.
This is, in fact, a larger growth slope than temperature. But both are positive and are therefore correlated.
You keep saying correlation isn’t causation but continue to use the correlation as proof of CO2 causing temperature increase. If you don’t believe that then stop posting it. Actions speak larger than words.
“Evidence?”
Your evidence is two anecdotal data points, from a single tax, in a single country that isn’t even the right one. And you ignore inflation.
And all this to prove a point that no one disputes. You can always find spurious correlations, and correlation does not imply causation.
You still haven’t figured out that the graph you were complaining about is not about CO2, but the correlation between hours of sunshine and temperature.
“but continue to use the correlation as proof of CO2 causing temperature increase.”
I do not. That’s just your own imaginary straw men. I’ve always stressed that the correlation between CO2 and temperatures does not “prove” it’s the cause. That’s not how science or statistics work. You never prove a hypothesis. All I’ve ever said is it proves that people here insisting there is no correlation, are wrong.
What the correlation is is evidence. Evidence of a long proposed hypothesis that increasing CO2 will rise temperatures. There is no similar hypothesis that rising taxes, postage, storks, or any other nonsense you propose will increase temperature.
And please, don’t try to be so stupid as to blame the extra UK sunshine on human CO2
That would be stupidly idiotic, even for you.
BEST .. => you mean WORST.
Massive Urban warming effects from all the very WORST sites.
So, as always, which data set do you want to use to justify the claim that Norway is as cold today as it was at the start of the 20th century?
And there was silence…
FMI (Finnish Meteorological Institute) reports:
The average temperature for November 2023 in Finland was mostly 1.5-3.5 degC below the average for the reference period 1991-2020, in Lapland the average temperature was mainly 3-5.5 degC below the average.
In Sodankylä, Finnish Lapland, average November temperature for the reference period 1991-2020 was -5.8 degC. In November 2023 Sodankylä’s average temperature was -10.9 degC, 5.1 degC colder.
November 2023 was 18th coldest out of 116 Novembers since 1908 in Sodankylä, Finland.
–
SMHI (Swedish Meteorological and Hydrological Institute) reports:
The month (November 2023) was colder than normal throughout the country, and in large parts of Norrland (Swedish Lapland),
Svealand and also parts of Götaland, it has not been this cold since November 2010.
November 2010 was 14th coldest November out of those 116 in Sodankyla.
–
MET Norway (Norwegian Meteorological Institute) reports:
Coldest November since 2010 in Norway. In Norway, November 2023 was cold and ended 3.5 degrees below normal.
And yet, UAH reports that November 2023 was the warmest November on record globally since their record began in 1979.
You think that “the coldest November in Norway since 2010” somehow negates this.
Says it all.
Data, unadjusted, clearly shows a large peak in Norway in the 1940s
Colder than 2010, makes it well below that peak.
Also colder than the mid 1970.. (can you read a basic graph yet ??
Try not to remain so incredibly ignorant.
When I actually looked at the Berkeley Earth raw data and found they attributed measurement uncertainty in the tenths digit to some measurements in the 1700’s I abandoned belief in anything that uses their data. Their answer was that actual measurement uncertainty would be used in any analysis – while it was unstated I took their meaning as they would assume zero measurement uncertainty and take the stated value as 100% accurate.
It’s getting ridiculous – and boring.
These guys are trapped in a time warp.
Poor Fungal. Your mind is stuck in time. !
It has no proven movement or functionality.
Please tell us again , how forests grew 1000 years ago where now there are glaciers.
Please tell us how tree lines 1000 or so years ago were far higher up mountains and a lot further north.
The little moron can’t understand your obvious point which is why he ducks all the time.
It was clearly warmer than now a 1,000 years ago.
Yes, your chicken-little PANIC and fixation on a small increase in temperature due to a strong El Nino..
… is incredibly boring !!
I’m not claiming there has been continuous warming since the 17th century. There has been cyclical warming and cooling since the 17th century. It’s the way of the world.
You are correct, the 17th century is not the Early Twentieth Century.
“And once again,. your graphs are not showing annual average temperatures, they are showing a single monthly maximum temperature, and only go up to 2012. Also, apart from one cold year in 2012 and a couple of hot years at the start, that graph does not show temperatures just as warm in the early 20th century.”
Nitpiks that don’t change the facts.
If you don’t like Tmax charts then here are about 600 Tavg charts from all over the world that also show it was just as warm in the Early Twentieth Century as it is today.
https://notrickszone.com/600-non-warming-graphs-1/
Are you going to nitpik them, too?
Let me guess: You will say: Oh, that’s not a global average! As if that has some meaning before the satellite era.
You believe in bogus, bastardized Hockey Stick charts and I don’t. The reason I don’t is because the written, historical temperature record (see above) shows that the Hockey Stick does not represent reality.
How do you reconcile the Hockey Stick chart profile with the written record? They look nothing alike. One, the Hockey Stick, is a scary scenario (deliberately). The other, the written records show we have nothing to worry about from CO2.
The written record temperature profile looks one way, and the data mannipulators fire up their computers and come out with a completely different temperature profile that just happens to fit their political/self agrandizing agenda. How convenient. And you believe in these guys! Wake up and smell the coffee. The temperature profile you believe in doesn’t exist in the real world.
“The temperature profile you believe in doesn’t exist in the real world.”
Tom,
Respectfully, the bottom line is that measurement uncertainty in the temperature record overshadows *all* the trends, no matter what data is used.
-Systematic uncertainty in the measurement devices is NEVER properly evaluated, not in the 17th century and not even in the 21st century.
-Environmental measurement uncertainty (think UHI) is not properly evaluated, not in the 17th century and not even in the 21st century.
-Statistical analysis of the temperatures is not done properly. No weighting or normalization is done when combining winter temps in one hemisphere with summer temps in the other hemisphere. Meaning any averages of the temps without proper attention to the variances associated with them only adds to the measurement uncertainties inherent in the measurements themselves. The proof of the pudding is that you never, NEVER, see any analysis of variance in any study done in climate science.
Trying to find a difference of 1C in the global average temperature, even today, is a fool’s errand, let alone a change of 4-5C. The measurement uncertainty associated with the data is far wider than that, meaning actual trends are UNKNOWN.
The only *real* measurement we can depend on are the ones that brice keeps asking about. Why are we finding things under glaciers? Why were tree lines in the past higher than they are today?
I’ve not seen a single, documented climate study or model that can answer those two simple questions. Both questions lead to only one conclusion – it was warmer in the past than it is today. Bellman, FinalNail, and all the other CAGW advocates can’t provide any evidence to invalidate those two simple observations.
Exactly. And the more the anomalies are averaged together, the less representative it is of the real word. They literally don’t understand that anomalies are not temperatures. We also can look at the sea ice extent in the Arctic during the melt season or maybe the snow extent per season from Rutgers University for clues. It all paints a much more complicated picture than the mainstream community would have us believe.
“I’m not claiming there has been continuous warming since the 17th century”
No. That was Milo
You just butted into the discussion with your own pet peeves.
“If you don’t like Tmax charts then here are about 600 Tavg charts from all over the world that also show it was just as warm in the Early Twentieth Century as it is today.”
I’ve nothing against looking at maximum temperatures, or minimum temperatures. But if you are making a claim about global average temperatures, as in the UAH data, it’s a distraction. Just cherry-picking one aspect of the global picture. “Summer day time temperatures haven’t risen much in Norway, so UAH is wrong to show the global average annual temperature rising” seems to be the extent of this logic.
“Are you going to nitpik them, too?”
It’s becoming an irregular verb. “I think the data is flawed” “You nitpick”.
Pointing out flaws in the evidence is part of the scientific process. Dismissing it as “nitpicking” is just a way of ignoring the objections.
But I have no intention of trawling through 600 scientific papers. From past experience these No Tricks Zone Gish Gallops a just them cherry-picking some graph or other with little regard to the actual content. We are supposed to be impressed by the numbers and ignore the actual papers.
“You will say: Oh, that’s not a global average!”
Which is an important point. Hundreds of papers all showing different trends for different time periods do not make a global record. And whenever someone constructs a global record from these different proxies, you’ll just reject it out of hand if it doesn’t give the results you want.
“You believe in bogus, bastardized Hockey Stick charts and I don’t.”
And there you go proving my point.
If you don’t agree with any of the current global constructions, you need to produce a global construction that does demonstrate no warming, rather than just say you don’t believe it.
So here’s the second of the No Tricks Zone papers.
https://baikalproject.artsrn.ualberta.ca/wp-content/uploads/2020/12/Tarasov-et-al_2020_QI_Environments-during-the-spread.pdf
It’s not original research, but quotes a number of different studies. The claim highlighted by NTZ is that in Siberia, summers where much warmer than to day – during the height of the last glaciation.
Do you really think that proves anything about global temperatures. Do you think it was globally warmer during the last ice age?
NTZ doesn’t highlight the part which says “These factors apparently outweighed the harsh colder-than-present winter conditions”
Quite a few of the papers are about how much warmer it was during thew last ice age.
Then we get to one about Argentina
So that means the warm and humid conditions lasted to somewhere between 1670 to 1910, (1790 ± 120). So much for the Maunder Minimum.
You’re wrong Bellman. The Maunder Minimum had a substantial impact on our climate. Aren’t you aware that the Thames River would freeze during the winter months? Every February, citizens in the area would have winter festivals. Regarding your post about the Siberian Arctic, you are making people’s points here. It was seemingly ‘made up for’ with colder winters. That just goes to show the regional chaotic and NON LINEAR relationship of the weather and the useless of anomalies. I think this is why Tom uses the highest Maximum temperature; to see the distribution of highest possible temperature and how it’s changed over time. More useful metric.
It’s all a big joke anyway. Send in the clowns. Temperature does not define climate. If it did then when the temperature in Las Vegas and Miami are the same the climate would be the same. But that’s not reality – unless you are a climate scientist, statistician, or computer programmer.
The USDA Planting Zone map is a better indicator of climate than any of the temperature data sets. It’s based on average minimum winter temps. And even it isn’t perfect because it doesn’t consider precipitation in defining the regions.
Even the growing degree-day map put out by the US NPN network is a better indicator of climate than the temperature data sets.
Climate science is living in the 17th century as far as actual science is concerned and doesn’t even realize it!
“You’re wrong Bellman. The Maunder Minimum had a substantial impact on our climate.”
It’s not me saying the Maunder Minimum period was much hotter, it’s the paper Tom Abbott brought up. I’m pointing out it’s regional, not global. It might have been much hotter in parts of Argentina at that time, but definitely not in Northern Europe, and North America.
“Aren’t you aware that the Thames River would freeze during the winter months?”
Why is everyone so obsessed with this, and think no one else has ever heard of frost fairs. The Thames occasionally froze in London. It hasn’t happened since the Old London Bridge was taken down. That doesn’t mean that we never have cold winters, it’s just that the Thames is a different river now.
“Every February, citizens in the area would have winter festivals.”
Not on the Thames they didn’t. I think there were only around 10 recorded Fairs.
Did they keep a record for every freeze fair that occurred? The recorded times it did freeze took place during the Little Ice Age (695, 1608, 1683, 1684, 1716, 1739, 1740, 1789, 1814); certainly not common at the time but frequent enough for one to notice the variance of these events and question the possibility of a much colder regime in the country.
“but it has caused an underlying warming trend”
No.
Yes.
NO, there is no warming apart from El Ninos.
You keep proving that. !
The old ‘count the El Ninos but ignore the La Ninas’ routine.. again.
It will never get too ludicrous for you, will it?
The real problem is your total lack of any understanding of either El Nino, or La Nina.
Your mind has the functionality of a 5-year-old…
.. and you obviously have no desire to progress past that state of child-like non-development.
No warming between El Ninos..
STOP IGNORING THE DATA. !
You should stop saying that as if it is a known fact. It may come back to bite you.
It is wise to have doubt in the lack of empirical evidence.
This site, amongst a very few and diminishing others, are the very last, dying bastions of idiocy that reject this simple observation. People find you funny now; or rather to be pitied than scorned. It’s sad – and a bit funny.
Your lack of self-awareness is truly flabbergasting. You believe that we are all so stupid yet you’re here engaging with us. If we were so stupid, why would you waste your time? The precious time we have all been given should be spent wisely and to the fullest. Which of your posts have been intellectually engaging? None as far as I recall.
No Walter, I freely admit that I am as stupid as most of the posters here. Otherwise, as you say, I wouldn’t be here.
I’m just stupid in a different way.
This is a site designed to cater for idiots; and I am one of them too.
I freely admit that I am as stupid as most of the posters here.
No, much more. You just admitted you believe in AWG, with only a spurious correlation as your ”evidence,” and that the latest update adds to the warming trend. You sir, are an idiot.
What is the correct ECS figure?
“What is the correct ECS figure?”
Good question.
The answer is nobody knows the answer to that question.
It can’t be much because it is no warmer today with a lot more CO2 in the atmosphere than it has been in the past with less CO2 in the atmosphere.
CO2 seems to be, at best, a minor factor in determining the Earth’s temperatures. So minor it is undetectable and not worth worrying about.
Why are you being so obnoxious Rusty?
Manifestly this blog is not primarily frequented by idiots. The odd unthinking alarmist happens by to be sure, but we tolerate you because you’re a useful foil.
“I’m just stupid in a different way.”
You are STUPID in every conceivable way.
You are so dumb that you just don’t realise it.!
This site caters for people who want to discuss facts and data..
You are NOT one of those people..
This site allows idiots like you to post, because it shows just how incredibly gormless, ignorant and stupid the below-average climate apostle really is.
You are the one in total DENIAL of the fact that there is NO WARMING apart from El Nino events
You are the one totally incapable of producing one single bit of evidence for human causation
You are the one STILL unable to explain how trees grew 1000 years ago, where there are now glaciers.
Your comments are basically empty, know-nothing comments.. as you have admitted on many occasions.
Love to the family.
“ this simple observation.”
Show us this “simple observation” that CO2 has caused the El Nino warming.
This should be hilarious 🙂
You do know that warming by atmospheric CO2 has never been observed or measured anywhere on this planet or any other planet, don’t you.
You are a spokeperson for “People” now?
You are welcome to your opinion, but you don’t speak for everyone as you imply. You speak for a small minority on this website.
Keep things in perspective.
You stated it as a known fact that the 2016 peak would not be topped. How did that work out?
I did no such thing. I said that I personally was sure the 2016 peak would not be topped. I was wrong and rather surprised, as is everyone else, about this latest unexplained peak. I also said that I expected one or two or more peaks lower than 2016 as we crest the top of a series of interacting waves. See below. My view has not been changed by your claim that co2 is causing the climb in temperature.
CRU data has huge amounts of urban and airport warming in it.
It is not a viable product for “climate” discussion.
That is very likely but it still clearly shows the AMO cycle even if the peak post 1980 is too high.
Here and here. That second one was proven wrong 25 days later making it one of the worst predictions I’ve ever seen.
I updated the graph for you.
If you’re own dataset isn’t enough to convince you then what will?
CRU data is meaningless for “climate” use.
It is massively tainted by urban, airport, mal-adjustments.
Only a mindless zealot would use it to try to prove anything.
I’m going to let you and Mike duke that out on your own.
What you’ve added shows 2016 about 0.4 degrees higher than 1998
UAH shows it about 0.1 higher. So there’s that…
You’re the one who picked CRU…
It’s the only one I had showing what I wanted to…sine waves in the temperature record. UAH is still too short.
Convince me? Of what exactly?
That the global average temperature is not cresting the top of interacting waves.
No. It doesn’t.
Your own dataset says it is not cresting the top of interacting waves.
“but it has caused an underlying warming trend”
Making stuff up again, hey Bellboy
There is NO underlying warming trend.
The trend between El Ninos is basically ZERO !
They can’t handle it which is why they mostly ignore it as it makes CO2 a non factor.
And so-called experts continue to loudly discuss how many angels may dance on the head of a pin.
Fact. Climate has always changed. Fact. Weather will vary by region. Fact. Mankind will adapt. Always have, always will.
Looks like a repeat of 98 likely followed by a warmer pause. There have been three long pauses, each of the later two following a super El Niño and each warmer than its predecessor. All of the warming to date is due to those two El Niños. There is no GHG warming at all. Looks to be happening again.
See https://www.cfact.org/2021/01/15/the-new-pause/
“There is no GHG warming at all.”
I have made this point many, many times..
There is no evidence of any warming by CO2 in the atmospheric temperature data.
No evidence of any human causation.
NONE WHAT-SO-EVER
Very shouty, isn’t he? You often get that with people who are unsure of themselves.
Great that you continue to agree totally with my statements… 🙂
I’ve doing the bolding for the benefit of naughty, inattentive back-row little children like you.
Seems to have finally got your attention.
So you’re sure of the contrary ten?
then!
Someone down-voted me for correcting a typo 😀
I’m not sure about anything, and everything I think I know might be wrong. I’ll let theveviden
What “theveviden”
.. you have never presented any !
You keep proving me correct.
Sorry, I collapsed from boredom halfway through posting and my head must have hit the send button.
Thankfully, I don’t have to keep proving that you are an idiot, since you do such a resolute job of doing that all by yourself.
You mean you single functional brain-cell ceased to function..
Went back to normal operation mode. !
You haven’t posted a single thing of any relevance to the subject.. none whatsoever.
Every comment you make is deeply embedded with your deep-seated ignorance.
You still can’t explain basic tree growth.
You still can’t produce any evidence of human causation.
It is not me that looks like the moronic and clueless idiot….
Keep preening yourself in the mirror.. and try to find a bit of your brain-matter that actually functions.
All of his comments are meant to stir people.
“and everything I think I know might be wrong”
Provably so. !
Bravo Rusty! The first step is to admit you have a problem.
“Theveviden” (using my linguistics training, I will guess that was supposed to be “The evidence”. Using my clairvoyance, I will guess that “speak for itself” is the missing rest of the sentence).
Anyway, the evidence doesn’t say anything more than that it indicates a correlation with CO2 concentration. A correlation that would only imply a beneficial mild climate improvement if indeed there is any causality.
Let’s all hope that the nice weather holds!
In fact, before I passed out, I was paraphrasing Richard Feynman. His point was that science should never claim to be absolutely certain about anything. Some hypotheses are just massively more probable than others, based on observable evidence and theoretical conjecture.
Anyone who claims certainty, whether a climate scientist or a ‘sceptic’, is making a schoolboy error. Hence, anyone who says the ‘science is settled’ about climate science or any other science subject is de facto wrong.
It was from a BBC interview shortly before he died. He was making the point to justify his atheism. He said scientists are, or at least should be, prepared to admit that their theories may be wrong; but seldom will you find a religious person who will admit they may be wrong about their faith. A very slippery slope that way lies and religions discourage scepticism.
I think there are many parallels with the debates we have here.
“Some hypotheses are just massively more probable than others, based on observable evidence and theoretical conjecture.”
Yep.. human caused climate change is not in that category.
It has no observable evidence, its conjectures are based on anti-physics and lies.
Every prediction made has been a massive failure.
You are basically admitting you have absolutely no evidence to support human causation.
You have just hammered the final nail in your own mind-free coffin. !
I am certain you are TOTALLY INCAPABLE of producing one bit of scientific evidence of human causation.
And every post you make proves me correct.
Thank you.
CMIP3 vrs surface temperatures…. (not a ‘massive failure’).
That temperature farce is fromurban sites that are unfit-for-purpose, adjusted and fabricated non-data.
…. then deliberately mal-adjusted to match the models.
You know that. Everyone knows that.
MASSIVE FAILURE of science. !
Having to rely totally on urban warming.. sadly pathetic, isn’t it !
The bogus Hockey Stick chart is the only thing the climate change alarmists have to show as “evidence” that CO2 is correlated with temperatures.
The climate change alarmists throw the Hockey Stick chart out there like that’s the last word on the subject.
Here’s how to identify a bogus, bastardized Hockey Stick global “temperature” chart:
If the chart does not show the Early Twentieth Century as being just as warm as today, then you are looking at a bogus, bastardized, divorced-from-reality, Hockey Stick chart. Like the one above.
Or you could just download global CO2 concentration versus global temperature data. There is an obvious, and I mean slap in the face obvious, correlation between the two.
But you, Tom, will never accept that obvious fact. You seem to be almost genetically engineered to reject any evidence whatsoever that contradicts your world view.
What is it with you? Some religious thing or something?
Strictly, it should be ln(CO2) or, as Nick pointed out, forcing.
CO2 is a reasonable approximation within the current range, though.
As it turns out, there is a reasonable linear fit above 320 ppm (1965).
Below 309 ppm (about 1910) or maybe 310 ppm (1935), there is a (noisy) negative correlation.
What stands out like a sore thumb (use cruder analogy if preferred) is a sharp spike centred on 315 ppm (1945)
The cult AGW religion…
… the brain-washed, mindless anti-science “belief”..
.. is all YOURS, Foolish Nonce.
A very short term very bad correlation
Gees.. is that all the “science” you have.
Seems you still have absolutely NOTHING. !
Seems you were slapped in the face. or the back of the head… at every opportunity.
It has addled your tiny little mind… to the point of non-functionality.
Correlation… you mean like this ??
Have you no basic intelligence at all ??? !
And NO.. there is NO CORRELATION between CO2 and atmospheric temperatures in the last 45 year.. NONE WHAT SO EVER.
CO2 continues to climb at a steady rate (thank goodness for world plant life and human crop growth)
Atmospheric temperature only steps up at El Nino events, and has been either ZERO TREND or cooling for all but 5 or 6 of those 45 years.
That is a NON-CORRELATION. !
Ohh… so you think correlation is all the “science” that is needed
(you don’t realise how “anti-science” that is, do you, foolish nonce.)
That mean you MUST ACCEPT that oceans seismic activity is the main cause of global warming.
Ocean seismic activity is far, far better correlation to atmospheric temperature than CO2 is….
…and actually has a feasible mechanism.. which CO2 most certainly DOES NOT.
Ask you minder where best to apply heat to boil water.. maybe you might comprehend…. or not
Or you could download US postal rates and graph them against temperature. There is a slap in the face obvious correlation between the two.
What I find interesting is the lack of variability. 0.03 degrees over 3 months.
The combined effects of El Nino, Tongan water in the stratosphere and cleaner air from low sulfur bunker fuel remain the same.
Are any measuring instruments pointed at that large alien IR source irradiating the planet?
Yes. The sun irradiates in various spectra, however.
Scafetta has found an ECS of 1C is more realistic from a re-evaluation of TSI proxies. (assuming we can even ever quantify an ECS) If that is correct, we have already passed it and this latest spike (among others) is definitely not due to co2.
https://www.sciencedirect.com/science/article/pii/S1674987123001172
What I can’t understand is how the WUWT Real-time Global temperature has hardly changed all year from 14.1oC, and yet UHT has gone up enormously?
Real-time Global Temperature
(updated every 1-2 minutes)
57.53°F / 14.18°C
Deviation: 0.33°F / 0.18°C
Stations processed last hour: 55818
Last station processed: Beaufort, United States
For source/info see:
https://temperature.global
The two are not measurements of the same quantity.
Simples. Although the alarmists try to hide the inconvenient fact,
Because of axial tilt, the earth’s orbit around the sun, difference ini land/water ratio and albedo between N/S hemishere and dobtless other factors Global Temperature varies over the year. It rises by 3.8°C from January to June each year and falls by 3.8°C from June to January each year.
Neither UHT nor WUWT “Global Temperautre” tell us what the current “Global Temperature” is (if there is such a thing and it can be measured)
WUWT Global Temperature is actually the average termperature over the last 12 months, not the current temperature so it will only ever vary very slightly and will never reflect that 3.8°C range.:
See the “Source/Info link”
The current temperature is the 12M average mean surface temperature over the last 12 months …
UHT is the anomaly from the average temperature for the month
The oceans are still likely shedding a ton of heat built up during the unusually long La Niña that we just came out of. Remember, this spike in temperature only began this past summer. This hardly represents a “trend”. It’s nowhere near even a year old.
But it increases the trend that was already apparent.
No, it doesn’t. The trend since Feb 2016 was down. The longer-term warming cycle since AD 1695 is clearly not from more plant food in the air.
No, this latest update makes the trend in UAH since Feb 2016 +0.06C per decade warming.
Keep up.
Except it is NOT a linear trend.
It is step-wise warming at strong El Nino evets, with long periods of zero trend between.
There is no evidence of anything but natural causation.
If the step-wise increase in global temperatures are due to continued heat loss from the oceans then at some point the global temp will stabilize and then decrease as the ocean provides less and less of a step forcing. The ocean isn’t an infinite heat source. If, as conjectured, we are heading into a period of reduced sun insolation then at some point we *will* see a declining trend in global temps.
Nothing lasts forever, if it did we would live in a far different universe than our actual reality. If we do enter a declining trend in this century then the greenies destruction of our energy sector then be equated in history with the Dark Ages.
Harking back to the conversation about the ridiculousness of averaging temperature, this is really just a subset of derivatives we are looking at. If even in this particular subset people are questioning the effect of GHGs, that’s saying a lot. The rate of warming among these data points have been pretty slow. In this subset, we can see the effects of El Niño, La Niña, volcanic eruptions, and now this mysterious spike and that speaks to how powerful their influence is. I imagine Co2 influence must be negligible or maybe even nonexistent.
Yes it is a linear trend. I t was calculated using linear regression, available to anyone who possesses a spreadsheet.
Does your ignorance know no bounds?
Gawad your ignorance is breathtaking!
Warming comes in steps due to El-Nino’s flat to cooling between El-Nino’s.
There is no CO2 signal in it.
“Yes it is a linear trend”
OMG , your ignorance is off the charts.
A sudden transient is NOT a linear trend.
Even a blind monkey would realise that.
Did you fail primary school completely ??
No-one could be as gormless as you are without being a complete primary school drop-out.
Maybe you should make friend with Greta,, she never learnt anything at school either. !
Lol
Only a complete climate nincompoo would use a strong El Nino transient to say there is a trend.
“Only a complete climate nincompoo”
Too funny… it’s “nincompoop.” I thought you of all people would know that.
I used the exact word I mean to use.
It is more appropriate for cretins like you. !
There is not a lot of difference between poo and poop…. especially in your case.
“I used the exact word I mean to use.”
I bet you did. Only a man/boy like you who thinks it’s clever to use a childish putdown word like nincompoop, would think “nincompoo” was even more clever. If nothing else you you cheer me up/make me laugh.
Is your “uncle” still sniffing your farts ?
We’re flip-flopping around here – again.
I was responding to the specific claim by Milo that there is no linear warming trend in UAH since Feb 2016.
Like a true ‘sceptic’, as opposed to a fake one, I checked that. And it’s wrong. It’s fake. It’s nonsense.
There is a warming trend in the UAH data since Feb 2016. Easy to check for yourselves (but you won’t).
You misquote me. There was a cooling trend even in GISS from Feb 2016 to at least July 2023. You could look it up. Why do you lie?
Since you have now accepted that the current warm transient is totally natural (being that you are totally unable to produce any human causation)…
and that the El Nino has broken a COOLING trend…
.. that means that you have conceded that there is no evidence of human caused warming.
Thank.. you have finally got there.
Monkeys with rulers.
You are insulting the monkeys !!
They have far more intelligence than this pair of gormless ignoramuses.
The essence of Trendology.
You have also conceded, by your non-response, the FACT that it was considerably warmer only 1000 years ago during the MWP, allowing trees to grow where now there are glaciers.
Maybe you are capable of learning…very, very slowly.
Now.. no taking 1 tiny step forward, then 10 steps back, like you usually do. !
NO… there is absolutely zero trend between the El Nino events.
Cooling since the 2016 El Nino.
Absolutely no evidence of any warming by atmospheric CO2..
Just these solar driven El Nino events.
“Just these solar driven El Nino events.”
Or possibly geothermal.
https://youtu.be/HPkZj6Mx6d0?feature=shared
Yep, I have mentioned geothermal at other times.
Evidence is not solid, but at least there is the physical reality of very hot vents below water.
Lagged ocean seismic data matches atmospheric temperature FAR better than CO2 does.
The “apparent” trend, apart from at El Nino events…
… is basically ZERO…. or cooling since 2016.
As long as you continue to use the strong El Nino events to say there is a warming trend…
… you are ADMITTING there is no human causation..
There is NO CLIMATE EMERGENCY, Rusty!
So the warmest November on record globally follows the warmest October on record globally which follows the warmest September on record… right back to July. 2023 will undoubtedly be the warmest year on record globally according to all global temperature data sets, including our beloved UAH.
None of which obviously have anything to do with CO2.
You seem to be obsessed with CO2, Milo.
All I’m saying is that it is continuing to warm very much along the lines that climate scientists have been forecasting for decades now. So….?
What is the primary basis for the forecast? Something other than CO2?
Au contraire. Alarmists are obsessed with the “control knob” of CO2. I say it’s a negligible effect at best.
“ I say it’s a negligible effect at best.”
Sorry and you are qualified how?
Anyone is FAR MORE qualified that you could ever be.
Milo has a rational, functional brain… you.. no evidence you have one.,
Are you qualified to agree with Mann et.al.?
Ah….
Fungal has just admitted that the fixation on reducing CO2 emissions by self-styled climate-scientists is stupid and idiotic.
He apparently KNOWS it is nothing to do with CO2.
Welcome to the enlightened side, Fungal.
“along the lines that climate scientists have been forecasting”
Show us where this “climate science” predicts El Ninos causing the only warming.
Show us where they predict long period of zero warming between these El Nino events.
Sorry, but like most of your comments…. you are just talking nonsense and gibberish.
There are no “climate scientists.” There are climatologists, who are real scientists, and GIGO computer gamers who fudge general circulation models.
Since temperatures will either increase or decrease over time, climate “scientists” will have a 50% chance of being right purely by chance.
There is a third option which is…Or stay much the same… so they have done pretty well really. People here on the other hand….
So, you admit temperatures have stayed “much the same”.
You really are making an abject FOOL of yourself with your petty zero-intelligent bran-fart comments.
You uncle would be proud of you.
“So, you admit temperatures have stayed “much the same”.”
Nope you need to learn to understand words. You know those letters that are joined together….
You typed the words.
You need to understand what you are typing !
Get your “uncle” to help you next time. !
No Rusty, FOUL! The temperature has been going up in fits and starts, but way, WAY below the warming that was predicted. And the latest models are the worst ones EVAH!
In fact, there’s been a mild improvement to the climate for some time now. It’s a blessing but we can’t depend on it lasting. Eventually it will cool again and cold is BAD for humans.
Of course nihilistic Malthusian communists hate humans, so that’s why it’s so important to them to make sure they put a stop to anything and everything that leads to human flourishing.
There’s NO CLIMATE EMERGENCY!
Natural Solar- and wind powered El Ninos.
Do you have one iota of proof otherwise ??
Still waiting !
Oh… and still waiting for your explanation of how much warmer it must have been for forests to grow 1000 or so years ago, where now there are glaciers.
And how tree lines were much further north and significantly higher up mountains than they are now?
And why neolithic people crawled under glaciers to leave artifacts and bodies.
Why can’t you just enjoy it? If Co2 isn’t the cause, then why should we care? By the way, do you still subscribe to your notion that the oceans are finally releasing the heat from CO2 absorption?
Do you own your own battery car yet?
What is the optimum CO2 concentration in the atmosphere?
All C3 plants have already evolved to use 4X the amount of CO2 in the atmosphere. That was some real forward thinking from plants since only humans release CO2 into the atmosphere.
How small does the change have to be for you to admit that there’s NO CLIMATE EMERGENCY, Rusty?
Does any of this actually matter? The raw data has been so heavily manipulated in the assorted ARs produced by IPCC that they might as well just invent what they claim to be data and use that. This is all just a charade, and it’s been going on for three decades thanks to an assortment of characters like Mann, Jones, and a cast of hundreds.And let’s not forget the efforts of a gang of politicians like Tim Wirth or John Kerry who have enabled them.
As to those politicians, let’s also not forget the efforts of current ones like Justin Trudeau who foisted a massive carbon tax on the public and then granted region-specfic exemptions to buy votes.
So in the end, does any of this matter? It’s all just very dirty retail politics at its worst.
For over a decade now on this website, UAH has been held up as the ‘gold standard’ global temperature data set. (I don’t agree that it is, but….)
Now that UAH is also demonstrating the nonsense of global warming denial, it too is being thrown out of the pram.
Completely predictable.
Who is denying a mild modern warming? That as been obvious since the late 70’s
Nobody here. I think he’s just trying to get a reaction from bnice.
Now you are simply LYING since no one here disputes the warming trend since 1979 from Satellite data, the dispute is about the role of CO2 in the warming trend.
Really? I remember when I first visited this site there was practically nothing but denial that warming was even occurring.
The two stand-out articles I remember from those days were by Don Easterbrook and David Archibald, who were predicting imminent cooling due to the PDO or to solar forcing, or both.
Utter garbage at the time and it has proved to have been so.
So to say that ‘no one disputes warming’ is an advance towards reality at least; progress of a sort.
You have a hard time being honest because you lie so much.
I haven’t been a fan of Archibald’s cooling predictions because they have been wrong many here hardly mention him at all you are the first to mention him in the thread.
The IPCC predictions have been utter garbage which Andy points out over and over which YOU ignore because you can’t accept the obvious Step up El-Nino warming events that happens with a significant El-Nino and zero sign of CO2 effects because in between the El-Nino events there is cool down back to a lower level than stabilize to a generally flat trend until the next El-Nino shows up.
Your problem you suffer from is the inability to see it.
Why are you continuing to DENY that current temperature are well below those of only 1000 years ago.
Why are you continuing to DENY that nearly ALL the last 10,000 years have been considerably warmer than now.
Why can’t you answer questions about how trees grew where now there are glaciers.
Seems to everyone here that you are one very ignorant CLIMATE DENIER.
“ I remember when I first visited this site there was practically nothing but denial that warming was even occurring.”
Would that have been before 2015, in the middle of the 14 year ZERO TREND from 2001-2015..
Or was it after the 2015/16 El Nino when there was a distinct cooling trend ??
Seems that you would have arrived when there WAS no actual warming… or there was slight cooling… so everyone was correct.
The only warming currently, is from the rather strong El Nino.. you have admitted that several times. !
“no one here disputes the warming trend since 1979 from Satellite data”
bnice2000:
https://wattsupwiththat.com/2023/12/01/uah-global-temperature-update-for-november-2023-0-91-deg-c/#comment-3823868
No, bnice is saying there has been no underlying trend in between large El Niños or MYSTERIOUSLY abrupt spikes. That is correct. Look at the graph. Do you really not see staircases? Yes, there is an overall warming trend but it clearly has something to do with large El Niños.
ENSO has average 0.0 since 1979. So no, El Nino cannot explain the long term warming trend.
Bdgwx,
A monkey with a ruler can a draw straight line. Why is there no warming in between the large El Niños?
The warming when only El Nino months are included is +0.18 C/decade.
What a completely childish attempt. !!
Displaying your mathematical ignorance,.. yet again.
YOU ARE STILL USING THE EL NINOS TO CREATE THE TREND.
Ignorance of the mechanism of El Nino is NOT an excuse.
!
“No, bnice is saying there has been no underlying trend in between large El Niños or MYSTERIOUSLY abrupt spikes.”
Then he needs to understand what “underlying” means. The short gap between two El Niñ0s is not the underlying trend.
“Do you really not see staircases?”
No. And if I did I’d want to test that such a model made statistical sense, rather then being just an illusion caused by semi-random fluctuations around a persistent trend. Take a longer view and it’s clear how close the underlying warming follows a straight line, at the moment.
“Yes, there is an overall warming trend but it clearly has something to do with large El Niños.“
Sorry, I meant to post the 20 year graph.
Here’s the graph of my simple model using nothing but CO2 and ENSO conditions. The red line is what the model expects each month. It isn’t doing very well for the last few months as it assumes a lag of a few months between ENSO and UAH temperatures.
But the point is, using nothing but those, you can see how ENSO conditions create flat regions between El Niños. In no way does the model actually show a step change, there is no memory of El Niños, just the current state added to current level of CO2. Any steps you think you see are an illusion.
Your simple model.
OMG .. go back to kindy !!
Not simple enough for you it seems – the point went way over your head.
Meaningless “monkey with a ruler” crap !!
Which is all you ever seem to manage to produce.
Again.
The El Nino events cause the trend…
…. as you have shown many times before, without even realising you are doing it.
“Meaningless “monkey with a ruler” crap !!”
Says someone who keeps claiming that being able to draw a flat line between two El Niños proves that El Niños caused the trend..
(Do you get paid per exclamation mark?)
Bellman,
Once again, nobody is disputing the warming; only the cause of the warming. When trying to conclude what the climate is doing, simple linear regression exercises in Excel doesn’t give a complete picture.
There are people in this very article who are disputing the warming.
You are STILL using El Ninos to create a trend.
You can CLEARLY see the flat sections between El Ninos.
You FAIL YET AGAIN to produce anything meaningful !
ROFLMAO.
There you go again
Using the El Nino steps to create a trend
Sadly pathetic.. but hey.. they are all you have.
CRU data is massively contaminated by urban warming and homogenisation.
It should never be used for anything related to “climate”
An El Nino event..
So absolutely no human causation.
That does NOT line up with the “global warming” farce.
Fungal, is apparently a “climate” skeptic that doesn’t believe in CO2 warming.
Here we have wee bnasty putting the words “global warming” in sarcastic quotation marks right below a comment from Sunsettommy claiming that no one on this site says global warming isn’t happening!
You can’t make this stuff up. WUWT has become a parody account.
No one is fooled by your chronically dishonest claims and the lies you make are often easy to spot.
Seems that the fungal brainless one doesn’t know that the term “global warming™” is inimically linked to warming by human released CO2.
In fact. as the fungal nonce keeps proving…
… there is absolutely NO EVIDENCE of any human causation.
That means that in the AGW sense, “global warming™” is not happening.
What is really HILARIOUS is your continued inability and your petty ducking an weaving in running away from answering simple questions about trees growing under glaciers.
You can’t make up just how stupid, ignorant and petty that makes you look.
You make a complete mockery of yourself.
No evidence of any human causation in the slight but beneficial atmospheric warming since the LIA.
Get over it. !!
“You can’t make this stuff up. WUWT has become a parody account.”
Your real agenda here appears to be to try to denigrate WUWT. If you can’t argue the facts, then attack the messenger. Typical, agenda-driven tactics.
You are smearing a lot of good people as part of your effort to undermine WUWT.
It won’t work, btw. The facts are the facts.
FN is basically throwing its own s**t into a strong gale.
It is all coming straight back at him/her/it, coating him/her/it head-to-toe with stinking ignorance.
WUWT allows article that not only reject global warming, but reject the very idea of a global temperature altogether. Here is but one example. And, of course, just about every UAH update article and Monckton pause article are littered with comments rejecting the warming either because it is believed the data is all made up or its an artifact of the uncertainty in the data. To claim that no one denies the planet is warming here on WUWT is as absurd as it gets.
Anomalies cannot accurately represent what the weather is doing. What do you not understand about that?
We’re not discussing weather. Not that it matters since both the Celsius and Fahrenheit scales are anomalies themselves and used ubiquitously to represent what the weather is doing on a daily basis.
Allow me to demonstrate why you are wrong. In a weather station close to my residence, I observed that both February 1997 and February 1988 share the same anomaly of 3.2°F below the average. They are, however, distinct months, as shown below. February exhibits a temperature roller coaster in my region, likely influenced by relatively unstable atmospheric circulation. Utilizing this single anomaly in the context of a 30-year base period implies that it represents all conceivable weather variations, which is not the case – not by a long shot. When these anomalies are averaged with other singular combinations, the representation of the real-world weather conditions drops further. Averaging all months of the year to derive a yearly anomaly overlooks the fact that July in my area, for example, experiences much more stable climatic conditions. I presume this stability is due to a lack of consistent precipitation until the onset of the monsoon season, typically occurring in late July or early August. This is just a single weather station with relatively reliable data coverage. This is also under the assumption that these weather stations are measuring their local conditions as accurately as possible; a subject that, rightfully, has been heavily touched upon.
Maximum (°F)
Minimum (°F)
1997-02-01
43
26
1997-02-02
47
18
1997-02-03
38
14
1997-02-04
31
6
1997-02-05
27
13
1997-02-06
29
-11
1997-02-07
18
-14
1997-02-08
17
-18
1997-02-09
12
-16
1997-02-10
17
-17
1997-02-11
22
-5
1997-02-12
31
15
1997-02-13
35
1
1997-02-14
30
3
1997-02-15
36
16
1997-02-16
47
11
1997-02-17
38
11
1997-02-18
36
18
1997-02-19
36
4
1997-02-20
36
11
1997-02-21
32
-2
1997-02-22
28
5
1997-02-23
22
-3
1997-02-24
25
-13
1997-02-25
22
-12
1997-02-26
24
-2
1997-02-27
35
17
1997-02-28
35
5
Maximum (°F)
Minimum (°F)
1988-02-01
24
0
1988-02-02
21
-9
1988-02-03
15
-18
1988-02-04
11
-13
1988-02-05
17
-13
1988-02-06
18
-11
1988-02-07
23
-6
1988-02-08
29
6
1988-02-09
40
26
1988-02-10
38
22
1988-02-11
40
21
1988-02-12
43
7
1988-02-13
33
5
1988-02-14
34
5
1988-02-15
36
12
1988-02-16
35
18
1988-02-17
37
-4
1988-02-18
28
0
1988-02-19
28
-1
1988-02-20
32
3
1988-02-21
32
0
1988-02-22
39
3
1988-02-23
39
-3
1988-02-24
32
-3
1988-02-25
29
0
1988-02-26
31
1
1988-02-27
32
-2
1988-02-28
38
13
You are now talking about averaging. That’s fine. Just understand that an average and an anomaly are two different concepts. And yes, an average (not an anomaly) cannot always be used to represent weather especially when the averaging period is long.
In climate science anomalies are calculated from averages that aren’t really averages but mid-range daily temperatures. Since two locations with vastly different weather and climate can have the same mid-range daily temperature the mid-range daily temperature tells you nothing concerning either weather or climate.
Yes.. WUWT allows REALITY and SANITY into the discussion (one day you will see that, just have to break passed your child-like brain-washing)
It is not 100% subject to farcical AGW mantra.
Certainly the idea that you can get a realistic appraisal of global temperature from a hodge-podge of erratically spaced, massively urban and airport tainted surface sites…
.. then apply arbitrary “adjustments” by homogenising to the urban warming ..
.. is totally ludicrous. !
Temperature does not define climate. If it did then Las Vegas and Miami would have the same climate. The “global average temperature” has the same problem, it actually tells you nothing, zip, nada about the global climate. The fact that the global average temp is rising because it is MINIUMUM temps that are causing the average to go up is totally hidden by climate science. They don’t want people to know that because it would mean that the average going up is a GOOD THING and not an excuse for government power grabs by impoverishing the bourgeoisie.
Only warming in the satellite data has come at strong El Nino events
Do you have any evidence at all of any human causation ??
The global “average temperature” is a joke. If it actually told you something then we could say that if Las Vegas and Miami have the same daytime high temp then their climates must be the same!
Temperature does *NOT* define climate. And that includes “global climate”.
“To claim that no one denies the planet is warming here on WUWT is as absurd as it gets.”
We clearly say that there is warming.. but only at NATURAL El NINO events
Hence there is no evidence of any human causation.
Hence there is no evidence of Anthropogenic Global Warming.,
If you think you have some (other than by using urban temperatures and data manipulation),..
then present it.
…. or just go crawl back under your little slimy rock !!
What is predictable is that you continue to produce absolutely no evidence of human causation.
And you still have no answer of how much warmer it must have been for forests to have grown 1000 or so years ago where now there are glaciers.
Now.. tell us what we “deny” that you can provide solid scientific proof for.
We certainly don’t argue that there has been a tiny amount of very beneficial warming since the “new-ice-age” scare and extreme high Arctic sea ice around 1979.
We certainly don’t deny that El Nino events have been responsible for this slight warming.
Maybe it is YOU that is the “climate denier”
No-one denies there has been a warming trend in the atmosphere over the satellite record.
On the balance of probabilities the increasing CO2. concentration has been a factor in that warming.
As that increasing CO2 concentration has probably been mainly a result of the economic growth that has greatly improved the condition of humanity as well as a greener Earth, on balance it has been beneficial,
Of course there’s a mild warming trend. It’s been going on since the end of the Dalton Minimum. And of course it has had a beneficial effect on humans and the environment. The recovery from the Maunder Minimum did so as well, as attested by parish agricultural records. My original point was that UAH may indeed be an accurate record but it doesn’t matter. The climatistas will simply distort or manipulate the data to show whatever they want.
And given the bastardization that has distorted the scientific review process, the climate kultists can assemble whatever group of supposed reviewers they wish to grant a seal of approval to whatever nonsense they want to present. The religion called climatism isn’t troubled by either honesty or accuracy in what they pronounce.
Meanwhile thousands of private jets accumulate in Dubai, 70,000 come flooding in to attend a month-long global warming party of booze and whores just as they did last year for Egypt’s party place Sharm El Shaikh. And all the while, the global communist Antonio Guterres dances around with his clown face proclaiming that the world’s oceans are boiling.
Can anyone deny that the world would be better off if the Tombstone on the Hudson was leveled to the ground?
“that has greatly improved the condition of humanity as well as a greener Earth, on balance it has been beneficial,”
Ahh the third stage of the climate science denial.
Stage
1: It ain’t happening.
2: It might be happening, but it will be ok.
3. OK it is happening, but it will all be good for us.
4: OK it happened and there “was” major disruption to life, but no one told us it would be this bad. If the climate scientists had just warned us…. it’s all their fault.
Do you DENY that the slight warming since the LIA has been massively beneficial to all the planet.
Do you still DENY that the increase in atmospheric CO2 has also be HIGHLY beneficial life on the whole planet.
Seems that you are the one in DEEP DENIAL of REALITY !
Your “uncle” would be proud of your efforts to continue with your idiotic brain-farts… giggling mindlessly along with you.
The ONLY disruption to people’s lives has been from the AGW agenda and all the rampant scams that go along with it.
This is what you genuinely believe isn’t it.
I believe climate deniers are at one of these stages … Don’t you?
I think skeptics might be in categories 1,2 and 3, but since there is no evidence of any major disruption caused by CO2, I doubt many skeptics are in category 4.
Keep in mind, Simon, that not all skeptics look at all things the same way. I think you are painting with too broad a brush.
Climate hasn’t changed in my area since 1964 when I moved there.
BSk is the Koppen Climate Classification.
It is YOU who is denying that climate is mostly stable.
1: It ain’t happening.
You STILL haven’t produced any evidence of human caused warming.
So you FAIL at point 1.
That’s a big improvement
You normally FAIL before you even start. !
NASA clearly thinks CO2 is great for the planet,
Carbon Dioxide Fertilization Greening Earth, Study Finds
LINK
Once again, your argumentation is easily crushed.
I’m not arguing against that. I agree with it, in fact. That doesn’t mean CO2 isn’t a problem.
“That doesn’t mean CO2 isn’t a problem.”
Yet you continue to provide absolutely zero evidence that it is.
It is your cult-like “belief™, despite knowing you have no evidence, that makes you look like such a child-minded idiot !
The other thing that makes you moronically stupid is your denial that El Ninos are the only cause of warming in the satellite data, when the data is right there in front of you.
That really is a mark of abject and deliberate ignorance.!
What’s the big deal with a little cyclical warming?
We had a similar warming period in the 1930’s.
Then the temperatures cooled to the point that some scientists were wringing their hands in the 1970’s over the Earth going into another Ice Age.
Then in the 1980’s the temperatures warmed up again to the current level, equivalent to the warming in the 1930’s.
Now, if the climate operates in a cyclical manner, what comes next, after this current warming?
After the 1930’s warming, we had decades of cooling. Why shouldn’t we expect the same type of cyclical behavior in the future? CO2? That’s the claim. But we will see if temperatures continue up or not. One of these days the situation will reveal itself. My guess is this uptrend is getting a little long in the tooth. Time will tell.
The AMO has peaked soon it will be on its way down into the negative trend then a new cooling cycle begins.
Here is the Australia “pause” of 11 years plus, updated to end November 2023.
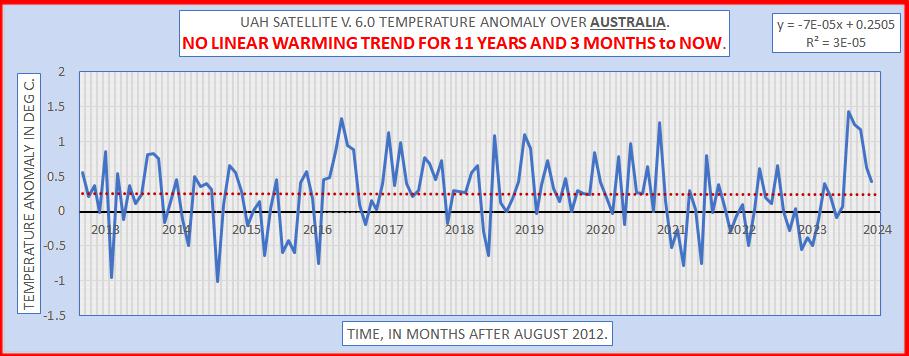
Geoff S
2021 was a cold year for you guys.
Southern Australia has still not warmed since then. No one here has grown a tomato plant in 3 years.
My wife has been growing tomatoes here in Tasmania. Outside and not in a greenhouse for the last few years.
How can anybody be surprised.
How can anybody say this is some sort of natural Cycle
How can any body blame re-radiated energy
How can anybody blame the ‘positions of the stars’
(No, not Madonna wrapping herself around a fireman’s pole)
What Spencer’s Sputnik is seeing is:
Spencer’s Sputnik is creating a true record of Soil Erosion.
To be properly scientific or technical, it is a record of Katabatic Heating. Also call it Foehn Effect heating or Lapse Rate Rate Heating as you wish, it’s all the same.
And it has totally fug all to do with CO₂
The very real problem is that Katabatic Heating of landscapes (cities also) is a self-reinforcing phenomenon, once it starts it gets relentlessly worse.
Even worse, it is powered by The Ocean = something that is bigger even than Michael Mann’s Ego and Andy Desslers Mouth combined.
we are in a lot of trouble here
to reinforce the idea and how it works:
It is the very working principle of Hadley Cell – which we all know and love.
Farmers with ploughs, tillage machines and PaddyFields are drying out the landscape and they freely admit to doing so.
They do so because Sugar Addicts demand that they do so.
Sugar Addicts are very poor scientists. (They are intrinsically lazy and thus also very poor husbands, parents, politicians, teachers, professors and even friends
(As we see all around us)
Ref the arguments about the El Niño above – take a look at ENSO NOAA website which shows neutral by autumn 2024. So short lived. The extraordinary lack of warming for three months hasn’t been remarked by the BBC .
The Nino 1.2 area started cooling over a month ago. Usually, that is a good sign the Nino 3.4 area will soon follow. Although nothing is ever exactly the same with ENSO, it looks like we have already hit the peak warmth for this El Nino and it will likely fade away. Of course, UAH always lags the Nino 3.4 by several months so it is likely to stay elevated through February.
Most folks continue to ignore the effect of Antarctic sea ice. It is sitting around 2 million sq km below average. At this time of year the sun is very strong in the SH. There’s a lot of energy not being reflect back to space. If it were to return to average values after the winter minimum. there would be a second cooling effect to start off 2024.
OK, slightly warmer here in WK in November. Should I be fearful? It’s still too dam cold for me. Crank it up another few degrees, please!
No flights, no trains in Munich up to Sunday, because of white global warming… 😀
FMI (Finnish Meteorological Institute) reports:
The average temperature for November 2023 in Finland was mostly 1.5-3.5 degC below the average for the reference period 1991-2020, in Lapland the average temperature was mainly 3-5.5 degC below the average.
In Sodankylä, Finnish Lapland, average November temperature for the reference period 1991-2020 was -5.8 degC. In November 2023 Sodankylä’s average temperature was -10.9 degC, 5.1 degC colder.
November 2023 was 18th coldest out of 116 Novembers since 1908 in Sodankylä, Finland.
–
SMHI (Swedish Meteorological and Hydrological Institute) reports:
The month (November 2023) was colder than normal throughout the country, and in large parts of Norrland (Swedish Lapland), Svealand and also parts of Götaland, it has not been this cold since November 2010.
November 2010 was 14th coldest November out of those 116 in Sodankyla.
–
MET Norway (Norwegian Meteorological Institute) reports:
Coldest November since 2010 in Norway. In Norway, November 2023 was cold and ended 3.5 degrees below normal.
Will be interesting to compare those reports to the UAH map for November when it comes out. !
The Tambora volcanic eruption occurred in April 1815, but the infamous northern hemisphere’s “Year Without a Summer” was recorded in 1816 … some 18 months later. The effects of the Tonga submarine volcanic eruption of January 13, 2022 are what we are seeing now.
Added on to El Nino and Antarctic sea ice reduction. A trifecta of natural warming effects.
There is nothing the gangsters running he climate mafia would not do to protect their multi-trillion dollar racket.
They have fired bullets into this mans office.
Where exactly is it warmer than it has been since 1979?
Not buying these numbers, it does not add up.
That’s bad and good news :
… and steal more money …
Re: Hunga Tonga
This is just a thought process, not an analysis.
Let’s start with the eruption in Jan 2022 throwing an unprecedented 150 million tons of water as water vapor (WV) into the stratosphere, and increasing levels to 13% above normal. Given that atmospheric/stratospheric water vapor is by far the strongest greenhouse gas and accounts for about 98% of the total worlds greenhouse effect, and given that the Jan injection had been distributed world-wide by March, one would have expected to see significant warming in eg the UAH temp record in Q2 2022, but that didn’t happen. One can surmise that, with the sun in a very low activity state, heat that was blocked by the stratospheric WV was dissipated by evaporation at the sea surface, and cloud formation blocked incoming heat due to elevated levels of cosmic rays. It seems that that atmospheric WV may have continued to accumulate until late 2022, resulting in far above normal rainfall in Southern Australia and southwestern USA (mainly California) through Q1 2023.
Then in Q1 2023 the sun went back into an active state, spiking in May 2023. The Oulu monitor showed a sharp drop in cosmic rays in Dec. 2022, followed by a larger drop in late March/early April 2023. This could have resulted in a major decline in cloud cover, a major increase in sunlight reaching the surface and a resulting rapid rise in surface temperature, as illustrated by Ryan Maue. Both sea and land temperatures rose to levels unprecedented in the modern period. Elevated temperatures persisted through summer and into fall 2023.
Now, recently, solar activity is dropping rapidly, implying a rise in cosmic rays and widespread increase in cloud cover. Over the last 3 months we have seen major and sometimes prolonged precipitation events leading to local, frequently unprecedented, flooding world-wide eg Libya, New England, NE France, the Philippines, Brazil, Afghanistan, most of Africa, etc. It seems that the excess atmospheric WV will have largely dissipated very soon and temperatures may rapidly return to normal. In fact we are seeing incidents of at least brief, unprecedented cold in many places, early snowfall in the Alps and the Rockies, and Russia 80% covered by snow, and unusual cold throughout Scandinavia in late Nov.
I have left El Nino out of all of this. Curiously there is some evidence that major volcanic events in the tropics trigger El Ninos about a year after the eruption, usually ascribed to atmospheric cooling from the volcanic aerosols. Hunga Tonga does not fit that description, but was very major, and has been followed by an El Nino. Strange. El Ninos transport heat from low to high latitudes, and result in further cooling, so 2024 could see significant cooling.
Whither next? – Also, solar cycles usually show spikes of activity 30 – 40 months after commencement, and that spike may or may not be followed by a higher one. This cycle 25 spike peaked 37 months after start. Given that the solar system barycenter (SSB) has switched from moving away from the solar center to moving nearer the solar center during 2022 (mass effect going from pull to push?) this spike might be the only one in cycle 25, and we are likely to be into a prolonged cooling period during the next 3 cycles. At least one scientist has forecast another “little ice age”, but that seems very unlikely given that the current Eddy cycle is nearing its warm peak, and the Bray cycle (see Andy May’s recent posting) is well off the bottom. Both were near bottom for the recent little ice age.
Spencer and Christy of UAH looked into the effects of the Hunga Tonga eruption on lower troposphere temperatures and concluded that its effects were likely to be minor – in the region of 1/100ths of a degree C. They published this in one of their monthly updates and haven’t commented on it since.
The climate/weather system is ill-understood. Particularly by you.
“were likely “…
roflmao..
I think there is a lot more to be learned about the Hunga-Tonga eruption.
Agreed.
By itself the event seems to have had a minor effect on temp as they concluded – but it set the stage through a prolonged increase in atmospheric WV to amplify the impact of a change in solar activity. It is the unlikely chain of events that matters. Spencer and Christy may not have yet connected the dots.
Since it hasn’t been stated explicitly I’ll do so now. The Monckton Pause has ended. If I’m not mistaken this is the last update Monckton provided.
Using the Monckton method the trend peaks at +0.36 C/decade starting in 2011/01 and obtains a minimum of +0.04 C/decade starting in 2015/12. The median of all Monckton trends is +0.17 C/decade.
With 2023/11 the new 13m centered average record is +0.42 C and the new 12m moving average record is +0.44 C.
As long as December comes in at -0.52 C or higher then 2023 will overtake 2016 for the annual record at +0.40 C. This a near certainty at this point.
Yes, and it took a major NATURAL El Nino to do it. !
There is absolutely no evidence of any human causation.
Because of the unexplained spike, which is weather not climate, so NOT CO2. And who says it won’t drop back down? The Arctic isn’t reporting any unusually warm temperatures relative to the 2015 baseline?
The spike is consistent with expectations.