Among the media sources serving as propagandists and cheerleaders for the “green energy transition,” two of the most prominent are the New York Times and Bloomberg News. To get an idea how the “transition” is going, let’s take a look at the latest from those two.
From the Times, in this morning’s print edition, we have a feature article that apparently first appeared online a couple of days ago, August 17. The headline is: “The Clean Energy Future Is Arriving Faster Than You Think.” The sub-head continues the excitement: “The United States is pivoting away from fossil fuels and toward wind, solar and other renewable energy, even in areas dominated by the oil and gas industries.”
But then Bloomberg News comes out yesterday with an editorial that seems to reach the exact opposite conclusion. Headline: “Net Zero Is Stalling Out. What Now?”
So which is it? Is the green energy future arriving “faster than you think,” or “stalling out”? Both can’t be right. Who has the better side of this?
Let’s look first at the Times piece. It is an uncritical litany of every possible piece of good news for the generation of electricity from wind and sun in the U.S. It is filled with more than twenty photographs and charts designed to impress you with the great progress being made: massive wind turbines, vast solar arrays, rows of EV charging stations, teams of serious-looking workers in a modern factory working away on some unnamed but clearly complex piece of equipment.
On the other hand, the piece is devoid of meaningful data on how the “transition” is progressing. Are wind and solar electricity actually making progress toward supplanting fossil fuels? You won’t find the answer to that here.
I’ll give you a few choice excerpts so you can get an idea of the technique:
Delivery vans in Pittsburgh. Buses in Milwaukee. Cranes loading freight at the Port of Los Angeles. Every municipal building in Houston. All are powered by electricity derived from the sun, wind or other sources of clean energy. . . . The nation that burned coal, oil and gas for more than a century to become the richest economy on the planet, as well as historically the most polluting, is rapidly shifting away from fossil fuels. A similar energy transition is already well underway in Europe and elsewhere. . . . Wind and solar power are breaking records. . . . Automakers have made electric vehicles central to their business strategies and are openly talking about an expiration date on the internal combustion engine. Heating, cooling, cooking and some manufacturing are going electric.
So what are these Bloomberg people talking about when they say that the “Net Zero” thing is “stalling out”? It turns out that they have plenty of data points, mostly (but not entirely) from Europe, and all relating to collapsing public support as costs become apparent:
[V]oters have legitimate questions about net-zero policies: How much will they cost? What benefits will they bring? Will they actually work as advertised? Such skepticism is already changing politics, from the recent losses suffered by Germany’s Greens to the fall of the Dutch governing coalition, which was partly fueled by farmers’ anger over forced reductions in nitrogen-oxide emissions. Even some avowed environmentalists — such as the governor of New Jersey and the leader of the UK’s Labor Party — have lately been siding with voters who feel aggrieved at the costs of environmental policies.
Can we get any actual data as to whether wind and solar energy are rapidly increasing their market share for energy production in the U.S.? The best source of information is the Energy Information Administration (part of the Department of Energy). The most recent two full years for which they have data are 2021 and 2022. Here’s the 2021 chart showing U.S. primary energy consumption by source:

Add up the percentages for petroleum (36%), natural gas (32%) and coal (11%), and you get 79% from fossil fuels in the aggregate.
And how about 2022? The chart is in a different format that is more difficult to read, but here is the key line of text: “Fossil fuels—petroleum, natural gas, and coal—accounted for 79% of total U.S. energy consumption in 2022.” Oh, that’s the exact same percentage as in 2021. It didn’t budge by even 1%.
Here is the chart they provide for 2022. As you can see, it is not so easy to calculate the percentages by source from this chart, but the general result is still obvious:

For 2023, EIA has put out monthly data through April as part of its Monthly Energy Review. There are no pretty charts, but through April fossil fuels have generated 26.082 quadrillion BTUs out of total primary energy consumption of 33.209 quadrillion BTUs. That would be 78.53% for fossil fuels. In other words, to the nearest whole percent, it’s still 79%. All the billions upon billions of government subsidies don’t seem to be moving the needle in any noticeable way.
To be fair, these figures reflect little if any of the massive subsidies brought forth by the big federal green energy bill (“Inflation Reduction Act” [sic]), which was signed a year ago on August 16, 2022 and is just getting cranked up. Will those subsidies move this needle at all? You would think that they couldn’t help moving the needle at least a little. But my own prediction is that the percent of primary energy from fossil fuels will decrease only minimally.
Over at Bloomberg, while they report honestly that Net Zero seems to be stalling out, they are not happy about it. What is the remedy? Obviously, the government planners directing the green energy transition need to go about this in a more “purposeful” and “strategic” manner:
If the government is going to ban the sale of gas boilers in 2035, as it says, it will need to make sure that cheaper alternatives are available. Likewise with a planned ban on new gas and diesel cars: It’s a fine goal, but it won’t go anywhere unless consumers have compelling incentives, charging infrastructure can meet demand and the government has otherwise laid the needed groundwork. . . . Above all, what’s needed is leadership. Decarbonization can drive economic growth, create jobs and bring substantial benefits to the environment and public health. But it must be done purposefully and strategically.
It’s the usual touching faith that central planning really is going to work this time, because it will be done more intelligently. No amount of real world failures will ever convince the true believers otherwise.
Central planning will not work. If anything in economics is well established, that is it.
Yup!>, Mao’s ‘Great Leap Forward’ all over again. Ultimate result: Economic calamity and pain for the population.
You really couldn’t make it up!
Green Leap Forward
1917 and the enforcement of Collective Farming – did not go well for the starved millions.
The highest consumption of global hydrocarbon energy in history (to date) will be in 2023.
Only to be beaten by 2024, 25, 26, 27………………
Four legs good, two legs bad! At least until the pigs learn to stand upright….
I dislike these types of blanket statements.
The reason the United States achieved its industrial powerhouse status in the 20th century (i.e. the early 1900s) was an economic and industrial policy of import tariffs and industrial consolidation from the late 1800s onward.
This is not very much different than what China has been doing for the past 30+ years.
Central planning as noted above is a stereotype of Marxist-Leninism in the USSR – yet the fact is that the Soviet Union went from a very 3rd rate European power to a superpower in 1 generation, including defeating Adolf’s industrial powerhouse Germany.
Nor is the Inflation Reduction Act, “central planning” by the above definition.
What it is, is massive subsidies which choose “winners” in the grid electricity space. If it were truly central planning, the nuclear and coal plants in the US would already be shut down and we would all have Mumbai type electricity – i.e. constant electricity black- and brown-outs.
Socialism is like Paracelsus’ rule on toxins, the dose makes the poison. Avoiding all central planning is near impossible, but enough of it is definitely toxic.
Russia was industrializing under the Czars, who were not a libertarian government, either. Making claims about an alternate history is unknowable, but making such claims about Dzugashvili is pure Stalinist spin.
Yes. Russia made great economic (and social) progress before WW1. I have read that the annual growth in GDP around that time was 14%. It all went haywire following WW1. Communist Russia did make industrial progress, but not social progress. Stalin was hell bent on making weapons and killing people. Not the sort of country a civilized person would want to live in, so that ain’t progress in my book.
The US and Britain supplied Stalin’s material needs during the war. After the war ended Russian troops stole everything in Eastern Europe that was not rooted in the ground. After that capital was dissipated, they began their slow slide towards collapse. The only things that Russia has that make it a power are their nuclear weapons and their oil wells. The Ukrainians have shown the rot inside Russian institutions. They will no longer be respected. If the US would arm the Ukrainians properly and quickly,. they would collapse the Russian Army.
Russia’s industry, land area and mineral resources are sufficient for superpower status.
How one of the most corrupt countries on Earth shows that eludes me.
If you are getting your “Ukraine news” from the MSM and propaganda papers, think again. They are still pro for sending money and weapons to Ukraine instead of tending homeland disasters.
America alone sent hundreds of billions in cash and military hardware to Ukraine. Most of that hardware is sitting in war torn areas ready for recycling after the Russians finished off the “Ukraine offenses”.
I am Ukrainian courtesy of my grandfather.
DNA tests identify single digit numerical relatives even at 1 and 2 steps distance. Which may be because Russia, Germany and then Russia again concentrating then eliminating relatives.
Russia is rapidly eliminating many military age Ukrainians right now. Other military age Ukrainians are either avoiding the draft or desertion after joining. Ukrainian refugees are flooding neighboring countries.
In this case, the failure to make green progress is a good thing.
Correct, humanity and history will thank we realists for the great resist
Except that devoting increasing resources to achieve nothing of value makes us all poorer.
A fact that will hamper American wealth for several generations.
Unreliables Renewables only generate electricity, but manufacture nothing for society.
What is the plan to identify the replacement for the oil derivatives that are the basis of more than 6,000 products and all the fuels for the merchant ships, aircraft, militaries, and space programs that support the 8 billion on this planet?
The video has already been viewed by more than 800,000!
https://www.youtube.com/shorts/stf2YrznkZU
BATTERY SYSTEM CAPITAL COSTS, OPERATING COSTS, ENERGY LOSSES, AND AGING
https://www.windtaskforce.org/profiles/blogs/battery-system-capital-costs-losses-and-aging
Excerpt
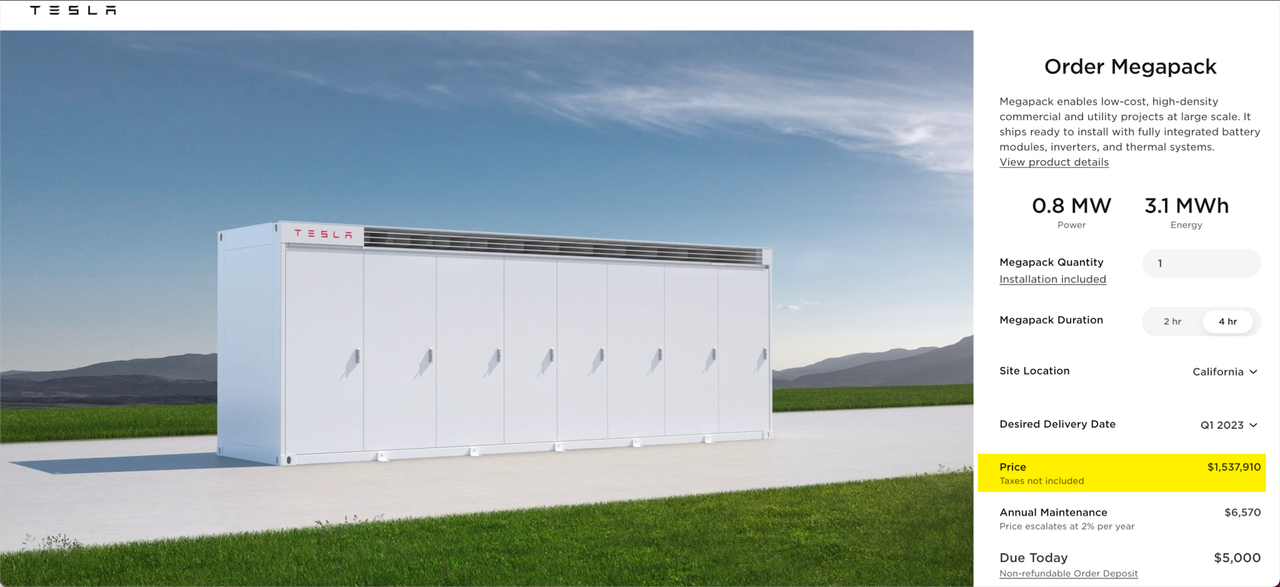
Turnkey Capital Cost of Megapack-based Battery Systems
Tesla is the world’s largest provider of lithium-ion battery systems, that include front-end power electronics, batteries, back-end power electronics, heating and cooling systems for batteries and enclosures
Megapack pricing varies due to market conditions
The 2021 pricing for a 10 Megapack, 4h, with installation, was about $10 million, or $328/kWh
The 2022 pricing for a 10 Megapack, 4h, with installation, was about $16 million, or $412/kWh
The 2023 pricing for a 10 Megapack, 4h, with installation, was about $19.1 million, or $487/kWh
Tesla Megapacks had a 487/328 = 48.5% increase
Connecting the Megapacks into a system incurs losses, which are covered by the “Tesla design factor”
After applying the factor, the above $/kWh is increased! See URLs and below examples.
https://electrek.co/2022/03/21/tesla-hikes-megapack-prices-backlog-extends/
https://www.tesla.com/megapack/design
1) Example of Turnkey Cost of Large-Scale, Megapack-Based, Battery System, based on 2022 pricing
PG&E, a California utility, put in operation, at Moss Landing
The PG&E system consists of 256 Megapacks, rated capacity 182.5 MW/730 MWh, 4-h energy delivery.
Power = 256 Megapacks x 0.770 MW x 0.926, Tesla design factor = 182.5 MW
Energy = 256 Megapacks x 3.070 MWh x 0.929, Tesla design factor = 730 MWh
We assume $1.25 million/Megapack, because of large number of units
Estimated supply by Tesla is 256 Megapacks x $1.25 million = $320 million, or $438/kWh
Estimated supply by others is $62/kWh
All-in, turnkey cost about $500/kWh; 2022 pricing
NOTE: The primary purpose of this battery system is to absorb midday solar output bulges, and deliver about 80% of it to during late afternoon/early evening.
Any costs associated with battery systems are charged to ratepayers, taxpayers and added to government debt, i.e., not charged to Owners of solar and battery systems, the grid disturbers.
https://www.10news.com/news/national/pg-es-tesla-megapack-battery-in-san-francisco-now-operational
2) Example of Turnkey Cost of Large-Scale, Megapack-Based, Battery System, based on 2023 pricing
The system consists of 50 Megapack 2, rated capacity 45.3 MW/181.9 MWh, 4-h energy delivery
Power = 50 Megapacks x 0.979 MW x 0.926, Tesla design factor = 45.3 MW
Energy = 50 Megapacks x 3.916 MWh x 0.929, Tesla design factor = 181.9 MWh
Estimate of supply by Tesla is $90 million, or $495/kWh. See URL
Estimate of supply by Others is $14.5 million, or $80/kWh
All-in, turnkey cost about $575/kWh; 2023 pricing
https://www.tesla.com/megapack/design
 ?itok=lxTa2SlF
https://www.zerohedge.com/commodities/tesla-hikes-megapack-prices-commodity-inflation-soars
NOTE 1: Assume a 4-h battery system rated at 45.3 MW/181.9 MWh, and an all-in turnkey cost of $104.5 million
Amortizing a bank loan for 50% of $104.5 million at 6%/y for 15 years will cost $5.291 million/y
Paying the Owner for his investment of 50% of $104.5 million at 9%/y for 15 years will cost $6.359 million/y (9% because of high inflation)
Lifetime actual cost 15 x (5.291 + 6.359) = $174.75 million
Assume daily charging/discharging at a lifetime throughput of 10%, at a 20% loss, or 15 y x 365 d/y x 181.9 MWh x 0.1, throughput = 99,590,250 kWh to HV grid; 124,487,813 kWh from HV grid; 24,897,563 kWh, loss.
Total to Bank and Owner is $174.75 million / 99,590,250 kWh = 175.5 c/kWh
Throughput loss is 1.5 c/kWh
Total cost is 177 c/kWh
Less subsidies at 50% is 88.5 c/kWh
Announced cost is 88.5 c/kWh
At a highly unlikely 50% throughput, announced cost would be 20.5 c/kWh
At 50% throughput, you are close to Tesla’s recommend of not charging in excess of 80% and not discharging to less than 20%, which, in fact, was not heeded by Hornsdale owners eager to make a buck.
http://www.windtaskforce.org/profiles/blogs/the-hornsdale-power-reserve-largest-battery-system-in-australia
Not included: 1) O&M; 2) roundtrip losses, about 20%; 3) system aging, 4) plus, in year 15, decommissioning, i.e., disassembly, reprocessing and storing at hazardous waste sites.
(to) recommend is a verb. The noun is recommendation.
At least you have ‘decommissioning’ rather than ‘decommission’. “ing” seems to be going out of fashion very quickly. As in ‘build’ rather than ‘building’.
Thank you for proof reading my English
Any comments on the substance of my comments
Do you mean besides the fact that none of this is necessary, and is a God-awful waste of taxpayer money? It’s like looking at the projected costs of a unicorn hunt.
Bingo!
Aging, replacement, recycling are all avoided in MSM and standard newsprint, except for claiming lithium batteries can be recycled/reprocessed.
Why?
The failures of government “planning” are prominent in every day’s news feeds if one but understands what he is reading. The failure of Western governments’ Nut Zero might be evident to the Low Information Voter only when their children or grandchildren are forced in school to learn Mandarin.
On my Android tablet under Chrome I am getting stuck in a loop with the banner popup requesting acknowledgement of GDPR cookies repetitively popping back up, and preventing any attempt to enter a comment. If I log out, the banner goes away. Log back in, and there it is again.
Fortunately it seems my PC with a different browser still works.
Dump Chrome on your tablet.
Try to live without anything google, it’s just farming you
I use PaleMoon on the PC with Mojeek when it works: fallback is DDG.
Amen!!
And I am old enough to remember when Google and Yahoo promised users to never misuse user data.
Then Google, and Yahoo issued a series of “Agreement” modifications which gave Google ownership of data they collect.
Facebook promised the same to early users. Only FB and it’s creator pathologically lies about almost everything.
I use Chrome because I hate the way other browsers currently work. Yes, especially Firefox and Edge.
Every time Google wants me to “Log in”, I refuse. Google steals enough data already to scare me.
DuckDuckGo is claiming they have their own browser now. I use DuckDuckGo as my interface with Google, but I shy off when the new browser wants my page marks, cookies and other data.
Maybe when I get a new PC and disconnect this one from the internet, I’ll install the DDG browser and investigate what it is trying to do with my data… If, I am satisfied, I’ll install the new browser on a clean system.
Same thing on my Android phone with the Opera browser, but OK on my PC with the Brave browser.
Perhaps the code for the popup needs review.
Whether on Fire Fox or Chrome you can block all ads and all pop ups. On FF you may need to one off allow pop-ups on some applications eg Bank inputs. Chrome appears to have less problems with pop-ups. Banks at least in OZ prefer Chrome.
And why would Banks prefer Google Chrome?!
Google is intertwined in several household utilities/products.
Last year, we bought a Sony Bravia TV. The TV has a major interface with Google and Amazon.
I did connect Amazon prime to the TV, but to this day, I refuse to fully connect Amazon or any Google app to my TV.
We also replaced our heat pumps for the third time since we bought this house in the 1990s. The new heat pump thermostats can be connected to various apps which include Google, ostensibly to enable users to control the system remotely.
Our two year old refrigerator has similar ability to connect to internet apps.
Using my cable modem/router I blocked their ports from outside polling/communication.
The old TV was taken out by a nearby lightning strike frying any electronics connected to cable’s copper wire input.
Unlike green depictions, heat pumps fail within ten years necessitating replacement. Fossil fuel heating systems can run for decades with maintenance.
Problem now seems resolved, but I don’t think blocking popups was the secret. All Reply links were greyed out, and the Post Comment box would not appear on typing into the box for a new comment.
EVERYTHING “green” is always propped up by FF, more than just propped up, they owe their existence to FF. Okay, except TRUE green, living in the stone age.
Propaganda pure and simple. The question is how long can they keep it up? Now that the people are being asked to pay for the renewable fantasy they’re starting to question whether or not it’s necessary.
OF COURSE
once again we see skeptics research method
when you find data you like stop looking. even better when talking about the future
look at data from 2022 and before.
classic skeptic research method
5 minutes, same source you cite I find
https://www.eia.gov/outlooks/aeo/narrative/index.php#TheElectricityMixinth
note to trolls
. I used sources OP cited, assuming he endorses sources he cited.
I didnt call him names
I didnt have to read his CV or make personal attacks
Once again we see alarmists research method. Go to information that meets your criteria and stop looking. EIA being a “source” is laughable. I especially like the charts that show “installed capacity” like that means something other than how much money was wasted.
Yes “installed capacity” is rank bullshit.
The tires on my ordinary passenger car are rated for 200 mph.
But the car, the roads, visibility conditions and my driving capabilities will never produce 200 mph.
For wind, the limiting factor is the constant weather variability, and for solar it’s – well, just as it is for that other place the sun don’t shine.
“EIA being a “source” is laughable.”
From Menton’s original post
“The best source of information is the Energy Information Administration (part of the Department of Energy).”
It is the source his post is based on.
It has kow-towed to the alarmist narrative.
Everything “into-the-future” is tainted by AGW anti-CO2 unrealism.
Steven, I’m not certain you understand what Mr. Menton is saying. He shows that, to date, despite lots of money being poured into renewables, the fossil fuel needle hasn’t moved. We’re continuing to use the same percentage of fossil fuels. Your link doesn’t really address that; it goes to what EIA is predicting about the future. For example, it says “[r]enewables are increasingly meeting power demand throughout the projection period (Figure 2).” (Emphasis mine.)
What you link to doesn’t refute Mr. Menton’s point. The EIA may be right, and fossil fuel usage will decline significantly. We’ll see, although the facts (and history) suggest otherwise. Until then, the EIA’s guess doesn’t trump Mr. Menton’s facts.
Here is the EIA plot that Steven linked to
It has future projections, but also data from 2010 to 2023. Menton just has 2021 to 2022.
LOL, graph says to 2022, , It is not possible to have final figures for 2023
EIA has been taken over by leftist bureaucrats, nothing beyond 2022 is real, just agenda-driven crystal-ball gazing.
Looks like even Nick can’t save Steve from himself.
US/UK 56,000 MW OF OFFSHORE WIND BY 2030; AN EXPENSIVE FANTASY
https://www.windtaskforce.org/profiles/blogs/biden-30-000-mw-of-offshore-wind-systems-by-2030-a-total-fantasy
EXCERPT
The US government, not the US people, has the insane fantasy of wanting to build 30,000 MW of offshore by 2030, i.e., just 7 years, but several companies, building projects for Massachusetts, will be allowed to walk away from the signed PPAs, and rebid at much higher prices next year.
The UK government, not the UK people, has the insane fantasy of wanting to build 26,000 MW of offshore by 2030, i.e., in just 7 years, but Vattenfall, a Swedish company, is putting 4,200 MW on hold, because Vattenfall spreadsheets show a “net revenue shortage” of about 40%, meaning the prices, c/kWh, offered by the UK auctions are about 40% too low.
BTW, about 7,000 MW offshore was accepted after the 4th Auction bids in 2022; at least 4,200 MW are on hold.
The continent-based European big wind companies have only one third of the capacity per year for building 56,000 MW offshore by 2030, or 8,000 MW/y.
These companies will concentrate on the U.S. market, because the Biden “Inflation-Reduction-Act” subsidies are about 50% higher than in the UK
NOTE: “The expense associated with a typical US offshore project, before bonus tax credits related to the Inflation Reduction Act, has increased by 57% since 2021,” Bloomberg recently reported, citing figures from Bloomberg-NEF, “Inflation of materials, energy, components, and labor costs explain about 40% of that, with 60% due to increased interest rates.”
NOTE: The EU, the UK and the Fed central banks just increased interest rates, which will make everything more expensive.
NOTE: Assume an offshore project consists of wind turbines and cabling to shore at $4,000/kW.
Amortizing a bank loan for 50% of the project at 6%/y for 20 years will cost about 4.36 c/kWh.
Paying the Owner for his investment of 50% of the project at 9%/y for 20 years will cost about 4.74 c/kWh (9% because of high inflation).
Offshore O&M, about 30 miles out to sea, is at least 6.5 c/kWh.
Total energy cost 4.36 + 4.74 + 6.5 = 16.33 c/kWh
After subsidies, and accelerated depreciation, and deduction of interest on borrowed money, etc., the ANNOUNCED wholesale energy cost is at least 8.17 c/kWh (what a bargain!)
Not included are the following:
The levelized cost of any onshore grid expansion/augmentation, about 2 c/kWh
The levelized cost of a fleet of quick-reacting power plants to counteract/balance the ups and downs of wind output, 24/7/365, about 2 c/kWh
The levelized cost of decommissioning, i.e., disassembly at sea, reprocessing and storing at hazardous waste sites
Floating offshore, as in Maine and California offshore, would be about $6,000 to $7,000 per MW, i.e., the bank loan and Owner return parts of the levelized cost would be correspondingly higher.
The levelized O&M likely would be higher as well
The various subsidies, added to national debts, to make it all politically sellable, would be higher as well
LCOE =
LevelizedLeftistized Cost Of EnergyIn using LCOE you are not accounting for rising levels of curtailment as capacity increases. If the UK were to achieve its 56GW target, then I estimate close to 50% of the output of the marginal windfarm would be curtailed, doubling the effective cost of the useful output. Adding electrolysis and hydrogen storage would be horrendously expensive. It would also be very intermittent, resulting in low utilisation and higher costs.
The 2 c/kWh added to the cost of wind is the 2020 cost of counteracting/balancing wind/solar at 28.6% of electricity fed to the UK grid, excluding net imports
That cost/kWh would exponentially increase to 6 – 8 c/kWh at 50% wind/solar, because of increased compensation for curtailments and for increased counteracting/balancing
The more wind, the less effective the CO2 reduction.
In Ireland, at 17% wind, effectiveness was 0.526, not 1.000, as is commonly used for calculations
Wind is an expensive, all-around hoax
CO2 Reduction, due to Wind, less than Claimed
Ireland: In Ireland, with 17% wind loaded onto the Irish grid in 2012, the officially claimed CO2 reduction of grid CO2/kWh was 17%
However, analysis of 15-minute grid operating data, and corresponding fuel consumption data of each power plant connected to the grid, showed, it was only 0.526 x 17% = 8.94%, due to inefficient operation of the other power plants, when counteracting/balancing the variable output of wind, as above described.
The only reason the Irish government finally had to admit to the lesser CO2 reduction, is because public pressure forced the government to hold hearings on why Irish gas imports had not decreased with increased wind; “the smoking gun that did them in”
After 2012, Brussels gave money to Ireland to put in major capacity connections to the much larger UK and French grids. The Irish wind output variations were only a very small percent of the electricity loaded onto those grids, i.e., “buried in the data noise of the grids”
The UK: The UK, with 28.4% wind/solar in 2020, has a CO2-reduction factor significantly less than 0.526, because even more counteracting/balancing is required.
Ireland, the UK, US, Germany, Spain, etc., have been over claiming CO2 reduction from wind/solar for decades, with connivance from Brussels. See explanation in URL
https://www.windtaskforce.org/profiles/blogs/fuel-and-co2-reductions-due-to-wind-energy-less-than-claimed
All 5 of Europe’s wind turbine manufacturers have been making large losses for well over 2 years now. and connection of new capacity to the grid is a major problem across the EU and the UK.
Wind Europe has noted in press releases that offshore installations are being delayed because “offshore foundation manufacturers and installation vessels are fully booked for several years”
Even so a recent press release ( ‘European Parliament vote sends strong positive signal for renewables investment’ 19 July 23) lamented the fact that “Europe invested only 17 bn euros in new wind farms in 2022, the worst annual investment figures since 2009…….And orders for wind turbines were down 47% year on year”
https://wind-europe.org/newsroom
That graph only deals with electricity generation, and leaves out the huge contribution from petroleum to total energy sources. So it doesn’t respond to Menton at all. Furthermore, while it has past data, it’s at a scale and resolution that makes it clear it is provided to show future estimated trends. It doesn’t contradict Menton’s point that current data make those estimates unlikely.
You often raise good points on this site, Nick. It would make you more credible if you simply acknowledged that Mosher was wrong on this one. Menton’s data suggests that a significant reduction in fossil fuels unlikely, given the continued strong presence of fossil fuels despite huge investments in wind and solar over the past decade. He may or may not be right, but he at least is showing his work, and it’s based on hard data. The EIA, not so much. .
Even the IEA admits that fossil fuels will still be providing over 60% of world energy in 2050
” From 80% today- a level constant for decades- fossil fuels fall to 75% by 2030 and just over 60% by 2050″
IEA ‘World Energy Outlook 2022’
I have science / engineering fact checked your post and found it wanting and highly biased – please take time to research your post content if you wish to be taken seriously – and please take your own advice and drop the trolling personal attacks, we are realists, not sceptics – have a good day if possible
Once again we see a supposed Eng-lit graduate totally incapable of typing a coherent rational sentence.
And just for Moosh’s education, there is NO DATA after 2022 in your link.
Model output is not data.
Wishful thinking is not data.
and FFS, grow up and stop whining like a 2 year old. !
What kind of weird brain malfunction makes someone believe that “government subsidies” help make “renewables” “increasingly cost effective compared with the alternatives”? Of course regulations, special taxes, and suppression make the “alternatives” artificially more expensive, and denial that out of sight, out of mind unrestricted fossil fuel use is the main factor that can produce “declining capital costs”, but only when adjusted for the declining value of Western currencies.
As usual, the only person impressed by Steve’s logic, is his mother.
Many data sets produce data on a yearly basis. Since it’s 2023, it’s hardly surprising that many data sets only run through 2022. Beyond that, most studies take time, and they usually start with the latest data at the time the study is started. Reloading your data every month means you have to restart your study every month. If Steve was a scientist, he would know this.
Another constant with Steve, he thinks of those who disagree with him as a monolithic block of people.
He actually believes that skeptics all sing from the same hymnbook that is published by a master controlling entity, the way he and the other alarmists do.
“only person impressed by Steve’s logic, is his mother.”
I didn’t know Nick was Mosh’s mother ! 🙂
“Decarbonization”
… is a cost, not a benefit.
“Bloomberg News“
… focuses on people experiencing costs of various sorts.
AGW is still an axiom of these folks. That is not real progress.
Agree, we are in CO2 deficit and need at least another 400ppm in the atmosphere – Carbon is the element of life itself, even alarmist life
Well, for me personally and as one living in California, the Green Energy Future has certainly arrived faster than I ever thought possible. And with quite the impact, I must say.
California Senate Bill (SB) 100 requires that all retail electricity sold must come from renewable resources and zero-carbon resources by 2045. SB100 also updates California’s Renewables Portfolio Standard, requiring renewables to provide at least 60 percent of the state’s electricity by 2030. California governor “Moonbeam” Jerry Brown signed SB100 into law in 2018.
Since that bill passed into law (about five years ago now), my annual electric utility bills have more than doubled for the same amount of kWh used.
How is the push for renewables achieving 60% coming along? Only 6 1/2 years to go.
There’s lots of popcorn waiting to be eaten as California shows the world it’s virtue signalling climate alarmism measures, fail miserably
all retail electricity sold
Does that include electricity “imported” from out of state? Wouldn’t surprise me if there’s some exception for that.
I believe there is a “carbon tax”, paid by the out of state supplier, for such electricity that is not produced in accordance with CA regulations. This is a significant factor in the user’s electricity cost since it raises the price the out of state supplier charges.
Is the New York Times good for anything other than bird cages? If it were to completely disappear tomorrow the US in particular and the world in general would be better off. I’m not sure I would even use it to start my charcoal barbecue.
But I would miss their daily Wordle puzzle, even though that British-invention would be better with fewer transatlantic spelling-versions! At least I am not compelled to read their “news”!
Since they would be gone we could publish Wordle puzzle ourselves.
Nut zero is just a perverse money grab, from the masses to the elite globalists
Battery cars, heat pumps, smart meters, wind & solar power, synthetic meats or bugs – all engineeringly / socially incompetent grabs based on dodgy dossier climate alarmism hysterics, thought up by grubby self serving grant chasers and charlatans
I will stick with my diesel car, gas boiler, analog utility meters, fossil fuel & nuclear energy and fine sirloin steaks and live happy, long & healthy
They always include hydro yet oppose building dams.
Why?
My guess is to pad the “green” energy numbers.
As usual, whenever some random people (*) insist we need to get past fossil fuels, I simply ask: what have YOU done to make existing nuclear fission technology accepted in your community?
What have you done to make people less fearful of small doses of radiation?
(*) not if it’s Rod Adams of course (Atomic Insights)
Top chart,
Notice how they use “percentage of renewables” on the left, rather than percentage of whole.
Wind is actually only 3.2% of the whole, solar only 1.44% of the whole.
The difference between the Left and Right, is that te Left implements policies they can get rich out of, because they ought to be implemented, whilst the Right implements policies they can get rich out of because they work.
“they ought to be implemented,”
You got that wrong…
You should have said…
“they ought NOT to be implemented,”
It’s all to do with “feeling” and “virtue-seeking”..
No rational thinking used or required.
This assumes (maybe even with touching faith) that central planning is intended to improve economic efficiency rather than acquire power at its expense.
Testing tablet
“propagandists and cheerleaders”, from two very corrupt and biased sources.
Whatever for?!
Why would anyone want an analysis based upon lies that liars provide in abundance? Often their lies are everchanging to include current weather or politics.
Moderator note, i.e. plea for help!
When I “edit” a recently posted comment I am getting a “you are trying to post too frequently” warning?
That phrase is from memory, so I am paraphrasing as well as I can.
The edits do not “save”. i.e., the edited post ain’t getting there.
Screen refreshes show that the comment is unaltered after trying to “save” an edit.