Originally posted at Climate Realism
The headline of August 14th article in THE WEEK, distributed by MSN News, was “How Antarctica has become the enduring climate change bellwether.” The claim is false, being based not on peer reviewed science or real-world data, but rather it reflects nothing more than the opinion of the author. Actual data refutes the claimed connections between climate change and what is occurring in Antarctica this year.
First, let’s look at some of the false claims in the article.
Antarctica’s climate change issues were recently highlighted by a new study from the journal Frontiers in Environmental Science. The study, co-authored by experts from the University of Exeter, the British Antarctic Survey, the University of Johannesburg and others, concluded that it’s “virtually certain that future Antarctic extreme events will be more pronounced than those observed to date” unless steps are taken to abate climate change.
…
One of the biggest issues in Antarctica is undoubtedly the rapid melting of its ice. It was recently reported that sheets of Antarctic ice are melting three times as fast as they did 30 years ago. Sea ice levels hit a record-low in 2017, and “the four lowest annual minimum sea ice extents of the satellite era have occurred since, with both 2022 and 2023 setting new records,” the study said.
The “…new study from the journal Frontiers in Environmental Science.” cited by Justin Klawans of THE WEEK isn’t scientific research, it’s an opinion piece, nothing more than a compendium of other research, combined with opinions about the other research. Opinion is not science. The title itself, “Antarctic extreme events,” is a dead giveaway, but the “Publisher’s note”, which distances itself from the study says all you really need to know about it:
All claims expressed in this article are solely those of the authors and do not necessarily represent those of their affiliated organizations, or those of the publisher, the editors and the reviewers. Any product that may be evaluated in this article, or claim that may be made by its manufacturer, is not guaranteed or endorsed by the publisher.
This is the kind of disclaimer for opinion pieces or sales pitches, not scientific research.
Second, it should be noted that the reporter Justin Klawans referenced yet another THE WEEK article, known as a “Speed Read” for his claims, rather than doing original research himself.
And the article he referenced, seen in a screencap below, was chock full of inaccuracies itself.

The biggest inaccuracy is that the piece cites an Earth Science System Data report and CNN, saying (bold mine): “The worst melt was in 2019, when the ice sheets lost a combined 675 billion tons, CNN writes.”
The inaccuracy here is the lack of reporting the true perspective of 675 billion tons of melt. Here are the numbers.
According to the National Snow and Ice Data Center (NSIDC): “The Antarctic Ice Sheet measures nearly 4.9 kilometers (3 miles) at its thickest point and contains about 30 million cubic kilometers (7.2 million cubic miles) of ice.”
Using reference values, a cubic kilometer of ice weighs approximately 0.92 metric gigatons, meaning that the Antarctic ice sheet weighs about 24,380,000 gigatons, or 24380000000000000 tons. Doing some simple math, let’s look at how much 675 billion tons of melt actually is compared to all of the massive ice in Antarctica:
- 675000000000 tons ÷ 24380000000000000 tons = 0.00002768662
- X100 for percentage = 0.002768662% of the total mass of Antarctic ice.
In simpler terms, the ice sheet melt in 2019 was about 0.003% of the total ice in Greenland and Antarctica. Scary, isn’t it? That number is well withing standard deviation, and essentially zero in the grand scheme of things.
In THE WEEK article it was claimed: “It was recently reported that sheets of Antarctic ice are melting three times as fast as they did 30 years ago.”
The numbers: 0.00002768662 x 3 = 0.00002768662 for the percentage, times 100 = 0.008305986%
So, three times nearly nothing is still nearly nothing at 0.008%
Of course, the media never bothers to mention the real comparison or the percentage, because that would destroy the narrative. Nor do they mention that during the next winter, much of that melted ice comes back when water refreezes or snow deposits onto the ice sheet during winter storms.
At Climate at a Glance, both Greenland and Antarctica melt has been covered in these two graphs:


So, if you are worried about the loss of ice in Greenland or Antarctica as meltwater contributing to sea level rise as the media would have you believe, don’t be. Further, events that occur in single years, or even in multiple years are indicative of climate, which require a 30-year period of data to be valid as a trend.
Finally, there’s this from THE WEEK:
There’s conclusive evidence that the temperature in Antarctica is rising, according to the study. The most extreme heat wave ever seen globally, the study stated, “occurred over East Antarctica in March 2022 when surface temperature anomalies of up to [101.3 degrees Fahrenheit] were observed.” The highest-ever temperature on the Antarctic mainland was recorded in February 2020, when a reading of 64.9 degrees Fahrenheit was observed.
Note what they added: [101.3 degrees Fahrenheit]. It is important to understand that isn’t an actual air temperature that day, it’s a departure from normal, and normal is still very far BELOW the freezing point of 32°F when you subtract 64.9-101.3 = -36.4°F.
Is it surprising that on the very northernmost tip of Antarctica, well removed from the main ice mass, there might be a weather event that would create that warmer temperature? Buried in the article is the reason: “The wave of warm area seems to be tied to a “foehn,” or a rush of air that comes down from a slope or mountain and compresses air to warm it, the WMO’s climate extremes expert told The Associated Press.”
Again, weather, not climate, and that temperature was certainly not a threat to melting the huge volume of the Antarctic ice sheet, hundreds to a thousand plus miles away, as seen in Figure 2 below:

But the media won’t tell you that. They also won’t tell you that the melting they report and the threats from sea-level rise they insinuate are minuscule. Nor do they tell you that sea ice levels are driven by wind and ocean currents, which shift from year to year, and that sea ice does not displace water, and thus contributes nothing to sea level rise. Nor will they tell you that their measurements start from a peak in sea ice measurements just a couple of years after the continent’s ice sheet has set repeated records of sea ice extent, also during the recent period of modest warming. Indeed, NOAA reports that the overall trend for sea ice is close to zero in recent decades. Nor do they tell you that while West Antarctica and the Antarctic Penisula are losing ice, due in large part to subsurface volcanic activity, the vast bulk of the continent is gaining ice mass.
The sensationalizing of climate science, as the left-wing media has so successfully done, undermines real science, and the real facts.
The sadder truth is, the mainstream media are complicit in the ongoing, widespread distortion of science encouraged by the politically powerful. This does serious disservice to the American people, whom they are supposed to be protecting as “the fourth estate,” viewing big government initiatives with a jaundiced eye and skepticism in order to provide a check on wealthy, politically connected, elites. Big government cheerleading has replaced investigative journalism.

Anthony Watts is a senior fellow for environment and climate at The Heartland Institute. Watts has been in the weather business both in front of, and behind the camera as an on-air television meteorologist since 1978, and currently does daily radio forecasts. He has created weather graphics presentation systems for television, specialized weather instrumentation, as well as co-authored peer-reviewed papers on climate issues. He operates the most viewed website in the world on climate, the award-winning website wattsupwiththat.com.
Note: about 9 hours after publication, I corrected a math error in calculating the normal minus anomaly temperature. The number was correct, but the sign was wrong. The correction was in to the original post, but somehow didn’t get saved.
The logic behind the arthimetic here is weird:
Note what they added: [101.3 degrees Fahrenheit]. It is important to understand that isn’t an actual air temperature that day, it’s a departure from normal, and normal is still very near the freezing point of 32°F when you subtract 101.3 – 64.9 = 36.4°F.
Now the anomaly was in March 2022 (the 101.3 degrees) while the maximum temperature was recorded in Feb. 2020, i,e more than 2 years before the record anomaly. So it doesn’t seem to make any sense to subtract the record temperature from the record anomaly. Morever subtracting a temperature from an anomaly does not tell you what “normal” is. If the temperature is 40 degrees and that is 10 degrees above the average then the normal is found by subtracting 10 from 40 to give 30 degrees, not the other way around which would give -30 degrees.
No! If the recorded temp is 64.9 with an anomaly of 101.3, that means “normal” temp is 64.9 – 101.3 = -36.4°F (-38 deg C)
The coldest month at Esparaza base is July with a mean of -11 deg C. (+12F) so clearly they were NOT taking the correct average to calculate their insane anomaly.
According to WonkyPedia, “The mean annual temperature of the interior is −43.5 °C”
So it looks like the lame journalist who came up with the 101 F anomaly was using the average of the entire continent to calculate an anomaly for the hottest station at the tip of the peninsula.
That is not how anomalies are defined, they know nothing, and just made up some junk home made results to insert inside what was supposed to be quoted text.
101.3 degrees F is 38.5 degrees C
More likely than not, somebody made the usual rookie mistake of using Google to convert 38.5 degrees C to F rather than multiplying the 38.5 by 1.8 to give 69.3 (round to either 69 or 69.5)
The thermometer is probably in the smoking area.
At least close to a wall and in the lee of a building so employees can get a brief respite while maintaining the instruments.
Here’s the original report. No mention of 101 degrees F. Just a shoddy piece of journalism. This happened in March 2022
A few days ago, an unprecedented temperature record was noted in the Antarctic. The French-Italian research station Concordia, located over 3,000 meters above sea level on the Antarctic Plateau, the coldest place on earth, recorded a temperature of 40ºC above average. At this time of year temperatures of around -55ºC are usual, but on March 18 the mercury hit -12ºC.
Defund Exerter University and British Antarctic Survey now.
Let them demonstrate that real science and the correct scientific method will be used by them in future before they receive another penny of taxpayer’s money in future. Why should we pay for incompetent agit-prop?
Why defund the BAS? As the article stated, it was an opinion piece by 1 member of staff. Or are we going to ban people’s opinions in the way the alarmists often do?
Defund the Clown Klawans
Would you think a different member of BAS who said an honest opinion piece about Antarctica would last 1 day in his job
Opinions that veer a long distance from the facts are rubbish and it’s no loss that it should go into the bin
Quite correct Duker. The BAS has had their “Scientists” banging the GangGreen drum for at least 20 years now. So far as I am concerned, they can either control those who promote “post-modern” evidence free agit-prop or kick them out for continually bringing into disrepute what once was one of the UK’s leading and most highly regarded Scientific Organisations.
They can all jump aboard the Royal Research Ship Sir David Attenborough and sail off into the sunset.
You went backwards with the melting math.
If 2019 saw 0.003% loss, and was 3 times faster than decades ago that means it’s 0.003% now and was 0.001% 30 years ago
Nothing
All the 2020 warm anomalies are from one little area at the tip of the East Antarctic peninsula.
That is around 62-63 degrees south, similar to Iceland, Finland, Sweden, much of northern Russia and Canada
Deception Island with its volcanic hot springs is in that area too.
Anyone thinking this little WEATHER anomaly is going to affect the mainland of Antarctica is not very intelligent !
Be nice now!
That is far too accurate a description of climate alarmists; their brittle, little psyches will be damaged! Safe spaces will be required!
I think the South Pole would be a nice little safe space for them. Permanently.
“when surface temperature anomalies of up to [101.3 degrees Fahrenheit] were observed.””
The anomaly given is also total balderdash.
The maximum temperature recorded on mainland Antarctica was 18.3C (64.9F) At Esperanza Base (latitude 63S) on Feb 6 2020. February temperatures in Esperanza Base are often above freezing with normal February highs being between 3C and -1C (38F and 29F).
Doesn’t sound very unusual for those winter highs. We have the same average winter highs, and we’ve experienced winter temperatures that high in the past even before I was born. What the Eastern U.S was dealing with this winter, we were dealing with exactly 20 years ago.
https://www.deseret.com/2003/2/1/19701988/warmest-january-day-is-whopper-63-degrees
A single weather event does not equal “climate change
… especially as the Antarctic Peninsula was cooling… at least up to 2016
Antarctic peninsula temperatures have fallen, study shows | Polar regions | The Guardian
Hilarious watching them keep saying “cooling doesn’t mean it is not warming” 🙂
And of course, only 2 years ago…
Antarctica’s last six months were the coldest on record (9news.com.au)
I still find even the most basic of their terms misleading and alarmist. Saying rubbish like: “Antarctic ice sheets are melting.” Gives the impression that temperatures are so high that ice sheets within the Antarctic are melting when this is simply not the case. The ice sheets calve icebergs and thinner sea ice breaks up within the Antarctic due to wind and wave action mostly, these are then driven away from Antarctica as floes or icebergs and melt when they get into warmer waters some distance away. I may be nitpicking but to imply that ice is melting within the Antarctic waters is highly questionable (not to say verging on the impossible), definitely dodgy science, as well as diverting attention away from weather patterns and storms which are the real drivers of ice extent, not this fatuous fascination with ‘anomalies’ and unmeasureable micro-fluctuations in temperature.
Right. Apologies, rant over (for now).
“”ongoing, widespread distortion of science…””
Khan’s office moved to ‘silence’ scientists
…
disappointed that Imperial College had published a study by the Department of Civil and Environmental Engineering that showed Ulez cut nitrogen dioxide by less than three per cent and had achieved an insignificant impact on ozone and particulate matter.
Such research undermined the London Mayor’s policy, argued Ms Rodrigues.
Prof Kelly is said to have agreed to co-write a statement with her that contradicted the research and positioned Ulez as having helped to ‘dramatically reduce air pollution’.
https://www.dailymail.co.uk/news/article-12425109/Sadiq-Khans-office-silence-scientists-Mayor-Londons-ambitious-Ulez-plans-little-impact-pollution.html
It’s the modus operandi
“Prof Kelly is said to have agreed to co-write a statement with her that contradicted the research and positioned Ulez as having helped to ‘dramatically reduce air pollution’.”
So, Prof Kelly agreed to lie about the situation.
Looks that way. You’re only a scientist if you support the political narrative, pawns in a political game of chess. Well a good few of ’em made this situation the way it is so good luck to ’em.
If someone is worried about the ice in Antarctica, there is no reason.

Of course the Antarctic sea ice is the ‘bellwether’.
The previous bellwether (the Arctic sea ice) stopped cooperating with alarmists circa 2012. The other ‘bellwether’ (polar bear populations) stopped declining in the late ’70s when hunting bans started being enforced.
Oh what is an alarmist to do? There has to be a weather record somewhere on earth… I know! Pick a place where we only have data going back 44 years! There is sure to be alarming narratives there about never-before-seen events in all of history!
Mongolian Plateau? If someone’s running a book on the next popular ‘bellwether’, that’s where my fiver is going.
For years it Arctic sea ice which was “the canary in the coal mine”, with the OMG minimum in 2012 making world headlines. Then after 2013 , when sea ice minimum was 65% GREATER than the previous year it all went rather quiet.
2021 and 2022 Arctic minima were both about 13% GREATER than in 2007 when IPCC and Al Gore started all the hysterical wailing about imminent “ice free summers”. That’s a decade and a half with no net change. So much for the famous albedo feedback and “ever accelerating melting”.
Now they are going to : ” no, no, look over here!”
For once there is a dip in Antarctic ice cover so they forget the canary which is feeling rather chipy and change the metaphor so we don’t spot flip or remember to look at the Arctic.
Look at the official NSIDC data and click on 2007,2021 and 2022 :
https://nsidc.org/arcticseaicenews/charctic-interactive-sea-ice-graph/
from the article:
Me thinks a “not” is missing from that sentence.
It is a tough admission for NASA but at least they do admit that Greenland has gained in elevation. In fact, measured at 170mm over the decade ending 2018:
https://earth.gsfc.nasa.gov/cryo/data/greenland-ice-sheet-summit-elevation-change
They open with:
But then get to the horrible admission:
How many climate models predicted that Greenland would now be gaining in elevation?
“Further, events that occur in single years, or even in multiple years are indicative of climate, which require a 30-year period of data to be valid as a trend.”
Should that be “aren’t”?
Interestingly, that area of recent warmth appears to be where the shelf ice is widest and most continuous: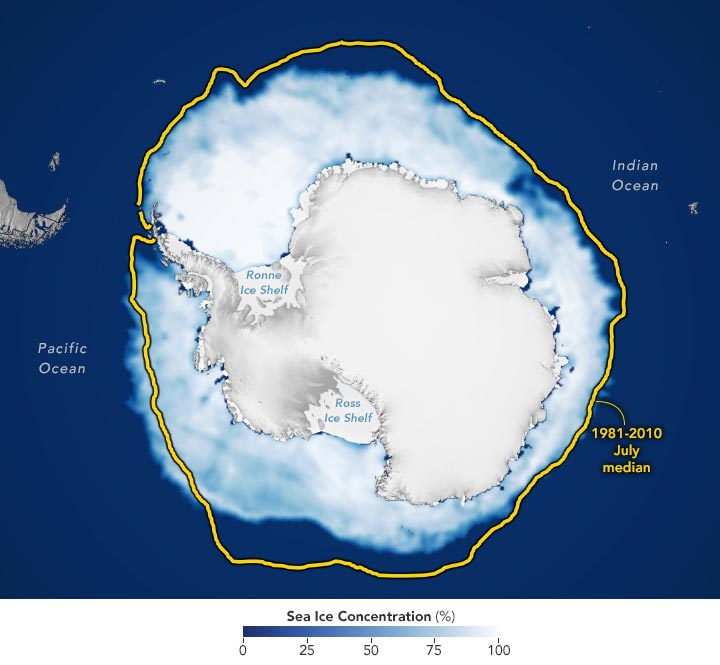
It is too easy to get lost in the numbers about the percentage of overall ice lost. The best way is to compare it to something people can relate to, like sheets of paper. For example, if the Earth were stacked sheets of printer paper, it would be 7917 sheets high. The tallest mountain peak on Earth would be Mount Everest at 5 sheets tall. The lowest point would be the Mariana Trench at 7 miles deep. This way is easier to visualize.
For Antarctica, it holds 27,602 Trillion metric tons of Ice. It is estimated that between 1992 and 2017 there was a loss of 3 Trillion metric tons, mostly in the West, and a gain of 5 trillion metric tons, mostly in the East. That means Antarctica is 27,602 sheets of paper, it lost three sheets in the West as of 2017, and gained 5 sheets in the East, for a net gain of 2 sheets of paper.
These ice loss numbers are from a WUWT article from 2017 and the gain numbers are from a NASA article from 2016. I am too lazy to calculate this current claim, I just wanted to point out that it is easier to visualize this way compared to simply saying .003%.
A hypochondriac hears of a symptom and convinces themselves they have the disease.
A climochondriac hears of a symptom and tries to convince the world that they caused it.
This is very important and needs wide distribution, nice job Anthony.
I agree Bob. This should be emailed to every journalist, reporter, etc., in every media business and whose email address is known.
Does the 675 billion tons take into account the annual snow fall that replenishes the ice sheets each year?