Guest Post By Willis Eschenbach
A company named Lazard puts out an annual report on something called the “Levelized Cost Of Energy” (LCOE). Here’s the April 2023 version. The LCOE estimates the total capital, operations, and maintenance costs for new electric power plants coming into service. People use the Lazard LCOE all the time to claim that renewable electricity sources are now cheaper than fossil fuel electricity. However, the Lazard data has a problem—it doesn’t include the cost of backup and other costs for renewable energy. These costs fall into four groups: backup costs, balancing costs, grid connection costs, and grid reinforcement/extension costs.
A few days ago, I posted the following tweet:
I am SOOO tired of people using the Lazard’s Levelized Cost of Energy to directly compare say solar vs gas or wind vs coal.
The Lazard folks themselves say (emphasis mine)
“Direct comparisons to “competing” renewable energy generation technologies must take into account issues such as dispatch characteristics (e.g., baseload and/or dispatchable intermediate capacity vs. those of peaking or intermittent technologies).”
It’s not optional, so unless you’re taking those issues into account, you are LYING ABOUT RENEWABLES.
w.
Fortunately for me, a user yclept @Roadshow11235 gave me a link to something I’d never seen, an analysis of those very costs. So let me lay them out for you.
I’ll start with the original Lazard data.

Figure 1. Original April 2023 Lazard Levelized Cost Of Energy (LCOE)
Looking at those Lazard LCOE numbers, you can see why people claim that renewables are cheaper than fossil or nuclear. It looks like solar and onshore wind are the clear winners.
However, and it’s a very big however, this does not include the other costs listed above which mostly affect renewables. Let me define each of them:
- BACKUP: All power sources require backup power for the times when they are not generating any or enough power. However, the amount of backup required is much larger for intermittent sources.
- GRID BALANCING: Extra equipment is required when you have intermittent sources, to keep their highly variable input to the grid from destabilizing it.
- GRID CONNECTION: Renewable wind and solar power is variable voltage direct current. Before it can be fed into the grid, it must be run through costly synchronous inverters to convert it to stable voltage, stable frequency alternating current.
- GRID REINFORCEMENT/EXTENSION: Unlike fossil or nuclear plants, which can generally be sited as required, renewable sources of energy are often located far from where the power is needed. As a result, the grid will generally need to be extended, strengthened, or both for such sources.
How large are these costs? Well, the source linked above gives values for five nations—Finland, France, South Korea, the US, and the UK. The amounts vary for each country. For this analysis I’ve used, not the average of these, but the average plus one standard deviation of the data.
Why not use just the average? Good question.
• These figures are all from developed, industrialized countries with extensive grids already in place. When applied to the whole world, the grid-related costs will be higher.
• The less developed a country is, the more it costs to do business there, because many of the ancillary businesses, supplies, and transportation systems we take for granted in developed nations simply don’t exist.
• The greed factor will come into play. Existing renewables often have cozy agreements to sell their power at prices well above the market, and they are exploiting every loophole to do so.
• Unplanned events. Hailstorms destroy solar panels but don’t bother fossil plants. Ocean waves break and damage power cables coming to land from offshore wind turbines. See my post “Blocking The Wind” for examples.
• Finally, there’s what I modestly call “Willis’s Recursive Rule Of Construction”, which states that “Everything takes longer and costs more, even when you take Willis’s Recursive Rule into account.
With those caveats, here are the extra renewable costs for each of the power sources.

Figure 2. Total of the extra costs for each energy source. Note that for each source, the costs increase in line with the percentage of the total electricity supplied by that source (“penetration”).
You can see why Lazard says their levelized costs for renewables are not directly comparable to dispatchable or baseload fuels like nuclear, coal, and gas.
(It’s worth noting here that in many US states, the amount paid to power producers for electricity is on the order of $0.05 to $0.07 per kilowatt-hour. So with regards to solar farms, even if land, panels, mounting structures, and all the rest of the solar setup were totally free, it would still cost more than current power prices … but I digress …)
So, what does the original Lazard data look like when we add in the extra costs for each of the various power sources? Here you go …

Figure 3. Original April 2023 Lazard Levelized Cost Of Energy (LCOE, yellow lines) and LCOE plus ancillary backup, balancing, grid connection, and grid reinforcement/extension costs (colored lines). Note that nuclear is high in part because of the insane regulatory bureaucratic hoops you need to jump through to build one. This can be fixed.
Solar and wind not looking so good once you include all the costs …
Figure 3 above makes it quite clear why there are 1,008 new coal-fired power plants either announced, in planning, permitted, or under construction around the world.

Figure 4. Locations of 1,008 new coal power plants either announced, in planning, or under construction. I note in passing that Australian politicians think closing their 6 existing coal plants will save the planet. SOURCE
The reason those countries are building coal plants is that, unlike climate alarmist politicians in the West, people in most sane countries are looking at the total costs of different sources, not just the Lazard LCOE numbers.
Further affiant sayeth naught.
[UPDATE] For those who think this is only theoretical, ignorance of these facts cost the UK £10 million one day recently …

UK ‘power dumping’ raises concerns over energy management – Energy Live News
Here on our green forested hillside near the ocean, after days of cold sea fog, we have sun today. Still no climate emergency, and I’m glad for the local warming. So I’m going outside to finish burying the Cat5e Ethernet cable to get internet over to the guest house … the work’s not fun, but the day is glorious.
With wishes that all of your days may be equally wonderful,
w.
As Always: I ask that when you comment, please quote the exact words you are discussing. This avoids endless misunderstandings.
Discover more from Watts Up With That?
Subscribe to get the latest posts sent to your email.
Willis writes
These kinds of issues take generations to turn around. So maybe in 20-40 years it might be fixable.
Willis,
Thank you for this article.
It is rather important because it shows the impossibility of continuing with “renewables” at large scale without the consumer paying a very high price.
…
There is another way to show the impact of renewables spoiling a fine system.
Simply, compare costs before and after renewables penetrated much into a regional system.
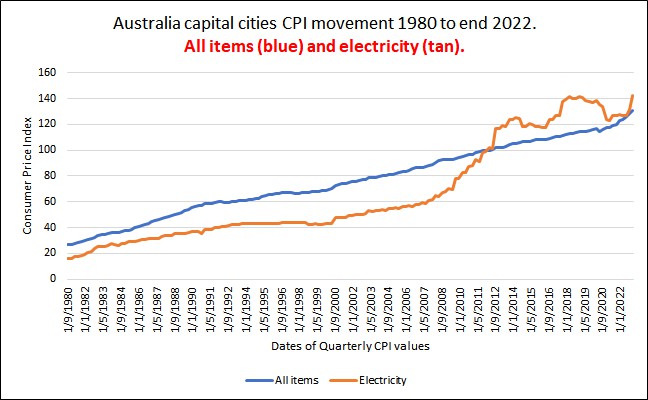
Here is an example from Australia’s eastern grid named NEM.
It is but one way of many to show price movements before and after renewables.
The numbers are from the trusted Australian Bureau of Statistics.
They compare year-by-year prices to the household of electricity and then a common basket of household goods, calculated over our capital cities. Other choices of factors show the same pattern. This is NOT cherry picked. It is simply Consumer Price Index data, unadjusted.
See the rise in electricity prices from about year 2008. This marks the start of significant renewables penetration.
The wriggles in recent years are probably related to Covid and to the size of rebates to households to keep the delusion of lower prices showing.
Geoff S
…
Willis,
Thank you for this analysis.
This is the type of information thatr some seek to hide or cancel, because it shoots down the future of “renewables” except in a few niche applications.
…………………..
There is another comparison that further shows the impossibility of renewables.
Sim ply compare the cost of electricity in a country or region before and after the start of large scale renewables.
There are many ways to illustrate this.
Here is one way, using data directly from the trusted Australian Bureau of Statistics.
This is just one comparison, showing how househole expenditure over the years on electricity has moved in relation to a customary cost of a basket of goods.
It is straight Consumer Price Index data, unadjusted by me and certaintly NOT cherry picked.
You can see that electricity became a bigger part of household costs from about 2008, when renewable capacity was into its expansion here.
The wriggles in the last few years are likely to be Covid-related, plus a product of electricity suppliers offering big discounts to households to try to maintain the illusion that prices are falling. The big trends are obvious.
(Apologies if this appears twice, having interference with addressing on my old PC.)
Geoff S
ToldYouSo,
I am interested in why you joined this blog discussion.
What motivated you to write what you did?
You can’t make money from writing on blogs or I’d be rich now.
I mostly write to inject science into some discussions and to correct questionalble assertions.
I can write about some aspects of nuclear because I got into the hands-on action about 1970 and spent years looking at arguments of the type that you repeat again here.
Essentially, there is a grain of truth in what you write, but that truth only emerges in extreme situations. You cannot draw much information from an argument between bureaucrates about stroring fuel rods for 10,000 or a million years. Those times are extreme in the context of this discussion, so why did you raise them
Also, I wonder about your sources. Colleague here in Australia, Peter Lang, has published peer-reviewed papers about the learning curve and how zealour regulation has increased the cost of nuclear in different countries and over different times.
Here is but one paper of his to lead you into others on the topic.
https://papers.ssrn.com/sol3/papers.cfm?abstract_id=2899971
….
Radioactivity suffered from an impairment that has become more common. In the post-war years, lay people were able to buy and use quite sensitive geiger counters and the like, that often made warnings like buzzing sounds when levels rose. This allowed people to find what they thought was dangerous radioactivity just about anywhere. The scare of Radon-22 in home basements was large, but false (with rare exceptions). Experienced scientists knew what was going on, but Joan and John Public, informed by an unreliable press, saw fright in many places. This has continued, sadly, with ridiculous concepts like the ‘linear no safe dose extrapolation method’ favoured by the semi-informed, a silly proposition when we all have lived in naturally radioactive surroundings that give a comparatively hefty daily dose, without much detriment.
What you are writing is fringe material outside of the core of hard science.
What do you hope to gain by posting such material here? I feel sorry for your misunderstanding of hard science and am happy to help you, if you choose.
Geoff S
Geoff,
Since you asked politely:
Your Q: “What motivated you to write what you did?”
A: I mostly write to inject facts and logic into discussions, and especially to correct incorrect assertions. I try to include links to reputable sources to support my posts, although many responders to my posts obviously don’t care to consider/reply to the provided linked information, instead choosing to reply with ad hominem attack(s). But that’s OK too. That is a great litmus test for me, and it greatly assists in establishing those that have a bias versus those commenters that maintain objectivity. However, I’m obviously not above a snarky reply to those who “throw the first punch”.
Your comment: “Essentially, there is a grain of truth in what you write, but that truth only emerges in extreme situations.”
Reply: No, truth is always “out there”, independent of there being normal or extreme situations. For example, isn’t the current factual situation of having well over over 85,000 metric tons of spent nuclear fuel from commercial nuclear power plants just being stored around the US—with no current plans for reprocessing or disposal of such—a considerable cost factor to be considered in evaluating the cost of nuclear fission reactors versus other power sources . . . the exact thrust of Willis’ article above? And this troublesome, dangerous waste is increasing year after year, with some unpublished, unacknowledged (AFAIK) annual cost to US taxpayers.
Your comment: “You cannot draw much information from an argument between bureaucrats about storing fuel rods for 10,000 or a million years.”
Reply: I draw the conclusion that any bureaucrat discussing storing ANYTHING for more than 10,000 years into the future is absolutely ignorant of the progress of science over the last 2,000 years. The current problem of accumulating and storing spent nuclear fuel (whether or not one chooses to call it “waste”) simple cannot be shoved 10,000, let alone one million, years into the future. Unfortunately, the bureaucrats control the money that could make things happen differently.
Your comment: “Also, I wonder about your sources.”
Reply: That is a good thing. As the Bible advises, “Test all things, hold fast what is good.” (I Thessalonians 5:21). As I said, I strive to provide links to objective, reputable, widely accessible sources to support my posts. It is inevitable that some sources will differ from other sources . . . “beauty is in the eye of the beholder (except if one follows the scientific principle, that is)”
Your comment: “What you are writing is fringe material outside of the core of hard science.”
Reply: I strenuously disagree. Please provide evidence, from any of my posts, to support your assertions of “fringe material” and “outside the core of hard science”. A single example will suffice.
Your Q: “What do you hope to gain by posting such material here?”
A: See reply to very first question above. Also, I believe WUWT welcomes science-based exchanges and discussions that may involve different points of view on various topics . . . am I wrong about that? Should there only be the view that spent nuclear fuel doesn’t pose any problem/cost whatsoever for mankind, now or going forward?
Your comment: “I feel sorry for your misunderstanding of hard science and am happy to help you, if you choose.”
Reply: I think your pity is misplaced, and I politely decline your offer for “help”.
Perhaps you would like to comment about the Onkalo project. There seems to be a high degree of confidence in its geological stability and low risk of leaching.
It is even more complicated than this.
The levelised lifetime costs of any given technology fall into several broad categories.
In short it is a massively complex calculation, dependent on many factors outside the control of planners, and I would hazard to guess that, like climate change itself, no one actually has the right answer. In normal times, the free market would be the mechanism that decides which technology is viable and which is not, but all (Western) governments are now committed to full on market distortion, by subsidy, by cheap interest rates, by mandating the use of particular technologies, and mandating that their product be bought in preference to more cost effective ones.
The simple way to work with the markets would have been to place a tax on all carbon fuel. The fact that this was not done, but instead governments were pressured into supporting a ‘Renewable Obligation’, that mandated a particular technology, with no actual regard to its actual efficacy demonstrates clearly that the objectives of the policy were not to reduce carbon emissions, but to increase sales of an expensive and unreliable technology produced by large companies with powerful lobbies.
I make this point because WUWT is spending an enormous amount of time coming up with rational arguments as to why CO2 is (at worst) only a minor component of climate change.
My thesis is that this is a total waste of time. The fact that renewable energy is being forced on us despite showing overall no net reduction in carbon emissions, and holistic costs well above nuclear power, clearly demonstrates that the political and industrial elite are well aware that renewable energy is pointless. At least insofar as reduction of emissions. It is however fast to deploy and extraordinarily profitable, because it is given preferential treatment.
“extraordinarily profitable”
Ex UK PM David Cameron’s wife’s father trousers £500,000 pa from the two wind farms built on his land.
Well, I’d say UNPROFITABLE, but the government “transfer of wealth from the poor, working class and middle class to the wealthy” pays off nicely for those who already have miser hordes of cash.
I don’t have the time to study this- but does the “levelized cost of energy” include the fact that wind and solar costs have to be repeated because they don’t last as long as a real power plant? (coal or gas)
I’ve run the numbers on just the capital costs of a few of these projects.
Atlantic Shores Offshore Wind https://www.power-technology.com/marketdata/atlantic-shores-offshore-wind-farm-us/ has a 1,510 MW nameplate rating and a $7.290 billion cost. Derating to the usual 40% for offshore wind that’s 604 MW. $7.290 billion / 604 = $12,069,536/MW.
Here are the numbers from Cape Wind https://www.power-technology.com/projects/cape-wind-project-massachusetts/ – 468 MW nameplate, $2.6 billion cost. Normal wind farms produce power about 1/3 of the time, so that’s 468/3 = 156 MW. $2.6 billion / 156 = $16,666,666.7/MW.
Duke Energy brought its 625 MW Sutton combined cycle natural gas plant https://www.spglobal.com/commodityinsights/en/market-insights/latest-news/electric-power/081115-combined-cycle-gas-fired-unit-costs-coming-in-below-expectations-duke in at $551 Million. $551 Million/ 625 MW = $881,600/MW.
I know it’s unbelievable, but offshore wind’s capital costs alone are over ten times that of conventional plants. Therefore Lazard’s numbers must be wrong.
The Manhattan Contrarian has done several articles on this subject https://www.manhattancontrarian.com/blog/2022-8-18-the-completely-fraudulent-levelized-cost-of-electricity.
Mmmm … MC, your analysis is incomplete. You need to multiply the MW generated (604 MW for Atlantic shores) times hours per year (8,766) to get MWh/year. Then you multiply that by their (optimistic) 20-year lifespan.
This gives $0.07/kWh for the capital cost, in line with the Lazard figures.
w.
Excellent analysis as always sir! Practical, pragmatic and no nonsense! We all must speak up when encountering the lies, damned lies and statistics of the climate cult misanthropes!
The record cost for one day of grid management in the UK is over £60m. Before the windmills came it only cost £200m for a whole year. And if we thought £1bn for 2021 was bad, it doubled to £2bn for 2022. And people wonder why when the new price cap from 1 July reduced the unit cost, the standing charge goes up yet again!!
Why run a cat5 wire, when you can run WiFi for about $30?
Depends on what you are transmitting and what the environment is.
If it’s secure data, cat5 is safer.
If it’s data that must get through (IE, no chance of interference) cat5 is safer.
For regular run of the mill stuff, WiFi is usually good enough.
Michael, as the result of amazing good luck, I have one gig fiber optic to my desk out here in the forest eight miles from town. We ran WiFi to the guest house using Google Home, but it tops out at about 40 Mb/sec. With the Cat5e, I’m now getting full one gig fiber speed (actually ~920 Mb) at the guest house.
w.
If you want to see the true idiocy of leaving out backup costs when calculating the cost of wind go to (among others)
gridwatch.co.uk/wind
Today, for instance, the 28GW faceplate has given
minimum: 1.844 GW
maximum: 3.322 GW
average: 2.346 GW
Yesterday was not much better. Last month:
minimum: 0.388 GW
maximum: 13.926 GW
average: 4.407 GW
Last year maybe?
minimum: 0.141 GW
maximum: 16.97 GW
average: 7.033 GW
So the question for Nick et al is, what are you going to use when its putting out 0.141GW for a few hours, and you have demand of 35-45GW on a cold dark calm winter evening when everyone has got home, turned on the heating, and is cooking?
You are going to use gas. And whatever you are planning on getting from wind, you have to have that total amount of gas instantly available (and hence burning more gas than if that was not a requirement – which is why Nick’s fantasies about paying for wind out of fuel savings are indeed fantasies).
Do you feel tempted to believe this nonsense about the wind peaks coinciding with the demand peaks? Use your eyes and look at when the peaks and more important the troughs are appearing.
Intellectual dishonesty and wishful thinking.
The three most important factors in the cost of a power plant is location, location, location.
If you live where there is a poor wind or solar resource, the cost of building is a moot point.
From my experience at nukes in the US, Spain, and China; nuke are the cheapest source of electricity.
The US plants and the one in Spain have exceeded their orginal design life that the construction cost were based. Power costs are even less than paid off gas and coal plants.
The new plants in China are designed for 60 years and will last 100. They are very expensive to build that should reduce operating costs. Nearby power plants are fueled with imported coal and oil.
Thanks to the US navy, china can import 75% of the energy they need.
This is that location thing. Build enough nukes and BEV and the CCP can sink US navy ships and China can assume their right place in the world.
Apparently the CCP forgot that it was tricky Dick Nixon and not the CCP policies to promote world trade.
I would have liked to see the life-cycle cost for each system. Construction, maintenance, decommissioning etc.
Oh, and remember those subsidies. Show me the cost after you’ve collected all them luvverley free taxpayer moola!
I do believe, if we ever find the demon controlling Schwab and Gore, we’ll find a little grey hobgoblin, surrounded by stacks of subsidy applications.
LCOE is not a useful metric for decarbonising electricity systems.
Here is paper on “total system cost”
MEGS: Modelling energy and grid services to explore decarbonisation of power systems at lowest total system cost
Here is an Australian Case Study of
Decarbonised_Electricity.pdf (modelling.energy)