Guest Post by Willis Eschenbach
I got to thinking about the ice cores. It’s pretty amazing to realize that the air trapped in the tiny bubbles in the ice is the very air that was trapped there way back when the ice formed. And that air can be hundreds of thousands of years old. Not only that, but we can analyze the trapped air to see the changes in CO2 over time.
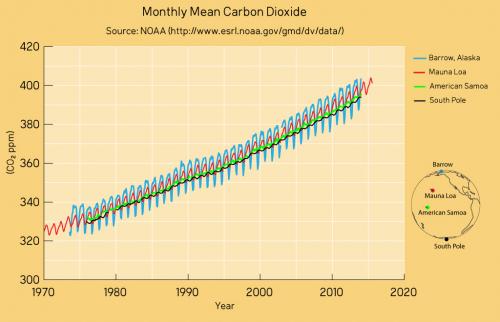
How accurate are the results? Well, different ice cores drilled and analyzed by different groups of scientists give very similar results. Here are some recent ice core CO2 measurements, along with the Mauna Loa measurements in orange.

Figure 1. CO2 measurements from a variety of ice cores, along with Mauna Loa measurements in orange.
As you can see, there’s very good agreement between all of the various ice cores, ice core analysis groups, and ice core CO2 measurement methods. And the ice core measurements agree with the Mauna Loa CO2 observations quite well.
Another thing that can be calculated from the isotopes in the air trapped in the ice-core bubbles are the temperatures back in the day. The Vostok ice core data, one of the longest datasets, recorded four glaciated intervals and five “interglacials” including our current interglacial, the Holocene.

Figure 2. Vostok global temperature reconstruction, along with modern (1850-2022) HadCRUT temperature measurements.
Now, there are several very interesting things about this graphic. First, people keep saying that a slight global warming is an “existential crisis”. But in both of the previous interglacials, temperatures were up to 2°C warmer than today. That’s 3.6°C warmer than the “preindustrial temperature”, far above the impending terror temperature of 1.5°C warmer than preindustrial that they keep scaring us with.
There were modern humans around for both of those hot spells, along with most modern life forms. It wasn’t an “existential crisis”. It wasn’t a crisis at all. It was a warm time.
And humans also existed through the glacial periods. In total, humans have seen a swing of +2°C warmer than today’s temperature to -9°C cooler than modern times … a very wide swing.
Next, the orange/black line at the right is the post-1850 warming. As you can see, the Vostok data indicates that the world has been warmer than today, both earlier during this interglacial as well as in every one of the previous interglacials in the record.
Call me crazy, but I’m not seeing any reason to panic or to demolish the fossil fuel economy in any of that …
Moving on, how about the Vostok CO2 data? Here’s a graph comparing the Vostok CO2 (right scale) and temperature (left scale) data.

Figure 3. Vostok Ice Core CO2 and Temperature.
So … is CO2 related to temperature? Is CO2 the secret temperature control?
The two are definitely related. And given the length of the dataset, almost half a million years, we can see that there is a clear physical relationship over the entire time. Either CO2 causes temperature changes, or temperature causes CO2 changes, or they both affect the other. As you might imagine, in nature the latter situation is the most common.
But regardless of the causation, clearly Figure 3 shows the long-term equilibrium relationship of the two. So we can investigate the various conditions.
First, let’s assume that CO2 is controlling the temperature. Analysis of the data in Figure 3 yields:
Change in temperature (∆T) = 13.4°C per doubling of CO2 (“climate sensitivity”)
Hmmm, sez I … the accepted value for climate sensitivity is not 13.4°C / 2xCO2. It’s somewhere around 2°C to 4°C / 2xCO2, far lower.
So let’s look at the opposite possibility, that temperature is changing the CO2. Analysis reveals the following relationship:
Change in CO2 (ppmv) = 9 ppmv per °C
Hmmm, sez I … seems possible. As the oceans warm, they outgas. However, that’s not enough to explain the modern CO2 increase.
Finally, it’s certainly possible that they are each affecting the other. CO2 might be adding a bit of warming or cooling to the changes of whatever’s driving the variations seen in Figure 2. Unfortunately, there’s no way to calculate that.
What else can we learn from the Vostok data? Folks keep talking about the speed of the current warming. Their claim is that the world can’t evolve or acclimatize fast enough to encomass the current rate of warming.
However, the Vostok data shows other times in the Holocene that it’s warmed (or cooled) that fast.

Figure 4. Warming rates in the Holocene, from the Vostok ice core data.
Finally, here’s a look at the ice core data overlaid with the modern changes in both CO2 and temperature.

Figure 5. Temperatures and CO2 levels. As in Figure 3, but with both ice core and modern observational data shown.
Hmmm, sez I, once again …
So that’s what I learned from the Vostok data—that humans have been through warmer periods many times in the past without them being an “existential crisis”, that oceanic outgassing isn’t the cause of the modern CO2 increase, and the speed of modern warming is far from unprecedented.
A rare day of soothing May rain here in California. At the end of last year, all the climate models and climatologists were predicting another very dry year … instead, it’s been one of the wetter years in history. The world’s best prognosticators were not just a little wrong. They were 100%, top to bottom and side to side wrong.
And these are the same models and folks who claim they can tell us what the average global temperature will be in 2100AD … yeah, that’s totally legit.
My best to all,
w.
PS—When you comment, please quote the exact words you’re referring to. This avoids many misunderstandings.
Willis,
Nice article. What is amazing is how close we are to another glaciation when looking at Fig. 2! I sincerely doubt that the prognosticators using current models will recognize when it starts and they will become the “deniers”!
Jim,
They’ll just claim that shutting down the Oil industry did the magic. They realize they’re running out of time, so that’s why they’ve put the New Green Deal into overdrive.
Unfortunately, all the kings horses and all the kings men could not put a reliable green grid together in time.
Jim they covered their it’s “the Science” butts already when they had the propagandists aka the Legacy Media, Universities, et. al. make the subtle shift, practically mid sentence, “man made global warm…ahh we really meant climate change all along”
It was about the same time they dropped the line about not conflating weather with climate and then started conflating weather events i.e. hurricanes, tornadoes, snow storms (this latter hobgoblin they began naming because it allows them to strike more fear in the hearts of the “dumbed down” post 1990 Public School students)
This of course can be correlated to “The Pause” when the Global Surface Temperatures stopped cooperating and we found ourselves more than 30 years down the road with no discernable change in GSTs or ocean levels. This should come as no shock that they began reporting climate changes by the manipulation of data and indefensibly altered data at that. So weather events, albeit not out of the ordinary, are the only thing they have to talk about as we approach a new glaciation. Convenient eh. This allows them to name and blame any storm that brings flood and property damage or drought no doubt due to man using fossil fuel to improve the quality of life.
So here we are a quarter century into the 21st and they have started brainwashing the public schools students that little girls can be boys and vice versa. Do you suppose it is to distract the public from noticing that the Faceless Cultural Elite Ruling Class are proceeding with their Global Domination Plans to reduce worldwide population and preserve oil for the more deserving. They have a vision for a 2 class worldwide population. “Dem dat has and dem dat don’t.” What a great time to be alive if you are a Hunter biden his time.
“post 1950 Public School students”…. corrected it.
Anatomically modern humans 300,000 years ago is a highly controversial conclusion. Before 233 Ka, skulls lack prominent foreheads and chins, have heavy jaws and brow ridges and elongated crania, among other archaic traits. Even fossils from c. 200 Ka still show some archaic features.
https://www.nature.com/articles/nature.2017.22114
Jebel Irhoud 1 was long thought to be a Neanderthal, with good reason.
Yes, it was the French archaeologist Hublin who wanted to big-note himself by claiming they were Homo sapiens. At best they are Homo heidelbergenisis, and definitely not our species.
You are so right. So why did he find fellow unindicted co-conspirators?
Close as in 2000 years? That’s about the time since Jesus Christ. I don’t think we should worry just yet. Orbital changes operate on a different timescale to us.
We have had a ‘little Ice Age’ in the last 2000 years, so thats is more likely again in the next 4-500
The Little Ice Age is a once-in-5000-year event produced by the coincidence of a 2500-year solar cycle and a 1000-year solar cycle. Another one coming in 4,500 years. The real ice age might be coming earlier than that.
I wasn’t implying that glaciation was imminent. Although, it could certainly start at any time. What I meant was that the current interglacial is longer than recent past ones. It is not unreasonable to expect that the end time of this interglacial is approaching.
The current warming of the NH is how the glaciation starts. It results in more atmospheric water at the end of boreal summer ahead of the rapid cooling of the land in the fall.
Snowfall records again in a few locations this year; a feature of weather reporting for the next 8,000 years. The snow coverage extent in NH has been trending up since records have been kept.
You get a better appreciation of the imminent end to the current interglacial by examining sea level reconstruction and solar intensity in the mid northern latitudes per attached.The sea level falls significantly just after the June solar intensity at 40N bottoms.
The temperatures do not begin to cool until the ice mountains are forming. The increased permanent ice reflects more sunlight and the increasing land elevation over the ocean level results in much cooler land due to the lapse rate.
Just a darned minute there… our Grandchildren have been promised there will be now snow to play in.
We don’t know when the next glacial period will start or how close we are. The Vostok data shows temporal variations of roughly 50,000 years. That’s quite a few lifetimes. If you look at the EPICA Antarctic data, the variations are weirder going further back.
Cycles of glaciation appear to be a relatively modern (in geological time) phenomenon. It’s not certain that we will even have another glacial period but it seems logical looking at the pattern in the Vostok data. And we don’t know the effect of the significant amount of additional CO2 in the atmosphere from burning fossil fuels. It is “unprecedented” in the epoch of glaciation, though not in Earth’s geologic history. There was 5 times as much CO2 during the Triassic period and it didn’t seem to bother dinosaurs much. The excess CO2 might potentialy slow the start of the presumed next glaciation or prevent it altogether, which might not be a bad thing since glacial periods are tough on agriculture. We just don’t know.
What we do know is that there is no imminent existential crisis from burning fossil fuels, though we will probably have to transition away from them eventually unless we figure out how to economically produce our own. Petroleum and natural gas sources probably aren’t everlasting.
“ Petroleum and natural gas sources probably aren’t everlasting.” “Probably” is just another guess. We keep discovering huge prospective fields. “everlasting” is one very important word of which no human being will ever know the meaning.
An excellent post on that, and more… https://chiefio.wordpress.com/2009/03/20/there-is-no-energy-shortage/
There is no real evidence that CO2 has any effect on global climate.
“The excess CO2 might potentialy slow the start of the presumed next glaciation or prevent it altogether, which might not be a bad thing since glacial periods are tough on agriculture”
“might not be a bad thing”? We would have to make thankful reparations to the oil companies for centuries.
So, it’s not the sun or oceanic outgassing. We’re going to need to round up more suspects as Putin might say.
Harvard physicist says meteor may be alien probe, plans expedition to prove it – National | Globalnews.ca
Good to know we can tell the global average temperature to a fraction of a degree from a single proxy measurement. Oh wait, we can’t.
What is the GAT? AFAICT the GAT is not known, ( large error bars) and every attempt comes up with very different answers. So, within “climate science “ they simply take a data set, and attempt to calculate the warming rate based on that data set with extrapolating factors from hundreds of miles away. ( Again, error bars are usually not included ) So they calculate an anomaly, not a GAT, and the “adjustments” always continue and tend to cool the past or warm the present. The satellite troposphere readings are likely the best atmospheric T gauge for many reasons, and they show very little warming.
They generally ignore the option of using only long measured location stations well situated for avoiding errors like Urban Heat Islands, etc. The Ocean Heat content studies are all over the map with very large error bars and very legitimate published peer review criticisms. The entire GAT field is frankly FUBAR with dozens of critical papers published in the Peer Review literature. Much greater resolution would be needed with consistent similar methodology and proper station settings as well as an accurate calculation of global humidity. This is well beyond our current ability now, let alone for the historic past with disparate measuring instruments, practices, and coverage that was very sparse.
The USHCN, or United States Historical Climate Network of well dispersed long running stations shows the US 1930s as the warmest decade. Globally, there is no such detailed record.
Thanks for the article Willis. Perhaps worth a reminder for the casual reader that when comparing rates of change for past and present we have to be mindful of the time resolution of the measurement and proxy. We have annual/daily/minute based change now but a lot of the proxies are much wider, so we can’t make claims about rates of change below the precision of the proxy. I’ve read different views on how precise ice cores can be, including rates as low as 40 or even 20-years. Original accumulation rate, depth of sample, analysis method, etc. would all factor in for a precision specific to each core, and even section of core.
Drillers don’t know which years didn’t snow, don’t know which years melted away, if any, and don’t know the best drilling spot to get representative layers. They have to figure it all out, which requires a mental framework of how things work, which requires faith in static rules and guesses that follow the rules. Not everyone has the time to do the work, so most of us have to trust strangers, even if we never met them and never will.
Willis, would like to hear your opinion on this video.
https://twitter.com/FatEmperor/status/1654244932763123712
It has some ice core/temperature components in it.
Chariots must have caused the Medieval Warm Period.
Ah the high emission powered Ben Hur effect?
The power of methane.
Horses DO sweat.. well, female horses ‘perspire’ of course. I used to value their heat when I rode in Winter weather.
Equine flatulence!
It amazes me that no one ever seems to talk about the stability (or potential instability) of the air samples trapped in the ice. I find it very difficult to believe that, once trapped, diffusion stops and the composition in the air bubble remains perfectly constant for hundreds of thousands of years.
You’re right. To get the agreement between ice core data and Mauna Loa data as shown in Figure 1, the ice core data was highly “adjusted.”
One of those was a change to the supposed “age” of the air bubbles, WITHOUT any scientific justification, since the cores actually showed CO2 rising above where they were, about 3/4 of a century LATER, when Mauna Loa measurements began.
Oh, and they also tossed high readings as “outliers.”
As for CO2 having an effect, sorry, that is most definitely not shown by ice core reconstructions. Temperatures consistently begin RISING when CO2 levels are (a) FALLING and (b) near their LOW point, and consistently start FALLING when CO2 levels are (a) RISING and (b) near their HIGH point.
This clearly indicates a temperature effect on atmospheric CO2 levels, NOT the other way around. The notion of an atmospheric CO2 level “effect” on temperature is an article of faith and nothing more.
I may be wrong here, but my understanding is that there are air bubbles in the young still-forming ice, called ‘firn’, but that there are no bubbles in the ice further down. That means that all the air molecules, including CO2, have been pressed into the ice, which implies that they do have to be able to move a bit in ice, even if only a tiny bit. I raised the question back then, and one WUWT commenter, I think Ferdinand Engelbeen, gave a convincing explanation of why the ice cores were in fact reliable in this respect.
Mike, I have reviewed some of the ice core data and came to doubt the veracity of the low-level CO2 data recovered from the Holocene.
The CO2 level as measured by Dome C Antarctica cores has been slowly rising from 260 ppm after the Holocene Climatic Optimum to 285ppm in the LIA, then rising strongly beyond 410ppm since 1950 together with modern industrialization. This data supports AGW. But, is now suspect because Jaworowski (2009) showed false low CO2 levels due to bubble contamination in Greenland cores and that the cores show inverse correlation between CO2 levels and load pressure: whereby the deeper the ice, the greater the pressure and thus lower CO2 levels. Poyet (2021) says research shows that the closed system of trapped air bubbles in the ice is not valid, liquid water is present, so that a significant equilibration loss of CO2 has occurred during several hundred years of snow compression to firn and then ice at depths of 80-100m. In deep ice, pressure ensures air bubbles disappear and solid clathrates form thus lowering CO2 levels. Contamination of cores also occurs during the drilling process or decompression during retrieval, but the temperature graph remains uncompromised.
He states “Furthermore, the evidence from direct balloon measurements of CO2 in the atmosphere indicates that the 19th Century average concentration was 335 ppmv“(Slocum, 1955). More than 90,000 direct chemical measurements (by the Pettenkofer method to 1961, then by cheaper infrared spectroscopy to 2004) in the atmosphere at 43 Northern Hemisphere stations, show that CO2 varied very significantly [290-440ppm] over that period (Beck, 2007, 2008). Finally, and very importantly, ”a study of stomatal frequency in fossil leaves from Holocene lake deposits in Denmark, showing that 9,400 years ago CO2 atmospheric level was 333 ppmv, and 9,600 years ago 348ppmv, finishes (sic) to falsify the concept of low and stable CO2 air concentration previous the advent of the industrial revolution.”
The direct measurements of CO2 imply that the relatively flat Ice Age Antarctica ice core CO2 data is homogenized and incorrect, or not properly representative of the rest of the world.
So further research into this topic is quite critical for the AGW theory.
Dr. Markus Ott has his doubts too:
Good discussion of several of the issues.
Can they tell from the core values if they are in a strata that has melted and refroze?
Out gassing is not limited to Henry’s law. When ocean water evaporates, dissolved CO2 is released to the atmosphere. Also, when cold water freezes in the top of thunder clouds, dissolved CO2 is released into the upper atmosphere.
I also have doubts about the applicability of Henry’s Law to a mobile ocean.
I can see that for stationary water then Henry’s Law would not provide enough outgassing but what we actually have is a complex global system of ocean water overturning.
If fresh CO2 rich deepwater is constantly being fed to the surface and then heated by incoming sunlight the parameters of Henry’s Law are simply inadequate.
And the rate of that overturning can vary with time.
So, my conclusion is that ocean outgassing is responsible and the ice core record fails to capture large short term variations in atmospheric CO2.
I’d also think that rising CO2 IN ocean waters, which nobody is measuring, would have an effect on how much is outgassed into the atmosphere.
I would point out :
1) CO2 is NOT a well mixed gas globally … measuring CO2 in air bubbles from the a** end of the world is hardly a global measure
(maybe someone should take monthly CO2 readings from the ice core location so that a true apples to apples comparison can take place. Comparing to Hawaii is not science its just working with what you have … and meaningless )
2) the supposed “temperature” measured from these air bubbles are useful … to determine the temperature of that location … nothing more …
3) assuming the temperature and thus the outgassing potential of the global oceans based on these air bubbles seems to be a leap of faith that rivals the Fonzie’s shark jumping …
“someone should take monthly CO2 readings from the ice core location”
A major site is the South Pole, which is pretty close. Wherever you measure properly around the Earth, you get the same result. The only difference is that the South Pole has little annual variation.
You need someone to proofread – at some point in the middle language gets awkward. I’d guess hurrying to meet a deadline or watching hockey playoffs while writing, but I’d have no proof.
“Unfortunately, there’s no way to calculate that.”
Models. No one loves them, everyone has them.
Kevin, I ask people to quote the exact words they’re discussing specifically so people like you won’t make this kind of useless, detail-free, unpleasant hand-waving attack. But nooo, you’re too good and noble and arrogant to follow such a simple request …
And if you trust the climate models, more fool you.
w.
‘No one loves them, everyone has them.’
Like haemorrhoids?
I ain’t got no stinking hemorrhoids! And I sure as heck don’t trust climate models when weather model forecasts can’t be counted on to be reasonably accurate beyond three days out!
The Old Farmers Almanac beats out NOAA’s seasonal forecasts about 90% of the time. Pathetic is the best word I can come up with to describe the performance of climate models and those that believe in them.
We can be fairly certain that the Mauna Loa CO2 rise comes mostly from combustion of fossil fuels. 12C is preferentially consumed in photosynthesis because lighter than 13C by one neutron. So over the ages, the atmospheric 13C/12C ratio went up as fossil fuels sequestered mostly 12C. Over the Mauna Loa era it went down, because 12C was released back into the atmosphere by fossil fuel combustion.
I have a problem with that isotope calculation because we do not really know what goes on with CO2 in the oceans involving organisms such as bacteria, planckton, algae and krill especially when irradiated by sunlight.
Yes, but what we do know is that during a La Niña, or following Pinatubo, the atmospheric 13C/12C ratio is flat or even increasing. I agree with your point.
Yeah. There are a few smoking gun lines of evidence like this. The 14C drop prior to the bomb spike and then the shape of the depletion afterwards is one. The O2 decline is another. But if these are proverbial smoking guns then the law of conservation of mass is the proverbial nuclear bomb mushroom cloud. We put 670 GtC into the atmosphere of which 275 GtC was retained.
You can’t say it’s any kind of smoking weapon when the natural CO2 sources and sinks are about 10x bigger – nothing forces those to be in balance, in fact the more CO2 available the more plants and plankton will take advantage of it. If the termites have a good year, they push the CO2 up (they produce about 50% more than all of humanity.
If Mauna Loa’s measurements went up and down with every economic boom and recession I’d believe the narrative but Mauna Loa only really seems to respond to bug eruptions – by actually dropping in CO2 (seems like minerals in the eruption landing in the water stimulate the little plankton)
The fact that CO2 concentration didn’t change by more 20 ppm in 10000 years means that sources and sinks were roughly equal. And it doesn’t matter that natural sources are 10x larger. If the sources increase more than the sinks then mass will accumulate in the atmosphere. The law of conservations of mass says so in no uncertain terms.
Perhaps, yet still not a “smoking gun” as that indicates a crime, and CO2 is a massive benefit.
I don’t mean to imply a crime; just causation.
No, it means you’re comparing highly suspect proxy “data” to modern instrument measurements like they are equivalent.
No, I’m not. Proxy data has nothing to do with it.
“We can be fairly certain that the Mauna Loa CO2 rise comes mostly from combustion of fossil fuels.” Not true! Increased greening of the oceans with phytoplankton which die and decay in the tropics can produce far more atmospheric CO2 than can be admitted by burning fossil fuels.
Phytoplankton take carbon from the atmosphere.
Yes they do and a lots of it. They also die and decay (mostly in the tropics). They live near the surface where they can get sunlight. When they die and decompose, the carbonate shells create the observed “snow” that falls to the ocean floor. Most of the CO2 that is produced by the decomposition is released to the atmosphere.
Even if all of it were returned to the atmosphere it would be net zero taking up as much as it emitted. If even a little bit stays in the ocean then it would be a net sink taking up more than it emitted.
Yes. Globally it is “net zero” from year-to-year as cold open waters at the poles absorb all the CO2 that is being emitted in the tropics is being transported to the poles via jet streams.The best evidence for this is the within-year variance of atmospheric CO2 at Point Barrow and it’s correlation with Arctic sea-ice concentrations freezing and thawing.
That makes an assumption without evidence by assuming that the population of phytoplankton is a steady state.
It assumes that phytoplankton mass is increasing, the mass increase comes from the carbon stock in the atmosphere, and that the law of conservation of mass holds.
The net increase in atmospheric CO2 comes with a net δ13C of -13‰. Yes, the conservation of 13C mass does hold. Both stable isotopes of CO2 must adhere to this principle.
Right. But I wasn’t talking about isotopes here. If phytoplankton get their carbon from the atmosphere and only return a fraction when they die then an increase in phytoplankton mass necessarily means it is a net sink working to reduce the amount of carbon in the atmosphere.
“carbon stock in the atmosphere”
again.. wtf is “carbon stocks”
Very little actual “carbon” in the atmosphere.
and nowhere near enough carbon dioxide, either…
I don’t understand the minuses on your brilliant observation!
Are you asking about the -13‰ figure for δ13C that Jim Ross posted?
No, I was referring to the -3 approval rating your observation about plankton never being a carbon source. I see you’re back to 0… see, there is justice!
Lol…got it. I was totally confused trying to find a negative number somewhere and never thought about looking at the votes. I almost never look at the votes.
Agreed. But what happens when the phytoplankton die (as in an El Niño). Some of it goes to the bottom of the ocean, but how much is emitted to the atmosphere? And what is the d13C of the released CO2?
If phytoplankton take carbon from atmosphere and some of it goes to the bottom of the ocean then less carbon will be emitted to the atmosphere than was taken.
In the northern Pacific and Iceland Sea regions (and presumably in other similar environments), there is a huge drop in surface water pCO2 in April/May (a long way below that of the overlying atmosphere) which would appear to be due to phytoplankton activity and which likely leads to some CO2 removal from the atmosphere. However, the major phytoplankton presence in tropical regions is associated with upwelling cold waters (e.g. in the tropical Pacific and off the west coast of South America) where the CO2 is sourced from the deeper ocean. Some of this CO2 is released to the atmosphere due the (upwelling) surface waters having a higher pCO2 than the overlying atmosphere.
“Phytoplankton take carbon from the atmosphere.”
WRONG.. they use “carbon dioxide” in their growth process
With carbon dioxide, they would not exist, and all life on Earth would follow.
Oh, thank goodness, somebody cleared that up for me! All the while I thought there was carbon in carbon dioxide…I’m so dumb, hur
But, bnice2000, have you not touched upon a major conspiracy theory here? If the plankton uses carbon dioxide, how long before we all smother to death, brother; them darn planktons is stealing our oxygins!
Silly me, bnice SAID they use carbon dioxide, not carbon or oxygen! I really am so dumb, there’s enough to breathe, unless we become too many…oh dear…it’s worse than we thought!!!
Rud,
Yes, directionally this is correct. But, in some years, the 13C/12C ratio increases. What is the source of CO2 that does that? It certainly is not fossil fuels (with a d13C of -28 per mil). Further, the average 13C/12C ratio of the incremental CO2 since 1760 is (in d13C terms) constant at -13 per mil. Please explain your hypothesis in this context.
Easy answer, but I went and read the literature to make sure. Basaltic (but not andesic) volcano CO2 is relatively 13C enriched compared to the atmosphere today. This is because the basaltic magma is formed relatively deep in the mantle, where heavier 13C was preferentially sequestered since Earth’s formation. Over the Mauna Loa observation time period, basaltic eruptions (Hawaii, Iceland) will bump up the 13C/12C ratio. Then the combustion of fossil starts lowering it again.
Further reply with supporting interesting facts. Perioditic (“P type’ primordial carbon) diamonds are also 13C enhanced, while eglotitic (‘E type’ diamonds formed from surface carbon recycled by deep subduction) are not. There are interesting papers showing the different types across thousands of individual kimberlite pipe Diamond mines. Fairly well understood Diamond geology which I only researched just now.
Thank you for your response. However, there are some issues with your “easy answer”. The difficulties encountered by van der Velde et al (2013) and Keeling et al (2017) would suggest that such an easy answer is probably not the correct solution, and I note that in neither case do the authors consider volcanic emissions as a significant contributor to atmospheric CO2 or the mass balance of 13C.
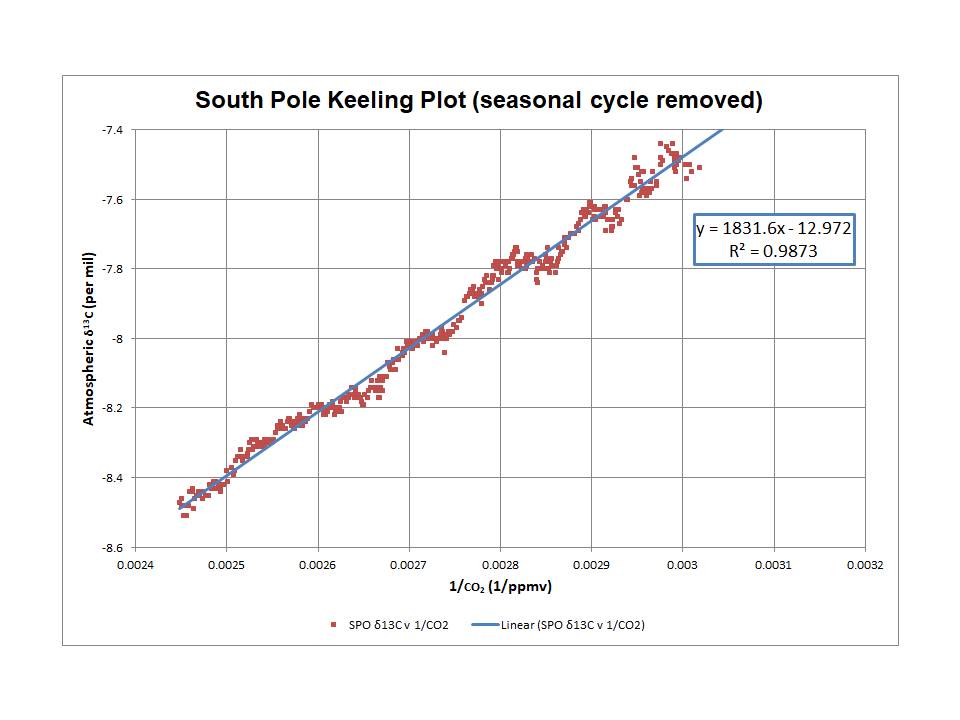
The available measurements show that the net δ13C of the incremental atmospheric CO2 since 1760 or thereabouts (the period of CO2 growth as shown on Figure 1 of Willis’ post) has been remarkably consistent over the longer term at around -13‰ (per mil). This is best demonstrated by ‘Keeling plots’ which reflect 13C mass balance equations: the reciprocal of CO2 is plotted against δ13C and, provided that the net δ13C remains essentially (i.e. on average) constant, this will show a linear relationship where the intercept of the plot will reflect the net δ13C of the incremental atmospheric CO2.
The Keeling plot shown below is based on the data published by Scripps, which has had the seasonal cycle removed by Scripps (not a major adjustment as the seasonal cycle is very limited at the South Pole). Direct δ13C measurements are available from early 1977, but with a fair number of gaps in the first few years. I also use the South Pole data here for a more valid direct comparison with the Law Dome ice core data. The plot shows a strong linear relationship reflecting the long term growth in atmospheric CO2 with an intercept of -13.0‰ and an r-squared of 0.99. The evident variations in gradient over the shorter term appear to reflect ENSO events and Pinatubo.
According to my analyses, also based on the Scripps data with the seasonal cycle removed, the equivalent values for two other observatories are:
Point Barrow: -13.2‰ and an r-squared of 0.96.
Mauna Loa: -13.4‰ and an r-squared of 0.98.
A Keeling plot of the Law Dome ice core data is shown in Figure 1 of Kőhler et al (2006), where they derive a δ13C of -13.1‰ (r-squared 0.96), which is virtually identical to the South Pole result based on direct atmospheric measurements. The Keeling plot approach does not need to consider the estimated age of ice formation; it only considers the δ13C of the incremental CO2 as the measured CO2 increases. This is, or should be, of interest to those who are sceptical of the recent ice core data.
I understand that the δ13C of CO2 emitted from a basaltic volcano such as Mt. Etna is around -1‰. So, in order to achieve a net value of -13‰, we would need (as a simple answer) the incremental atmospheric CO2 to be a mixture of 54% volcanic CO2 and 46% fossil fuel emissions (with a δ13C of approx. -28‰), with the volcanic CO2 emissions growing in this ratio to fossil fuel emissions (on average) from 1760 through to today. Seems a bit unlikely to me.
Over which ages – millions of years or 100’s of millions of years?
Soil organic matter would/will have the exact same 12/13 ratio as fossil fuel.
How do you know we’re not burning soil as opposed to fossil fuel
If we were creating soil, what would that do to the 12/13 ratio
“Mauna Loa Era” corresponds exactly to when Nitrogen fertliser started being used in serious quantity – and It Burns (oxidises) Soil
(In conjunction with Tillage – as a self proclaimed farmer, how do you not know that)
CO2 levels started ramping up at exactly the same time as did Ammonia fertiliser production and have remained in lockstep ever since.
Glyphosate also.
Glyphosate is not just a ‘weedkiller’ Glyphosate is an antibiotic:
Trans: Contra Life
Soil is living stuff. Glyphosate kills it
When it dies, it becomes CO2
Glyphosate will kill us also, in very subtle ways and already is doing so and in large numbers.
It starts by making us mad/demented/autistic/alzheimers
It gets worse: Because of Monsanto’s Big Lie
i.e. Monsanto asserted that “it decomposes in the soil”
Total bollox: It Does Not Decompose In The Soil
Because Glyphosate is properly a ‘Growth Regulator’ (not an actual toxin/killer) – when any farmer starts using Glyphosate, it slows the growth of successive crops and he has to use correspondingly & increasingly ever more (nitrogen) fertiliser to compensate.
Doing ever greater damage to the 12/13C ratio as he does
and us. and the soil, and the climate
Yes, but 12C also comes from “natural” sources and nobody is measuring those, so not a convincing argument.
Keeling curve simply shows that Earth system is not sequestering as much carbon as emission. The annual deficit is something like 10 GtC.
This may be in part due to the reversal of soil development, now to a regime of net erosion, or at best nil.
Annual greening cycle is far less relevant than the ability of the biosytem to sequester that down into soils. You need a whole ecosystem of animals and fungi to biodegrade the leaf and woody biomass litter into stable soil organics. The stuff needs to compost down – not just sit and oxidize.
At any given time, above ground plant biomass is something like 500 GtC. Stable soil carbon is something like 2500 GtC. Atmosphere is something like 800 GtC.
Soil genesis commenced around 400 -500 million years ago when the first organisms colonized the terrestrial lands. Beginning at that time, the stable soil carbon began to accumulate.
Now, there is practically no biosequestration.
Climatology just figures biosystems are net nil when it comes to biosequestration. But that is clearly nonsense. Historically, there was a net accumulation of carbon into soils.
Spot the biosequestration, and the recent reversal.
https://images.squarespace-cdn.com/content/v1/5fe9fd582e417d25f7472808/1618250620384-GZ9DU0QPD9JNUIFAPN2T/Temperature+and+carbon+dioxide+for+500+million+years+-+earths+past+climate+-+highest+co2+levels+in+earths+history+-+paleoclimatology+-+CO2+ppm+-+paleoclimate+reconstruction+-+paleoclimate+record+from+net+zero+blog+by+Mathew+Hampshire-Waugh
A very similar story to what I’ve been telling since I first ever came on here.
The timing is impeccable, some of use have just watched a video describing I’ve not gained any traction and why you won’t either
https://wattsupwiththat.com/2023/05/05/climatetv-live-at-1pm-edt-embracing-petro-masculinity/
That masculinity is very very real and very very damaging and we now see it all round us (why divorce is now endemic and why birth rates have fallen off a cliff)
Also myriad sexual dysfunction as boys try to find other ways to vent their drive/frustration
That masculinity is utterly fake – it is false (drug fueled) bravado.
(The drug is = sugar mixed with alcohol)
Why divorces are rising and babies are falling is that boys are now scared shitless of girls.
So they create videos like they just did making fun.Trying to laugh off the charges.
Why the ‘soil & soil erosion arguments’ wont gain any traction in this (fake) masculine environment is that they invoke the existence and workings of Gaia
And Gaia Is A Girl
This is why the reported/accused misogyny isn’t any sort of real actual hatred of girls – its just that the boys in their sugar/alcohol induced stupors don’t have the mental agility anymore to engage with the girls socially, or any other way.
So boys try to make a joke out of it (as we see in the video) but after a while, what are the girls to make of it?
Apart from to think that the boys now hate them.
Its why I keep saying ‘Learn to dance’
Dance is talking without words – its a way of showing who/what you really are and in it’s manifestation is incapable of mendacity.
Also that you have self confidence and are able to make/admit to mistakes = make a fool of yourself.
That is what is missing and is what the drug (alcohol/sugar) strip clean away from all their consumers/users.
Check any and every dating site and what are All The Girls Looking For:
a Good Sense Of Humour
(= diametrically opposite to taking the piss and telling lame/rude jokes)
Even Gaia would find that attractive but boys now are so uptight and frightened of making mistakes, and would never admit if they did, then the whole fabric of everything falls apart.
It’s sometimes called ‘Magical Thinking’
as is exactly happening and we see reported daily on these pages
Tend to disagree. Oceans at 71% of earths surface, and calcareous single cell photosynthetic ocean organisms (those that result in seafloor limestone and chalk) are the main semipermanent CO2 sequestration mechanism. So efficient that, but for plate tectonics and andesic volcanoes (think Pacific ring of fire) ‘recycling’ the sequestered CO2, Earth would die from lack of CO2 for photosynthesis in something like 2-4 million years. The estimates vary mainly because of deep ocean plate tectonic rate uncertainties giving recycling rate uncertainties.
There was indeed an explosion of life at the commencement of subsequent carbon sequestration. I find it unlikely for Earth to die from lack of CO2, however. The atmospheric quantities of carbon dioxide, oxygen, and nitrogen appear to not be simply a matter of coincidence. Rather, is it a consequence of the thermodynamics of maximum entropy production. Carbon dioxide for life, oxygen for cycling, and nitrogen to minimize oxidation of all matter instantaneously i.e. fire.
Ice core analysis always makes me want a better understanding of the temporal resolution of the Co2 measurements. As far as I have found out, the deeper [older] the layer is, the more difficult it is to discern annual layers as they become so thin. How does this affect the ability of cores to capture changes on annual, decade, or century levels? Most explanations on ice core analysis I found online simply state the methods are ‘high resolution’ without defining what this means. Would relatively rapid changes such as that seen in Mauna Loa data be captured in measurements from the deepest layers? If the change persisted I’m sure it would. But if it rose and fell within say a century, would we be able to detect it?
Willis,
The climate sensitivity you calculated is for Antarctic temperatures compared to global CO2 for the past 400,000 years. Antarctic temperatures show much larger temperature ranges than global temperatures during glacial to interglacial transitions.
The calculated temperatures from ice cores are based on accumulated amounts of snow and don’t represent Antarctic temperatures but are a measure of the global energy required to evaporate that amount of water.
Fred,
A linear relationship between the mean annual isotope content of precipitation (deuterium or d18O) and the mean annual temperature is established at the precipitation site, in this case Vostok, Antarctic. This relationship is used to infer past temperatures at the ice core site and represent temperatures at that location. You are correct that there are factors that affect the isotopic composition of the air mass as it moves from the source region to the deposition site. However, the calibration to temperatures is site specific.
https://hal.science/hal-03334997v1/file/jgrC1997Jouzel26471.pdf
Those isotopes are for globally evaporated water that is deposited as ice and is not a function of the temperature at the deposit site.
The isotope ratio depends also on the evaporation site; the tropics.
“As the oceans warm, they outgas. However, that’s not enough to explain the modern CO2 increase….that oceanic outgassing isn’t the cause of the modern CO2 increase”
This is only half right, because outgassing isn’t the only thing happening as the ocean warms.
The statement is like many others here who made a similar mistake in common.
The CO2 increase was also forced by the warming ocean, changing in solubility since 1854.
The common mistake made almost universally, like a knee-jerk reaction, is people have assumed this means the change in ocean CO2 solubility in our time supplied ALL of the CO2 increase, which is not true; I never said it did, and have had to make this point numerous times.
A warming ocean yields less sinking area and more outgassing area, a real solubility valve. This valve regulates the total sum of atmospheric CO2 which includes the man-made portion.
The operation of this ocean surface temperature CO2 thermo-regulation is evident over time:
The other problem I see here is the belief in the ice core data as being a true picture of reality. Renee Hannon wrote several articles for WUWT questioning the veracity of ice core data. I tend to favor the idea that the published data attenuates the actual variation by about half, skewing our perceptions of our time with the times in the past. However the CO2 lag is very evident:
Where today’s ocean temperature is on the CO2 solubility curve (est. by Henry’s Law) is an important reason why the modern CO2 increase has not already been absorbed by the ocean (sunk) in spite of climate science claims that the ocean has been an increasing CO2 sink.
The warmed ocean will not allow sinking at a higher rate so the atmosphere accumulates CO2.
There is no accumulation from year-to-year. The cold open polar ocean waters are the ultimate sinks for atmospheric CO2.
There would be no Keeling curve if there were no year-to-year CO2 accumulation.
I have read many times that plant death will occur below 180 ppm of CO2. It’s odd that the CO2 has never fallen below that given how much it has varied. Is that just a coincidence or is there some other explanation?
Yes. If CO2 is the ultimate control knob, I would speculate that an iceage would result in more CO2 being removed from the atmosphere, and more cooling, until we got into a death spiral. In other words, the opposite of what the climate cult is claiming we are in now.
I agree that it is surprising that the Earth never did fall below the plant death level.
I suspect there are several negative feedbacks that protect against falling below that level.
I have observed landscapes rapidly erode under drought conditions once the ground cover plants decayed enough to cease their erosion control function.
Perhaps one negative feedback is that as plants die globally, erosion of top soil greatly increases, returning the carbon in the stored organic matter back into the atmosphere?
Ralph Ellis has an interesting explanation.
Here is link to his recent WUWT comment (including a link to a video of him explaining his theory):
https://wattsupwiththat.com/2023/02/12/final-brief-submitted-in-checc-v-epa/#comment-3680281
And here is his earlier paper:
https://www.sciencedirect.com/science/article/pii/S1674987116300305
Very nice Willis.
Interesting exercise by Willis. However, the only ice bubble I trust is the one trapped inside the P-38’s buried 54 meters (or so) beneath the Greenland ice where they crash-landed during WWII. The accumulation of 54 meters of snow and ice is hardly a prediction of runaway hell on earth temperature change.
Ron, I fear you misunderstand the nature of the Greenland ice cap. It’s like a very slow-moving vertical river. As more weight is added on top from new snow, ancient ice is squeezed out of the bottom and breaks off as icebergs.
As a result, it’s no surprise that anything (airplane or whatever) ending up on the ice cap will be covered with snow and sink in the slow vertical river. However, this does not mean that Greenland ice mass is increasing.
Regards,
w.
Interesting how those with a vested interest will downvote basic science.
Greenland’s ice sheet gained a titanic amount of mass in 2021-22:
https://clintel.org/how-the-greenland-ice-sheet-really-fared-this-year/
Far above not just the low year of 2011-12, but the 1981-2010 average.
That “titanic amount”, amounts to just a few tenths of an inch.
Also, as the pressure builds up, the speed at which ice is pushed out the bottom of the glacier increases.
Actually I understand the dynamics of ice caps and glaciers very well. The health of an ice cap and/or glacier is in the uptake zone, where sufficient snow accumulates to promote viscous flow. The point is that about 150 meters of snow fell on the P-38’s, compacting more below as the weight removed air bubbles and the snow became ice. My point is a bit oblique to your interesting post on ice cores, but how can the earth experience this type of snow accumulation, converting to ice, in a warming world?
Easy peasy, even if the world were warming, the tops of the Greenland glaciers would still be well below freezing for most, if not all of the year.
You are aware, are you not, that Ron is an actual geologist, and you are not? To put it mildly.
He’s not showing it. The GrIS has lost ice every year since the 1990s.
No, it hasn’t. Please see 2021-22. Huge gain.
It has trended up since 2012, same as Arctic sea ice extent.
The GrIS lost 84Gt of ice for 2021-22. Please educate yourself. My guess is that if there’s even a shred of honesty in your claims, then your blunder comes from confusing SMB with TMB. If so, you can educate yourself here.
https://www.carbonbrief.org/guest-post-how-the-greenland-ice-sheet-fared-in-2022/
By that logic, we should all go home and stop questioning the so called “climate experts”.
PS, we are talking about glaciers here, not geology. Why do you feel expertise in geology translates to cannot be questioned regarding glaciers?
Glaciers loom large in geology. Most, if not all, of what is known about ice sheets and glaciers comes from earth scientists.
https://en.wikipedia.org/wiki/Louis_Agassiz
And even earlier, Hutton himself and Playfair:
https://www.cambridge.org/core/journals/journal-of-glaciology/article/early-discoverers-xxvi-another-forgotten-pioneer-of-the-glacial-theory-james-hutton-172697/EE75CBD182BE1FA9B8D500D406465A95
Climate “experts” are nothing like geologists, who are real scientists, and among the leaders in questioning GIGO, computer gaming “climate science”.
Glaciers are one line of evidence. They are not themselves geology.
I didn’t say that geologists are like climate scientists, I said that your logic is similar to that used by climate scientists.
If this truly is the limit of your reading comprehension, no wonder you think that the glaciers have grown 54 meters taller in the last 70 years.
That plane sank 54 meters, the glaciers did not get 54 meters higher.
The P-38’s did not sink one meter, snow piled up on top of them. The 54 meters, plus or minus, represents a very thick snow fall, maybe 150 meters or more.
Snow piled up, which pushed the plane down. The glaciers have not gotten 54 meters higher. Even if the world has warmed up by a degree or so over the last 100 years, the tops of the Greenland glaciers are still well below freezing, so their is nothing unusual or surprising about it continuing to snow there.
In fact, if the oceans around Greenland were warming up, it would result in more evaporation from the oceans and hence more snow on top of the glaciers.
It really is sad the way some people down vote anything that disagrees with the nonsense they are preaching. Heck with science.
In 1992, Glacier Girl was under about 82 meters, IIRC. Her squadronmate, Echo, 30 years later, now lies under even more snow and ice.
Which proves nothing about anything.
Snow falls on glaciers, sinks and is eventually carried downhill to the end of the glacier.
The planes are sinking along with the snow/ice. That’s just how glaciers work.
Willis,
There are some pretty obvious mistakes here, most them stemming from the fact that Vostok does not record global temperatures. It records only local temperatures, and polar amplification means that variation between glacial maximums and thermal maximums are greater than changes in the global average. Here’s a list of some obvious mistakes coming from this bit of confusion:
1. Your figure 2 does NOT show that the globe was 3.6 C warmer than preindustrial temperatures. It shows that Vostok has been 3.6 C warmer than Vostok was in ~1950.
2. The actual difference in global temperatures between the LGM and HTM is ~5 C give or take (Shakun calculated a little less, Osman a little more). Let’s call this one ice age unit – that is, 1 IAU = 5 C. This means at 1.2 C, we’ve already experienced about 20-25% of 1 IAU. As much as ~4 C is possible (if contrarians get their way) by 2100 or in the next century, so we could experience ~80% of 1 IAU due to human activities.
3. Human civilization has never existed in a glacial period. Civilization has never experienced +2 C warmer or even -1 C cooler than preindustrial temperatures. We built civilization when global temperatures were relatively stable. The total range of experience that human civilization has seen is ~2 C.
4. In figure 3, You cannot calculate ECS from a local temperature graph for numerous reasons – a. it’s local, not global, b. the time scale means you’re actually looking at ESS, which ~1.5x larger than ECS, and c. you’re not accounting for other forcings besides CO2.
5. In figure 4, even if you calculated rates of change accurately, it’s still just local temperatures, and local temperatures can change far more rapidly than global. It’s wrong to compare warming rates at a single location with global warming rates. And while we’re at it, Antarctica temps are surface temps, so you should have used a surface dataset.
6. CO2 is les soluble in warmer water so the increase in CO2 during these cycles is likely largely a product of an ocean to atmosphere CO2 flux, but that is not an argument against the overwhelming evidence that human increases in GHGs are driving current warming.
There are multiple blunders here, most of which stem from confusing local with global temperatures.
Minoan civilization enjoyed a balmy climate 4 degrees C more clement than Crete now:
https://journals.sagepub.com/doi/10.1177/0959683617752840
Tsunami sedimentary deposits of Crete records climate during the ‘Minoan Warming Period’ (≈3350 yr BP)
The previous Egyptian Warm Period was even toastier, comparable to the peak of the Holocene Climatic Optimum.
Crete also is not global temperatures.
Globally, the Egyptian and Minoan Warm Periods were close to peak heat of the HCO. But in any case, the Minoan was an advanced civilization flourishing under climatic conditions toastier than now.
No such reality.
No global reconstruction supports any portion of the Holocene being warmer than today.
The HCO, Egyptian, Minoan, Roman and Medieval Warm Periods were all globally balmier than the Modern WP so far. Grafting bogus instrumental “data” onto paleoproxies is scientific malpractice, ie fraud.
https://cp.copernicus.org/articles/18/2599/2022/
Reconstructing Holocene temperatures in time and space using paleoclimate data assimilation
EGU, 2022.
At least three 50-year intervals in the Medieval WP were warmer than any 50 years so far in the Modern WP, to include 1971 to 2020 and 1921-70.
No global reconstruction show temperatures warmer than the 21st century at any point in the quaternary.
Clearly, you look at only blatantly false reconstructions.
Clearly you think all the best reconstructions are blatantly false.
I don’t think that. I know.
Correction to the above – I said quaternary, but I meant holocene.
how do you know they’re “the best”?
The ones that exist and get replicated are more accurate than those that don’t.
Fascinating, in your opinion, reality is determined by a popular vote.
he has faith in “the science”
Repeating the same discredited claim over and over again, does not improve it’s quality.
whats your evidence for this nonsense Scott?
Funny, every global reconstruction that I have seen supports just that. Perhaps you are excluding any data that doesn’t support your conclusions again?
Cite these global reconstructions…
How many “global temperatures” do you think there are?
Hint: the answer is none.
Learn what average means.
Learn that averaging intensive properties (e.g. temperatures) is physically meaningless.
Thanks for the gibberish. Take a math class. Honestly.
Do you even know what intensive properties are? It’s apparent that you don’t.
Says the guy who quite clearly doesn’t know what the terms being used mean.
The ”average temperature” in winter where I live is said to be 17C.
But on average, it is 17C only once or twice over 90 days in winter. Just as often it is 12C or 19C. Therefore, average doesn’t really mean much at all.
Thanks for illustrating your ignorance. Suppose you average the test scores of a class and come up with the average grade in a class of 83%. That’s true even if no one scored an 83%. If you do this for multiple tests and see the average test score improves to 88% that’s also true even if no one scored an 88%. It tells you that on average student grades are improving.
So again if you know what average means and why we calculate it, your objection disappears.
As a believer in averages you must also believe in variance.
Tell about the variance in your example. Has it gotten larger? Smaller? Have the higher grades gotten better or worse? Have the low scores gotten worse to match the high scores?
Same with temperature averages. Why can the Sahara Desert have the same average as Kansas City, Kansas? What does that average mean when two dissimilar places with disparate temperatures can have the same average?
That’s funny, coming from a guy who clearly has no idea how averages are created.
Thanks for the gibberish and nonsense. Got anything truthful to say?
Everything I’ve said is truthful. Why are you so desperate to change the subject away from your many logical failures?
You appear to be assuming that there is a way to determine/calculate an “average” regarding ‘global temps’… when there IS NO WAY. Best to discard that assumption.
I don’t have to “assume” it’s possible to do what literally has been done. We have multiple GMST datasets that calculate GMST with an accuracy of ~0.05 C for recent decades.
You have no idea how stupid that quote of accuracy sounds to people who measure things for a living.
Tell us how you can get an accuracy figure that is at least ten time better than the measurements themselves. Do you even know what that computation is describing?
Learn the effect that taking more measurements has on random error. Please try to say something that can’t be refuted by what you should have learned in high school math class.
Ho, ho, ho! 🤡
Always someone who thinks random error cancels when measuring different things, with different devices, multiple times!
Tell you what dude tell us under what conditions measurements are taken in order to find a “true value” by canceling random error! While you are at it, define type A and type B uncertainties!
Nobody said that. Learn to read. Then maybe take a class on statistics. Just a thought….
Considering the fact that you clearly don’t know anything about taking measurements, perhaps you should try a little independent study.
That only works when you are taking more measurements using both the same sensor and the same target.
Using different sensors to measure different things does not improve your accuracy.
Perhaps if you’d gotten past high school math and science you would have known that.
Thanks for the BS ad hominem. Say something truthful.
Thanks for admitting you were dead wrong.
Good job changing the subject. Please try to figure out what you’re saying.
Perhaps if you actually read the point I was making you’d have a clue. Think for a second. Well, maybe for you it will take a bit longer. How many thermometers are there in the GHCN network? How many measurements do they take in a month? If you need some help, you can ask for it.
Do you know how ignorant you appear when telling folks you are smarter than anyone else?
I never said anything about my intelligence compared to anyone. Your reading problem continues.
There is no such thing as a global temperature. All we have are individual locations that get averaged together.
Funny how such a methodology is good enough for today, but is considered invalid for the past.
I guess that once again, validity is determined not by the quality of the data, but instead what the data is showing.
It’s funny how frequently contrarians feel like they need to deny statistics to support their counterfactual claims. Even Dr. Spencer finds this kind of nonsense embarrassing. See #9 here:
https://www.drroyspencer.com/2014/04/skeptical-arguments-that-dont-hold-water/
Let’s discuss Dr. Spencer’s post item by item.
In other words, scott once again cited something that did not support his illogical arguments.
Try to learn:
There is no argument against this that doesn’t prove the person making it ignorant and/or stupid.
What is the variance of that temperature? From Death Valley to Antarctica? You do realize a mean value of a distribution has no meaning without properly defining the distribution with at least a mean/variance!
Wow, so much ignorance combined with so much arrogance.
Perhaps if you could admit to yourself that you have no idea what you are talking about, you might finally be able to learn something.
BTW, you are getting further and further away from your original claim, which you still haven’t managed to defend.
Thanks for admitting you are not capable of skepticism.
🤡🤡🤡🤡🤡
Sorry dude, you have NO idea what you are talking about!
You define skepticism as blindly following what you tell us to believe?
Contratians? Is that the new denier?
I’m not denying statistics, I’m just pointing out how little you know of that science.
Yes you are. You’re denying “average.”
Tell us what you can assume from an average of correlated temperatures.
From GMST anomaly data, we can infer how much GMST has changed relative to a baseline. So for instance, we can know that GMST for 2010-2019 averaged about 1.1 C warmer than 1850-1900.
Actually you can’t. I doubt you have even read NIST TN1900 and certainly don’t understand it. That document indicates that uncertainty of the mean can be calculated using the variance in the data. That means that both the monthly average and the baseline average have a variance that can be calculated from the data used to make the averages. When two random variables, i.e., the monthly average and the baseline average are subtracted to obtain an anomaly, their variances add. No fiddling with dividing by √n or any other calculations. Simply add their variances. I have even added them using RSS and you still get a large variance whereby the anomalies are within the uncertainty interval. That means any value you obtain in the uncertainty interval is entirely meaningless. It would be just as likely as any other value inside that interval.
See the attached image. Most of the anomalies lie within the uncertainty interval.
I just did. So yes I can. What I said and did is just fine; it’s the same calculation you can find in IPCC reports and pretty much anyone with a clue. Heck, even the likes of Lindzen admit this.
The uncertainty intervals in your graph are made up. NASA estimates their uncertainty to be about 0.05 C for annual anomalies in recent decades gradually increasing to about 0.15 C for the late 19th century.
You just tried to refute a NIST (National Institue of Standards and Technology in the U.S.) recommended procedure dude. I suggest that you take up your argument with them.
You just keep displaying your ignorance of statistics. You are a simple troll.
BAHAHAHAHA!!! Learn to read.
You’ll not get anything further from me. You are an uneducated troll just fishing for comments.
That implies that at some point you actually gave me something, but aside from name calling and nonsense, you failed to do that. You’re making a wise decision to cut bait.
No I’m not, I’m denying that you know what “average” is, and how to calculate it.
Your words.
This means that you don’t know what an average is, and you don’t know the difference between a population mean and a sample mean.
Comment says:”Human civilization has never existed in a glacial period.”
I don’t know what you mean by civilization, but the 40,000 year old pictures in caves of southern France or the animal drawing in the Sahara would indicate that human civilization did in fact exist during a glacial period.
Civilization began with the rise of agriculture about 6000 years ago. Human civilization is adapted to the Holocene.
Göbekli Tepe has been dated back to 10,000 BCE:
https://www.worldhistory.org/G%C3%B6bekli_Tepe/#:~:text=Gobekli%20Tepe%20is%20the%20oldest,in%20English)%20is%20rightfully%20named.
If you start there it’s still the Holocene.
Considering they didn’t just start right out making structures out of giant stones, they would have had to build up to it. How long would that have taken?
The temple was built by hunter gatherers.
Architecture considers Temples as evidence for civilization. Therefore, civilization began at least 11,000ya in the middle east during the early Holocene warm period.
Please read. https://education.nationalgeographic.org/resource/key-components-civilization/
Agriculture predates civilization by thousands of years.
Civilization means, at a minimum, cities.
https://education.nationalgeographic.org/resource/key-components-civilization/
If cities are a requirement I can live with that. It does trivialize the successful survival of humans during glacial times by using “natural homes” like caves. They were successful for thousands of years.
The word “civilization” comes from the Latin for “city”.
Paleolithic and pre-pottery Neolithic people had settlements, whether cave-based or not, but nothing like cities.
That’s the etymological fallacy. The word for “nice” comes from the latin “nescire” which means to be ignorant. But only an ignorant person would think that to being “nice” is equivalent to being “ignorant” on the basis of the etymology of the “nice.”
Thousands upon thousands of individual studies support the claim that the Holocene was warmer than today.
It really is desperation time for the alarmists to try and proclaim that since 100% of the earth has not been measured, therefore we know nothing regarding the earth’s temperature during those periods.
Oddly enough, according to them, a few dozen recording stations are sufficient to determine the entire earth’s temperature to within a few hundredths of a degree back in the 1700’s.
You have cited precisely 0 studies showing that any portion of the holocene was warmer globally than the 21st century. Stop making stuff up and start supplying evidence for your claims please.
“warmer globally”… there you go ‘assuming’ again. There has NEVER been a way to gauge a ‘global temp.’
There you go saying it’s impossible to do what’s been done. Even Roy Spencer says your position here is an embarrassment to science.
Dr. Spencer never even addressed the fact that CO2 can not warm the oceans. Remember, the ocean is ~2/3rds of the earth. Why don’t you quote what the increase in the ocean temps have been over the last 150 years and then explain how CO2 caused the rise?
CO2 doesn’t warm the oceans, it warms the atmosphere.
The sun heats the oceans.
However the warmer atmosphere slows down the rate at which the energy that the sun puts into the oceans can escape.
In other words, a warmer atmosphere does not directly warm the oceans, however a warmer atmosphere does cause the oceans to warm.
Aside from the global networks of thermometers that measure temperatures, and the resulting data can be used to estimate GMST. Please learn what the word “assume” means.
The HCO was warmer than today everywhere proxies have been studied, ie Europe, Asia, Africa, Oceania, the Americas, Antarctica and all oceans. That looks global to me. Ditto the Egyptian, Minoan, Roman and Medieval WPs.
Arctic sea ice and treelines are good indicators. So are beetles and dinoflagellates.
The Antipodes:
https://www.sciencedirect.com/science/article/pii/S2666033422000144
“Afterwards, a period of time spaning ∼8200 to ∼5500 years ago temperatures were higher than today. We refer to it as the Holocene Hyspithermal.”
And within those periods SL was up to 2 meters higher. I guess Mr Simmons has not really studied the science.
Thanks for the BS. Let’s be clear about a few things:
When it comes to spewing BS, nobody can beat you.
Unless one accepts the nonsense that you are spewing, then everyone else is just an idiot.
Who cares what the science tells us, scott has an agenda to defend.
Get back to me when you figure out what an average is.
Willis, I’m a little confused by the timescale in Fig. 4.
Is 0 ‘thousands of years before present’ meant to be AD 1950 or AD0 or something else. This scale seems different to that used in the other graphs. Is there a reason for this? Or am I missing something?
All times are “BP”, which is years before 1950.
w.
Thanks, but I’m afraid I’m still confused. If the ‘0’ is at AD1950 it looks like there’s about 2000 years of data to the right of this in the trace. What is the year of the right hand end of the trace (in AD or whatever) or the the date of the youngest reading? I would have thought that 1950AD would have been further to the right than where the the ‘0’ is.
In other words should the scale on the x axis not be shifted to the right?
Sorry for my lack of clarity. I’ve taken the “BP” figures and subtracted them from 1950. So you’re correct, the labels are confusing.
Hope this clears it up.
w.
Thanks Willis,
So the ‘0’ on the scale is actually 0AD or whatever it’s called these days.
You are correct. Willis messed up the scale on Figure 4.
True. Fixed.
w.
Can we get you to fix the graph that mislabels Vostok temperatures as global temperatures now?
Considering all the things you have really messed up, Willis is doing pretty good by comparison.
Thanks for the nonsense, but Willis’ entire argument is based on the false assumption that you can say something about global temperatures from a single proxy in Antarctica. That’s a ridiculous assumption to make, and I think Willis knows this, which is why he won’t respond to the multiple points I made above.
The fact is that labeling the proxy temperatures from the Vostok ice core “global temperature” is dishonest. You’d think that the army of pseudoskeptics commenting on this post that deny that “global temperature” exists might actually object to Willis’ obvious error here, but oddly, you seem to prefer to blame me for calling out Willis’ blunder
I always love it when warmunists go out of their way to demonstrate how ignorant they are.
Is that really the line your handlers told you to push, or did you think it up all on your own.
If you knew a tiny fraction of what you have been told to know, you would already know that both the Greenland and Antarctic proxies don’t measure just the local temperature, they are measuring the temperature of where the water that formed the snow evaporated from, and that ends up being most of the planet.
You don’t know shit, and and don’t pretend you do. But oddly, you should be spewing your garbage at Willis, because he’s the one that thinks he knows GMST on the basis of a single ice core proxy.
Yep.
w.
The CAGW crowd is always prattling on about the impending tipping points that will doom humanity.
When I look at the Vostok ice core graph, I see LOTS of tipping points. They all look very nasty to me, because the steepest historical tipping points dump us into a freezing glacial stadial that would almost certainly kill several billion people.
The only tipping points to warming that I see are when the globe manages to escape the icy hellscape! Further, all of the past tipping points to the warming direction have brought the Earth CLOSER to idyllic temperatures.
I have no idea if we are close to tipping into a period of rapid, catastrophic heating, but such a mechanism is purely speculative with no basis whatsoever in the recent geologic history.
The “tipping points” alarmists miss the obvious conclusion to be drawn from studies that have established that atmospheric CO2 was 5 times higher during the Triassic period 250 million years ago, that it was quite a bit warmer, that dinosaurs survived, and that (unexpectedly!) Earth didn’t enter a death spiral of ever increasing warming and atmospheric CO2 levels. In other words, no tipping point even at 5 times current CO2 and much warmer.
As an example, this silly screed that draws all the wrong conclusions from all their wrong assumptions about CO2 supposedly being the main cause of warming, and missing the fundamentally important fact that there is no imminent “tipping point”.
https://www.sciencealert.com/if-co2-emissions-keep-up-earth-is-headed-back-to-the-triassic-period-or-worse
w says “Finally, it’s certainly possible that they are each affecting the other. CO2 might be adding a bit of warming or cooling to the changes of whatever’s driving the variations seen in Figure 2. Unfortunately, there’s no way to calculate that.“.

Well, I did a little bit on that, back in 2015:
I applied the IPCC’s estimated ECS (Equilibrium Climate Sensitivity) to the data, and calculated how much CO2 contributed to temperature, if the IPCC were correct. As you can see from the chart, not much – about one sixth. There are some caveats in the 2015 article, but basically, if the IPCC figure for ECS was too high then CO2 had less effect over the last 450,000 years, if the IPCC’s ECS was too low then CO2 had more effect, and if ECS is not the constant that the IPCC assumes it is, then all bets are off.
Good analysis.
There are multiple problems with what you did there, most notably:
Now, there are several very interesting things about this graphic. First, people keep saying that a slight global warming is an “existential crisis”. But in both of the previous interglacials, temperatures were up to 2°C warmer than today. That’s 3.6°C warmer than the “preindustrial temperature”, far above the impending terror temperature of 1.5°C warmer than preindustrial that they keep scaring us with.
There were modern humans around for both of those hot spells, along with most modern life forms. It wasn’t an “existential crisis”. It wasn’t a crisis at all. It was a warm time.
thats like saying getting rid of gasoline wouldnt be a problem because in previous interglatials we also had no gas.
the point it this. we built our cities near oceans, we rely on mass agriculture.
we adapt our civilization to the enviroment assuming tommorow would be like yesterday.
opps.
the argument is it will be a crisis because
not because humnans never experienced heat.
dont strawman, its beneath you
our ancestors surived massive disruptions
like the yellowstone caldera popping off, therefore a future explosion wont hurt anyone
You can’t even properly quote someone. Idiot.
Yes we know what the ”argument” is, thanks. Trouble is that ”it” is overblown hysterical nonsense and you can’t make a crisis from, or plan for, overblown hysterical nonsense, now can you?
Steven Mosher
Steve, I don’t “strawman” and never have. I’m an honest man. I tell the truth as best I know it.
How about you either stick to the science, or stick your ugly false accusations up the distal end of your esophagus?
Next, you say “the point it [sic] this. we built our cities near oceans, we rely on mass agriculture.”
True.
But as you quoted, I’m responding to the claim that a few degrees of warming is an “existential crisis”. This means it threatens, not a few cities, but our very existence. I think that’s nonsense.
In addition. if you think “mass agriculture” will die from a few degrees warming, you’ve either never lived on a farm or a ranch, or you slept through it.
And yes, our cities are near oceans. The globe has warmed about 3°C since the depth of the Little Ice Age around 1700AD, at which time … wait for it … our cities were near the oceans. Good thing you didn’t live then, you’d be terrifying everyone by telling them that their cities were going to be underwater in 300 years …
Now, you’re free to claim that an additional couple of degrees of warming will end civilization as we know it, or whatever you’re trying to say.
And I’m free to point and laugh at you for your foolishness.
I live a bit north of San Francisco. If I move south 170 miles (270 km) I’d be half-way to LA … and the average temperature would be ~ 2°C warmer.
According to you, if mass agriculture exists north of SF, it couldn’t exist 170 miles south of here because it’s a couple of degrees warmer …
Here’s the effect of the recent warming on “mass agriculture” … please point to the crisis.
w.
I don’t believe that for a second. Proxies support the LIA was around 1.2ºC colder than the Holocene Climate Optimum, and glaciers and trees say we are colder than the Holocene Climate Optimum. So most likely the globe has warmed something like 0.8-1.0ºC since the depth of the Little Ice Age.
We are just cheating at solitaire with our temperature measurements. They have nothing to do with what nature feels as temperature changes and reflects in proxies.
The Arctic and North Temperate Zone might have warmed 3 degrees C since AD 1740, annual average of 6.86 °C, coldest year in the CET, vs. a probably bogus 11.15 °C in 2022, but the globe, probably not.
‘a future explosion wont hurt anyone’
Even if they are sitting in the middle of the Yellowstone caldera?
“our ancestors surived massive disruptions
like the yellowstone caldera popping off, therefore a future explosion wont hurt anyone”
Talk about a strawman…
If I remember the numbers correctly, it is thought that around 50,000 years ago, a major volcanic eruption somewhere around what is now Indonesia, resulted in a climate disruption that dropped the total human population down to only a few hundred individuals.
Yes, we survived that “disruption”, but the next time we might not be so lucky.
https://en.wikipedia.org/wiki/Toba_catastrophe_theory
The hypothesis is eruption of Toba on Sumatra about 74 Ka created a genetic bottleneck, with just 1000 to 10,000 breeding pairs of humans surviving.
The wiki on the genetic bottleneck from the given reference goes on to say
“However, subsequent research, especially in the 2010s, appeared to refute both the climate argument and the genetic argument. Recent research shows the extent of climate change was much smaller than believed by proponents of the theory.”
Even on the face of it, arguing an event 74k years ago causing a genetic bottleneck which resolved 50k years ago is ridiculous.
I’ve never subscribed to the hypothesis.
Willis,
What is the chance that you will pick up where you left off 7 years ago at https://wattsupwiththat.com/2016/07/25/precipitable-water/
Particularly re your comment “This leads us to a curious position where we have had a larger change in forcing from water vapor since 1988 than from all the other IPCC-listed forcings since 1750 … so where is the corresponding warming?”
The world has cooled since February 2016.
Willis said:
Another thing that can be calculated from the isotopes in the air trapped in the ice-core bubbles are the temperatures back in the day.
I tried to download that data at the site in the Vostok figure, but I get an error. Anyway, I’m pretty sure that the temperature data is not based on trapped air. Instead, it is almost certainly based on the isotopic composition of the ice itself. Measuring delta-D or delta-O on ice or water is a pretty straightforward affair. Measuring gas compositions from now collapsed air bubbles is a bit trickier. I used to measure gas concentrations isotope ratios from He, Ne, Ar, Kr, and Xe in ice samples, which is trickier still.
The isotopic composition of water at a given site is dependent on many things, including the temperature at the site, the source of the precipitation, and the distance that the water traveled to be deposited as snow. With a lot of continental glaciation, you can get a shift in “SMOW”, or standard mean ocean water.
Delta-18O has been interpreted as an indicator of global temperature from ice cores, but there is some debate as to how much of this this is truly global temperature, or shifts in water isotopic systematics. I remember that estimates of tropical continental T decline during the last glacial maximum was about 5K cooler than the present interglacial, based on the solubility of noble gases in groundwater.
Chris,
Here’s the link to the Vostok temperature data that Willis plotted. The temperature is derived from the deuterium content of the ice. It is not from the air trapped in the ice bubbles.
https://cdiac.ess-dive.lbl.gov/ftp/trends/temp/vostok/vostok.1999.temp.dat
I’m pretty sceptical about ice cores reflecting warmer temperatures accurately. Localised melting events are utterly gone from the ice core record and how could they possibly know?
Correlating to another proxy? Do the ice core records ever have periods where they say the core doesn’t represent the record between year X and year Y because we believe it was melted? I’ve never seen anything like that.