One of the recent symbols of climate change was the April 12, 2022 US Drought Monitor map shown below. As it turns out, one year later, the April 11, 2023 US Drought Monitor map proves that what alarmists were calling Extreme Climate Change in the US, was in fact, simply weather.
Here are two images from the US Drought Monitor with an image compare slider showing conditions in the US last year and a week ago.


Image source: https://droughtmonitor.unl.edu/Maps/ComparisonSlider.aspx
The U.S. Drought Monitor is produced through a partnership between the National Drought Mitigation Center at the University of Nebraska-Lincoln, the United States Department of Agriculture, and the National Oceanic and Atmospheric Administration.
HT/Malon
It may fall a bit more next week as Kansas got lots of rain. Fields are filled with puddles.
Not in SE Kansas – still dry as a bone
I just read, coffee will become more expensive because of “extreme climate”. 😀 😀
And if that were not the excuse to raise prices, there’s always something else to blame it on. As was proclaimed a long time ago, in a skit on SNL, “there’s always something else”. Rosanna was right.
Sort of true. Frost in Brazil damaged its crop. Fewer Arabica beans means more expensive arabica coffee. Cold, not warm, the problem.
Cold was the problem….. and the frost did hurt the Brazilian crop. Cold happens in normal short term and long term weather cycles….like the big spring freezes of Frances grape crops that happen every 4-5 decades. Global cooling is not cause!. But what about all the other many coffee growing regions in the world. Brazil is a drop in the bucket. Also Robusta Coffee was mostly transitioned out for Arabica in the 1990’s. I like Robusta coffee when I can find it in blends… it’s cheaper and I like it.
The big issue is climate propagandized price gouging.
Climate, Extreme weather and Pandemic supply chain….. have become convenient excuses for price gouging…. way too much of that us happening now.
Corporations are trying to cash in on the Climate emergency bandwagon while they still can.
They know Biden or politicians will never put the cabosh on them; it helps to propel the Climate Anxiety Frenzy
And why do we need to wait for our Government to do something about price gouging. The only way to make it stop right now is to vote with our dollars.
The frosts in Florida a year or two ago caused sugar prices to rise…but they have risen far higher than they should have. Again the suger industry blamed extreme weather.
Right now there is a bit of a glut of honey….I can buy it at second sales warehouses at 1/3 the cost so why buy sugar at top price now.
I buy coffee at a discount second sales warehouse. The “good by” date is expired but $2.50 for a pound of good coffee…. even Starbucks… is a deal. The way to get by the freshness quality issue is to buy whole bean and grind it fresh….. almost no difference in quality.
This 12-month animated PDSI map from NOAA is pretty good too.
https://www.ncei.noaa.gov/access/monitoring/historical-palmers/
Thanks, David, for the link to the animation.
Regards,
Bob
There is always some drought and flood story somewhere on the planet. Just rotate the camera crew.
Global rice shortage is set to be the biggest in 20 years (cnbc.com)
I don’t think the drought time is over yet.
There is severe drought now on the pampas in ARG.
Revisiting the 87-year Gleissberg solar cycle | Bread on the water
In March 2018 it was predicted that Cape Town would run out of water. It is now going into the 6th winter rainfall season since then with dams at 57.9%. I predict that this alarm will prove to be totally flawed for another year. California does not have a rainfall/snow problem – it has a problem with proper storage of the water when it is plentiful. The same applies in many other parts of the world. Instead of trying to engineer the perfect climate in the 30 climate zones and sub-zones we should store up the water in the wet years and use it sparingly in the dry years. This will cost considerably less than foolish attempts at climate engineering and achieving net-zero.
There is even less drought than the latest depiction, because the drought level contains the formula “Future Predicted Evaporative Index”. This index presumes much higher ambiental temperatures, strong dry winds, and more funding for Climate Change Studies. Follow the money. All of that snow out west is going to melt, wait for the next flood events.
So basically the drought depiction is not current state but a projection?
Can you post a link with information on USDM’s use of “Future Predicted Evaporative Index” for the map posted in this article?
Google broken for you again?
I don’t remember Google being broken for me before and I don’t think it is now. But, I am willing to give Ron Long the benefit of the doubt. Of course, if you have the scoop I’m willing to hear you out as well.
Except for the water that flows merrily into the ocean because building dams is environmentally unfriendly. Or something.
https://psl.noaa.gov/eddi/#current_conditions
There is no “Future” in the title but they project 1 day up to 12 months depending on specific conditions being present
That’s EDDI. According to the USDM about page EDDI is not an input. And the also say that their product is not a forecast and that it only looks backward.
Ironically, more California water also means more wildfire this year because there will be more dried out brush fuel in late summer.
Drought means more wildfire last year. Wet means more wildfire this year. Nevermind the California forestry mismanagement in both years (thinning, logging barkbeatle killed trees, forestry road access,…).
California has two fire seasons. They can happen in any year. Cal Fire always warns about them every year. The first is that drought will make every bit of tinder more flammable increasing fire danger. The second is rain caused more tinder to grow than previously available, increasing fire danger.
Fire danger always increases every year in California according to Cal Fire.
don’t forget California water mismanagement, capital investment mismanagement (a no-speed train to nowhere), agricultural mismanagement, infrastructure mismanagement, public health mismanagement, and wild life mismanagement. Good thing the incompetents are regularly voted out of office…oh, wait…
The Western Cape and Cape Town have the same climate as California (Mediterranean winter rainfall). They also have problems with fire in the hot dry summers. Some years ago they began to remove the non indigenous invasive trees (alien invaders) and this has been a great help. Fires with this vegetation are far more destructive but fire in the indigenous vegetation is beneficial. It has also provided jobs for poor unemployed people prepared to do hard work removing the unwanted vegetation. California could learn a lesson or two from the Cape.
If we spent less time trying to mitigate weather extremes and more time learning to cope with them we’d be safer, less stressed, and happier.
And a whole lot richer.
Is there an opposite of the Drought Index – a Waterlog Index?
Fortunately, we have a written history extant thousands of years old that clearly demonstrates drought always ends in rain and returns when rain stops.
The post modern mind is highly disturbed by weather….. we get worried, angry and determined by weather because it makes null our belief that modern civilization should control everything. Meanwhile, the rest of us are worried while slicing and dicing the weather/ climate looking for someone to blame or a reason to initiate some grandiose solution. Other’s with smart tools are looking for ways to leverage these facts. LOL.
A parable
A scientist walked up to a tree. The tree was not like anything else ever seen before. So the scientist decided to make his life work studying the nature of the anomalous tree. Twenty years later, the scientist had tested all his hypothesis about the tree and wrote a paper on the evolution of tree bark. He was awarded grants and accolades . A press conference was scheduled to happen in the field tree side.. The day before the conference, the scientist went into the field with a hoard of local people but the tree was nowhere to be found. The local people became nervous by the sound of deep rumbling fearing a stampede of elephants. The scientist looked up as he was about to be trampled …. exclaiming Eureka….There are hundreds of my special trees. The scientist died never discovering the legs of elephants were not trees.
This is even more striking if you understand how the map works.
https://droughtmonitor.unl.edu/
The Dark Brown (exceptional drought) is the top 2 percentiles for each location.
Red (extreme drought) is the next 3 percentiles.
Leather (severe drought) is the next 5 percentiles.
Tan (moderate drought) is the next 10 percentiles.
Yellow (abnormally dry) is the next 10 percentiles.
For locations labeled short and long term (SL) the color is the max of the short and long ratings.
Thus, it’s hard to know both of the ratings for the locations labeled SL. One will be the color displayed and the other will often be yellow.
The one thing that you can deduce is the 30% of the map should be “colored” for short and 30% for long. Right now about 30% is colored for long but only <20% short.
And a new one’ll come out tomorrow should further reductions. (They publish every Thursday.)
Since 2017 the ENSO has been toggling Neutral toward El Nino back to Neutral to La Nina to Neutral and now to El Nino. But since 2017 or so, there have been unusually long stretches of Neutral with slight toggling warm and cool…especially during the SM of the 24th cycle. The summers of 2017-2021 were unusually wet and cool and some dark in PA… not great for my garden. The summer of 2018 or 2019 was dark during the minimum with a several big several earth facing CMEs…. bad gardening years in SE PA. Also, Cosmic radiation was at it’s high those years…. making matters worse with rain…..and the upper atmosphere had cooled dramatically…..(seems like cold upper atmosphere would increase convection and intensify storms …but I don’t know just guessing.
My question. Is there a relationship to Solar Minimum/Maximum with the ENSO and is there a relationship between the two with western draught and flooding rain. Can someone point me to a decent paper or data.
Per my loose recollection of Finger lakes wine vintages (my dad was a grower there)…. an argument can be made that the best vintages happen during Max solar years but never during Minimum years and vice versa.
Recommend Dr. Roy Spencer’s post from August 2022 regarding rainfall in the Colorado basin and drought: (part 2) https://www.drroyspencer.com/2022/08/lake-mead-low-water-levels-part-2-colorado-river-inflow-variations-and-trend/
IMO Drought claims in most of the West in 2022 were overblown, and led to an endless series of government-supported news stories proclaiming that the North and Central California valley (an entirely different watershed) drought was caused by Colorado rainfall shortages rather than mismanagement of California water resources by the California Water Resources Control Board. Colorado lakes Mead and Powell were instead being overdrawn to support “renewable” electrical energy production for California at Federally subsidized bargain rates per MWh (perhaps hyperbolically leading in turn to the crooked bookkeeping showing renewable energy was cheaper than ever).
California, it should be noted, is pushing an initiative to make electrical energy bills a rate regressive tax, based on income. Everyone in the same income bracket will pay the same flat rate, whether they use it or not.
Colorado basin snowpack is looking good, and even still building now in April. Yet without Federal intervention, California will still draw down water reservoirs better used for agriculture and drinking, in order to pump up its green image and float its failed solar and wind power con game for another year.
Perhaps all “renewables” should go at the same price, rather than inflated price supports for wind and solar? Or sInce stored water is actually more valuable and usable for more purposes than yesterday’s wind or daylight, hydroelectric should cost more per MWH than other renewables? It ain’t gonna happen, but it might be a way to go after the crash.
Climate is defined as 30 years of weather in a given area. In order for the climate to change, the weather must change first and for 30 years. People who claim the climate can change weather have it exactly backwards. There is cause and effect in the real world. Those who can observe that are called scientists. Those that cannot are called fools.
when/where/by who did the 30 yr defn come about?
does this confuse the paleo-climatologists?
same question for drought defn?
Don’t care. If that is the agreed upon standard definition, then that’s what needs to be used to compare results. You can’t just pick and choose definitions to suit your mood on particular days.
30 years of a location’s average weather=location climate is the definition used by NOAA and WMO. Why 30 years? Because they said so.
So officially to observe any climate change, one has to wait 30 years. Well, in the past 40+years since the climate change/AGW worries began, climate in most locations hasn’t changed much. UK mostly wet, still sees snow. California still goes from dry to wet, same as Australia. Arctic still freezes solid in winter and thaws some in summer. Atlantic still has hurricanes—some years more than others. Tornado alley still has tornadoes every spring.
Yet Mauna Loa shows CO2 ppm rising every year. Hasn’t made much of a real climate difference except in climate models with nonexistant double ITCZ, nonexistant tropical troposphere hotspot, and several other demonstrable BIG model/reality problems.
Notice how people who have carefully observed the weather patterns for thousands of years and farmed accordingly have been the most successful and been able to do this without government control and support. A nanny state wants to keep its citizens in diapers.
Three agencies to prepare the drought monitor? It’s like current movies, with many multiple production companies.
The Palmer Drought Index looks quite a bit different than the above map:
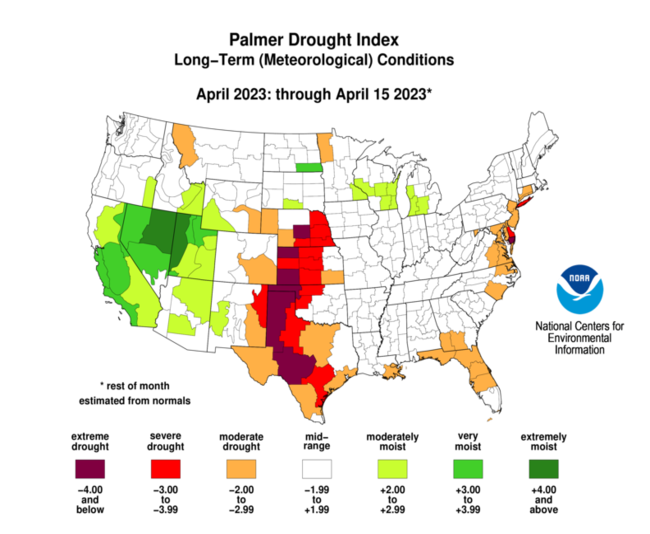
I’m in an area shown on the map presented in the article as D1, when we have above average precipitation since the beginning of the water year October 1st. All the nearby watersheds for the upper Colorado River basin have snowpacks at 140-200% of normal.
Hopefully, the ENSO slides from Neutral to El Nino in time to quell any anxious yap about a coming “extreme” dust bowel in the former dust bowls states!
JC.
You have it wrong. Higher (El Nino) temperatures will increase the possibility of a return to dust bowl conditions.
Are you sure?
Take a look at the ENSO widget in this blog and pull all they way down. You will see the prevailing weather patterns for La Nina and El Nino. The El Nino pattern is cool an wet for at least the Southern Half of the Dust Bowel region and normal precipitation and temperature for the Northern Half. The La Nina typically, has a pattern of warm and dry weather for the dust bowel region.
These are typical patterns…. not locked in stone predictions. Obviously weather is more than temperature, the ENSO impacts the jet streams and the flow of moisture.
The La Nina and El Nino patterns are provided by NOAA.
And all bets are off if the ENSO remains in it’s current Neutral postion.
JC:
The weather of the 1930’s, as you know, was hot and dry, as is the norm when El Nino episodes occur. If an El Nino arrives, it increases the chance of a return to Dust Bowl conditions, probably won’t happen, but the chance of its arrival its should not quell any anxieties.
A lot of trees have been planted in Dust Bowl States since the 1930’s.
So NOAA’s prevailing weather patters for El Nina and La Nina are completely wrong? The strongest El Nino events 1957-58, 1965-66, 1972-73, 1982-83 and 1997-98 during winter. There were no major El Nino events in the 1930’s.
Droughts and bad soil management don’t neatly line up historically with El Nino’s.
It is a wild guess to think the next El Nino will split the jet streams just right to facilitate significant draught in the dust bowel states. The current draught is likely due to recent Neutral ENSO and La Nina…. but I can be sure.
Natural variation?
Did any of the shorter term climate models predict this?