By Anthony Watts and Sterling Burnett
From the “bad science”, and even worse “bad science journalism” department comes this tale of a story and a study that should probably be retracted. When I first read the story, and then the study at BAMS, I thought surely this must be an elaborate April Fools joke. Sadly, no. -Anthony
It appears Associated Press science writer Seth Borenstein has “hit one out to the park”, unfortunately for him, it’s a foul ball. In a recent story that got wide pickup by multiple media outlets, Borenstein made this claim:
Climate change is making major league sluggers into even hotter hitters, sending an extra 50 or so home runs a year over the fences, a new study found.
Hotter, thinner air that allows balls to fly farther contributed a tiny bit to a surge in home runs since 2010, according to a statistical analysis by Dartmouth College scientists published in Friday’s Bulletin of the American Meteorological Society. They analyzed 100,000 major league games and more than 200,000 balls put into play in the last few years along with weather conditions, stadiums and other factors.
“Global warming is juicing home runs in Major League Baseball,” said study co-author Justin Mankin, a Dartmouth climate scientist.
It’s basic physics.
“Basic physics” or not, the claim is unverifiable. While many could see extra home runs as clear benefit of climate change, the premise of the study, published in the Bulletin of the American Meteorological Society, is the science equivalent of a swing and a miss. The reason is that the study assumed that increased temperature (due to climate change) would decrease air density, and therefore allow baseballs to fly faster and further due to less air resistance. The study provides this graph as proof, seen in Figure 1.

The study compared baseball and select weather data back to 1962. There has been a substantial increase in home runs over the time period studied, but correlation is not causation, and study authors failed to examine a myriad of other factors that are far more likely to be responsible for the increase in home runs, than the small increase in field air temperatures and the decrease in air density.
Among the study’s weaknesses are first, they assume that the modest increase in field temperature, is entirely due to anthropogenic greenhouse gas emissions. This ignores other factors that influence temperatures, like the urban heat island effect, nature’s own contribution, and the fatally flawed siting of surface stations measuring temperatures.
Second, they think they can tease out approximately 50 home runs per year, about 1 percent of the home run increase, using counterfactual computer model simulations of what they think temperatures would have been absent human greenhouse gas emissions. As Climate Realism has pointed out repeatedly, the computer model temperature simulations are critically flawed. Attributing a one percent share of a much larger increase in home runs to climate change based on counterfactual computer model simulations is an endeavor fraught with uncertainty.
The study is a textbook case of correlation is not causation, with a dose of confirmation bias added in. A visual correlation between variables, such as temperature, air density, and home runs, does not automatically mean that the change in one variable is the cause of the change in the values of the other variable. Without looking at other factors, the “climate change equals more home runs” theory becomes just like the infamous Ice Cream vs. Shark Attacks graph that is used to instruct students on how not to compare data. See Figure 2 from Simple Psychology’s website.

While variables like temperature and air density correlated because a change in temperature does in fact change air density, the scientists failed to examine several other other factors, called confounding variables, which are far more likely to be responsible for the increase in home runs.
Some examples would include better and newer baseball stadiums which reduce wind on the field, and thus limiting the number of long fly balls blown foul. Some newer stadiums also have retractable roofs, which keep out weather which may not only affect the ball, but the mood and confidence of the hitter.
In fact, an analysis of baseball statistics, done by The Bleacher Report found some stadiums have consistently higher number of hits and home runs, and these facts stand on their own without climate change being figured in at all.
Since the study claiming climate change made more home runs only went back to 1962, they ensured that the data was mostly about newer baseball parks, with the improvements for weather and wind mitigation built in. This exclusion of pre-1962 baseball and weather data (the game goes back to the late 18th century) essentially becomes an exercise in cherry picking data that supports the present era of climate change while ignoring other hot weather events in the United States.
For example, during the “dust bowl years” of the United States from 1930-1936, weather patterns brought some of the hottest summers on record to the United States, especially across the Plains, Upper Midwest and Great Lake States. High temperatures then during those summers were even warmer than today, as seen in Figure 3:

With those dust bowl era hot and dry conditions, air density would have been lower, and thus, if the premise of warmer climate equals more home runs were true, we’d expect to see a big spike in home runs during that time.
But, the data compiled on both the National and American Leagues home runs says clearly there wasn’t any spike, meaning climate change as a causal factor driving home run totals strikes out. Other confounding factors must be at work, and baseball aficionados are well aware of and have bemoaned them.
The home run increase has coincided with number of changes in the game that are far more likely to account for the increase in home runs than a modest, approximately 1℃ increase in temperature.
First, the upward trend in home runs began in 1977, when the major league baseball expanded by two teams, two more teams were added in 1993, including the Colorado Rockies, who play in a stadium more than a mile above sea level where air pressure is naturally less dense. Two more teams were added in 1998. With more teams one would expect an increase in home runs. The Dartmouth team may have accounted for this factor, but what they may not have considered is how each additional team added dilutes the pitching pool. Younger, less experienced pitchers are called up from the minor leagues, or drafted out of college and even high schools, and added to major league rotations sooner with less training or experience than is usual, facing batting talent the likes of which they’ve never faced before. In addition, to round out pitching staffs, older pitchers, some past their prime, are kept on rosters.
In addition, most MLB ballparks have been replaced within the study period, with only a few older stadiums remaining, such as Fenway Park and Wrigley Field. Critical to an analysis of home run data is the fact that almost every new ballpark has smaller field dimensions than the ballparks they have replaced. Some new parks have center fields that are 20 to 40 feet less deep than the teams’ previous fields of play. A number of the new ball parks had lower outfield fences or have since construction, shortened the existing outfield fences. Adjustments, even in new ballparks, continue to this day. Shorter distances to the outfield wall and lower fences allow what would have been previously routine fly balls or doubles off the wall to become home runs now.
Plus, it is no secret that all MLB teams now have hitting coaches, who use science to improve the swing and delivery of batters. In fact, the Los Angeles Dodgers has an online “hands-on Science, Technology, Engineering and Mathematics (STEM) curriculum and programming to elementary and middle school teachers and students in Los Angeles” to provide up and coming players with the same science the MLB uses to improve hitting scores. Also during the study period, analytics has been used to monitor and encourage higher “launch angles.” Home run hitting is glamorized and emphasized by teams, and emphasis on a high batting average is downplayed. The result has been clear, lower team batting averages, more strikeouts, and more home runs. That is the general trend.
Also, during the study period, baseball went through what has been referred to as the steroid era when “multiple” records were set and balls were flying out of ballparks left and right. Research indicates that steroid use likely began in the mid-1980s, coincident with the initial rise in home run numbers and had permeated the game by 1994. The years 1994 through 2004 are typically thought of as the “Steroid Era.” The year 1998 saw a tremendous number of home runs and records broken tied to steroid use.
Evidence for the impact of steroids on home run totals is even found in Figure 1 provided in the Bulletin of the American Meteorological Society study. Home run totals peaked in the early 2000s as rumors and investigations of steroid use began to take hold in baseball, only to fall precipitously around 2003 for nearly a decade as new testing regimes and penalties were implemented. During that decade, even as home run numbers fell, temperatures continued their modest upward trajectory and air pressure its decline – in order words, home run trends then do not correlate with temperatures and air pressure, supposedly the climate drivers of home run totals.
In this combined/overlaid and expanded for improved readability graphic from the original study (Figure 1, panels A and B), temperature and home runs shown are shown together in Figure 4. It is very easy to see the impact of steroids on home run totals starting in the late 1990s and ending in 2003. Figure 4 also clearly shows that from about 2009 to 2018, the correlation between temperature and home runs goes completely out of phase, with no correlation at all.

Clearly, many factors are at play in home run hitting trends in baseball. The study’s authors and the Associated Press seem oblivious to other factors when they attributed increasing home run totals to climate change, while ignoring or downplaying other factors which arguably have a more direct causal impact. Consider this just one more irresponsible climate scare story—if one considers a modest climate induced 1 percent increase in home runs, scary, or even noteworthy—debunked.
One wonders if taxpayer funded government grants helped fund this groundbreaking “research.”
Originally published at Climate Realism.
Addition: Climatologist Dr. Roger Pielke, Jr., weighs in on the study, here. (h/t to Meteorologist Mike Smith who writes his own decisive takedown of the bad science in Global Warming Silly, Err, Baseball Season. Mike finds not just missing figures, but contradictions in the paper.)
Dr. Pielke writes:
I commented that climate change didn’t have the same HR-boosting effects in other baseball leagues, with no similar home run trends in Japan, the AAA league or the NCAA — where in each instance home runs have declined in recent decades…
A lesson here is that we have created strong incentives in science, in the promotion of science and in journalism to reduce everything to climate…
These incentives help us to understand what gets published, promoted and clicked. These incentives are also incredibly distorting to both journalism and, increasingly, to research. Baseball and climate might seem like a silly topic, but these dynamics can be found on far more important issues involving climate.
A brief reprise of a previous takedown comment on a previous post about this ridiculous but widely cited paper.
An obvious place to look for the cause of any change in baseball statistics would be to look for any major baseball rule changes. Bye Golly, look at that, pitchers now have only 15 seconds to deliver a pitch and batter have only 8 seconds to get ready. Maybe that is more important than a 0.1 degree change over the last 40 years.
My favorite irrelevant correlation chart is the one between autism diagnoses and the sale of organic food.
Anyone using RCP8.5 should have a “caution:climate porn” disclaimer on the study.
Perfectly describes how Borenstein articles should be handled. “Caution: Climate Porn” ‘and fake news’ posted right above the headline.
Another catastrophic tipping point here. Lemme ‘splain.
Baseball fans love to see “dingers”. That’s why they go to games. To watch home runs!
So because there are more home runs the probability of more fans filling the seats at stadiums increases. The more fans there are the more hot dogs and beer are consumed. So we now have more methane produced from the hot dogged animals plus more CO2 being discharged from the consumption of beer.
I’m sure the folks at Dartmouth are way ahead of me on this one and probably have this already in a poster somewhere waiting to ‘splain it to the warmists!
Who approves this kind of study? Someone had to sign an approval for the grant or what ever other method was used to pay for the research. We need to go after the people who authorize our money to be wasted on poorly done crap like this. I want my money back.
One might hypothesize that warming leads to trans athletes drinking more Bud Light. Maybe not.
There’s a correlation with $5 billion being wiped off of AB stock…
If it were true it would just be yet another example of why global warming is a good thing.
Are you absolutely, positively certain about that?
TENTHS of a degree!?! Over decades? HA! The warmunists think that TENTHS of a degree could make BIG differences in things, most everything in their demented minds. In baseball even? HA HA HA No frogging way!
Apparently all of the media “critics” have fallen in love with the new movie, “How to blow up a pipeline”, praising both the acting and the political message.
https://www.foxnews.com/media/media-praise-eco-terrorist-film-blow-pipeline-rational-desperate-pragmatism
Story tip.
Yeah, that ought to make the crazies come out of the woodwork.
Incitement to violence is what the radical Left does. It’s their stock in trade.
Clearly climate change is also responsible for the increase in goals in the NHL. This year there are one 64 goal scorer, one 60 goal scorer, two 50+ goal scorers and one more with 49 goals with one game to go.
Oh wait, they play inside in a climate controlled environment.
I think this study has great value in proving Global Warming.
I mean, there were no home runs hit in Yamal. Just hockey goals. 😎
I scanned the comments on the Washington Post story about this study and there were posters lamenting how ‘deniers’ will use this bad piece of work to discredit all good climate change studies. A variation of the REPUBLICANS POUNCE narrative.
There are no good climate change stories. If they are good stories to the alarmists, then that means they are scary and bad and meant to scare the rest of us. Alarmists think taking away their ability to scare us, like putting out an obviously ridiculous story (after reading its debunking here at WUWT) like Baseball Homeruns = CO2, is bad for their narrative, and they are correct. So now they are whining that this story hurts their ability to scare the public. Again, they are correct. That’s a good thing. 🙂
Also…
In 1969 the pitcher’s mound was lowered by 5” ( from 15” to 10”) specifically to disadvantage the pitcher compared with the batter. Hitting % immediately began to rise that year and continued to gradually rise for the next two decades. Of course stadia were being rebuilt to control wind and fence’s shortened during the same period. The designated hitter was enacted in the American League.
If these scientists weren’t lazy, they would have correlated day by day home runs per innings played against temperatures.
Another thing: there was also a trend toward night games. It is cooler during evening games. So how does the home run rate correlate? Confounding variable: lighting quite different are night. Does the batter do better or worse in the flat multisourced artificial light?
“If these scientists weren’t lazy…”
Which scientists?
They are anything but lazy.
Incompetent, deluded, fraudulent, abominable, and highly industrious at pumping out whatever they think can be used to support the cause.
No, no, no. The weaker than average solar cycle from 2010 till now is clearly the cause. The weaker cycle caused more cosmic rays to penetrate deeper into the atmosphere and excite rubber molecules in the cores of baseballs. This caused the baseballs to accelerate an extra 2.1 mph. Resulting in the excess round trippers.
The science is settled.
Narry one mention of viscosity.
As air heats, the viscosity increases because of the increased vibration of the molecules – the same thing that decreases density for a given pressure.
For example, the dynamic viscosity at 25 C is 18.37 N s/m^2 x 10^-6
At 30 C it is 18.60 N s/m^2 x 10^-6, an increase of 1.25%
There is a calculator for this here:
https://www.engineeringtoolbox.com/air-absolute-kinematic-viscosity-d_601.html
Meanwhile the density of air is 1.184 at 25 C and 1.164 at 30 C, a drop of 1.69%.
Given the Reynolds number for a well struck baseball is in the millions, we know the ball is flying with turbulent flow.
Just correcting the figure of those HRs for viscosity, it explains away at 37 of the 50.
I was once a final year project supervisor for engineering students at Dartmouth (Thayer School of Engineering). It seems the engineering curriculum has slipped a little. When it comes to baseballs they should be better rounded.
As I’ve said before and continue to say it: the climate alarmists will never pass up the opportunity to attribute an event—any event—to climate change. This is the main reason they usually lack credibility.
No where in this study was a “Time of Observation” correction made. Night ball games have increased during the study years. Nighttime air density is vastly different than daytime air density as any airline pilot will tell you.
So if global temperatures need to be corrected for time of observation in order to pass muster, then ballgame homerun results based on temperature need to as well.
Thank you for that, doonman. Good ol’ TOBS. Good thing I wasn’t sipping a beverage.
If you read the paper that is discussed in detail.
“With those dust bowl era hot and dry conditions, air density would have been lower,”
Yes, hot conditions would decrease air density, but on the other hand, dry conditions would increase the density, with the relatively low mass water molecules in lower concentration. But wait…that would increase the relative concentration of carbon dioxide, one of the more massive molecules in the air! Aha, our culprit is revealed! (sarc)
Agreed, except that atmospheric CO2 concentration is customarily specified as dry molar fraction. The “dry” part means water vapor is removed before analysis, and the “molar fraction” means that it is a volume ratio (µmol/mol or ppmv), rather than a mass ratio (ppmm).
I suspect that rising CO2 levels have already increased the number of home runs hit in baseball, at all levels — but mostly because of the effect on players, not because of the effect on air density.
To judge the effect of air density on baseball flight, consider Denver’s Mile High Stadium. It is nearly 5000 feet higher than the median for American MLB stadiums. According to this book, the thin air at 1 mile altitude adds about 10% distance to long balls there.
So, how does that extra 5000 feet of altitude compare to temperature changes in its effect on air density?
That’s a question for an airplane pilot. (I’m not a pilot, but I like Juan Browne’s blancolirio channel. 😉 ) Aircraft pilots know about a concept called “density altitude,” which the FAA defines as “pressure altitude corrected for nonstandard temperature variations.” A rule of thumb is that a 10°F increase in temperature is similar in its effect on air density to a 600 foot increase in altitude:
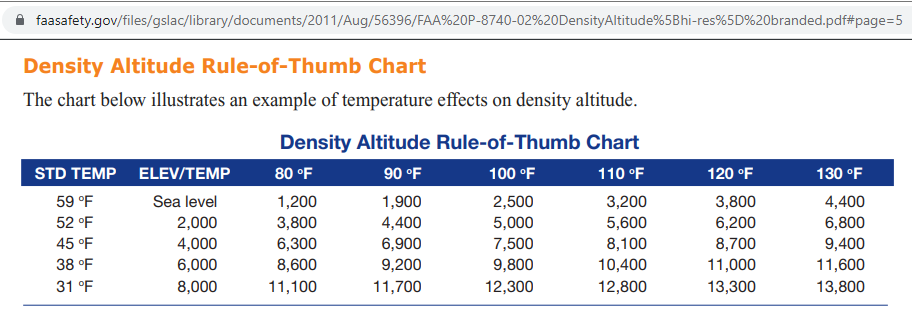
So if a 5000 foot elevation increase (at Mile High Stadium) adds10% to home run distance, then a 1°C temperature increase should add (1.8/10)×(600/5000)×10% = 0.216% to distance traveled, which is about ten inches.
The paper says that “A 1-°C increase in the daily high temperature on the day of a baseball game played in a stadium without a dome increases the number of home runs in that game by 1.96% (95% confidence interval [CI]: 1.5 – 2.4).”
It does seem plausible to me that a 0.2% increase in long ball distance could produce a 2% increase in the number of home runs. However, even if it does, that doesn’t seem to me to be adequate cause to justify “a rollback of the industrial age.”
OTOH, rising CO2 levels have increased global agricultural productivity by roughly 20%, and reduced drought impacts by making crops more water-efficient and drought-resilient, both of which have contributed to a drastic reduction in famines.
https://sealevel.info/learnmore.html?0=famine#benefits
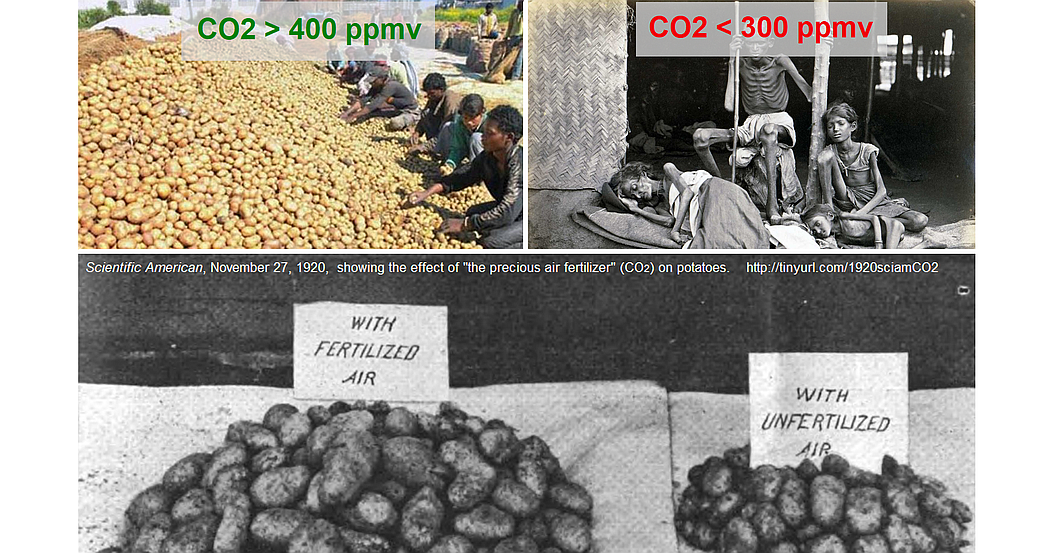
Improved food security improves childhood nutrition, which helps children to grow taller & stronger. Here’s a study:
https://www.sciencedaily.com/releases/2020/11/201105183840.htm
That produces more Big Men. Unsurprisingly, bigger guys hit more home runs. Here’s an article about it:
https://tht.fangraphs.com/does-size-matter-part-4/#:~:text=bigger%20guys%20are%20better%20hitters.%20Specifically%2C%20we%20found%20that%20larger%20players%20hit%20for%20more%20power%20(home%20runs%2C%20doubles)%2C
According to that article, smaller guys hit with less power, so they hit fewer home runs. But they do have one advantage. They have smaller strike zones, which makes them harder to strike out, and gives them a slight advantage getting on base.
Juan Browne on his Blancolirio channel gets down to the facts and he is nobody’s fool. His series on the failure of the Oroville Dam spillway in California was the best information anyone could get. Not to mention his analysis of aviation accidents. Kablammo!
All you contribute about air temperature and density is true, but the viscosity of air increases with temperature too. Air is not like maple syrup.
This offsets the presumed “benefit” of warmer, less dense air. Your point about altitude is good. And it is probably cooler there as well, which means the air has a lower viscosity. Therefore expect more HR’s in Denver than LA.
Crispin, do I understand correctly, from your first comment, that, with respect to aerodynamic drag on a baseball, the viscosity increase from a +1°C temperature change should offset about 3/4 of the density decrease from +1°C temperature change?
If so, that means a +1°C temperature increase would only increase long ball distances by about 2½ inches, rather than 10 inches. Is that right?
A typical homer is about 400 feet, and 2.5 inches is 0.05% of that distance. It does not seem plausible to me that a 0.05% increase in long ball distances could produce a 2% increase in the number of home runs.
If a 2.5 inch (0.05%) increase in long ball distances could really produce a 2% increase in the number of home runs, it would suggest that a 25×0.05% = 1.25% = 62.5 inch (5.2 foot) movement of the outfield wall would double or halve the number of HRs hit, which is obviously wrong. After all, MLB stadiums differ in their distances to the center field wall by about 45 feet.
Crispin, are you there?
This sort of thing is beyond desperate. In fact, only a lunatic would put the claims forward
If it’s one thing alarmism isn’t short of it’s lunatics.
What an interesting concept.
You can study the ultimate outcome of the effects of thermodynamics, hydrodynamics, and flight dynamics on the trajectory of a complex rotating projectile, the topology of its surface and the relationship between the topology and the mean motions, following its elastic collision with another object that affects its trajectory, the collision energies of which are supplied by a wide variety of human pitchers and batters, with the trajectory occurring under variable interactive environmental conditions, by consideration solely of the hypothesized effects of a single variable, the numerical value of which is obtained from from estimates of the effects of rates of increases in CO2 concentration that has already been discarded.
All this without writing a single equation relating to the processes and phenomena of the motions.
Ain’t Climate Science(tm) wonderful !!
Haiduke Sarafian, “Impact of the Drag Force and the Magnus Effect on the Trajectory of a Baseball,” World Journal of Mechanics, Vol. 5. No. 4, (2015). https://www.scirp.org/html/1-4900331_55623.htm
See also:
https://sci-hub.ee/10.1109/ICCSA.2011.29
https://www.amazon.com/Physics-Baseball-3rd-Robert-Adair/dp/0060084367
Back in the 1960’s, pitchers like Bob Gibson, Don Drysdale and Tom Seaver would pitch 300+ innings per season, starting 36-38 games, with 30 complete games and striking out 250+ hitters. If you hit a homerun off Drysdale or Gibson, on your next at bat, you’d likely get a 95 mph fastball behind your head. The pitching mound was also higher back then. In 1968, 8 starters had earned run averages (ERA) below 2.00.
1. Gibson • STL 1.12
2. Tiant • CLE 1.60
3. McDowell • CLE 1.81
4. McNally • BAL 1.95
5. McLain • DET 1.96
6. John • CHW 1.98
7. Bolin • SFG 1.99
8. Bahnsen • NYY 2.05
9. Veale • PIT 2.05
10.Koosman • NYM 2.08
https://www.baseball-reference.com/leagues/majors/1968-pitching-leaders.shtml
In 1969, MLB lowered the pitching mound to take the advantage away from pitchers. In 1976, the American League adopted the designated hitter (DH), taking the weak-hitting pitcher out of the lineup and generally replacing him with a second cleanup hitter.
[…]
https://bosoxinjection.com/2013/12/13/pitching-mound-history/#:~:text=The%20last%20time%20MLB%20made,from%20soiling%20a%20new%20ball.
Cheating has always been an integral part of baseball.
In 1961, I watched the New York Yankees and Kansas City play a game in Kansas City and saw Mickey Mantle and Roger Maris hit back-to-back homeruns. Mantle hit a long homerun and then Maris got up next and hit one even longer.
Both were within a few homeruns of reaching Babe Ruth’s record at the time, so seeing those homeruns was extra special.
Yogi Bera was the catcher. 🙂
It was a great New York Yankees team.
“When it was a game”…
https://youtu.be/bzwypfdCvBA
That seems a bit like Twenty20 cricket 🙁
Excellent article. Excellent debunking of this claim. Excellent comments.
You have to be wrong. That great, objective, nonbiased, Al Roker, who tries to pretend he’s a TV weatherman, says it’s true.
Roker Strikes Out By Blaming Climate Change For More Home Runs | Newsbusters
Simple stuff for simple people.
I wonder if anyone on either side of the argument has ever looked into the extensive research and experimentation done during WWII in the effort to make long range fire from big guns, such as those used by battleships and coastal artillery, more accurate?
An awful lot of science and expensive experimentation has been done over the years analyzing and quantifying the variables involved in ballistics.
The temperature graphs refer to game day temperature however the MLB has changed to laying most games at night so game-time temperature would be more relevant. For example the NY Mets next homestand (7 games) only two start before 4pm, a start around 7pm is most usual.
Has anyone read the actual “study” and how they got the game temperatures?
It does not appear that they were measured but were estimated from models.
I do nit see how they could get accurate temperatures for the last several years especially 2015-2019 when they claim they did a lot of the home run analysis. The temperatures have not been increasing in the last 8 years and the max temp charts show they have dropped since the 1930’s. But they solved that problem the usual way by starting in the 1960’s.
I just read the paper, it goes into quite a lot of detail. For example they compared the results from games played with a covered roof and those in the open.
“The effects described above include all games played in open-air stadiums and in retractable-roof stadiums when the roof is open (Appendix), comprising 89% of our observations. In the remaining 11% of games, which are played under closed domes, we find only small and insignificant effects of temperature, as covered games are less exposed to ambient weather”
Typical Borenstein AP news.