April 3rd, 2023 by Roy W. Spencer, Ph. D.
The Version 6 global average lower tropospheric temperature (LT) anomaly for March 2023 was +0.20 deg. C departure from the 1991-2020 mean. This is up from the February 2023 anomaly of +0.08 deg. C.

The linear warming trend since January, 1979 remains at +0.13 C/decade (+0.11 C/decade over the global-averaged oceans, and +0.18 C/decade over global-averaged land).
Various regional LT departures from the 30-year (1991-2020) average for the last 15 months are:
| YEAR | MO | GLOBE | NHEM. | SHEM. | TROPIC | USA48 | ARCTIC | AUST |
| 2022 | Jan | +0.03 | +0.06 | -0.00 | -0.23 | -0.13 | +0.68 | +0.10 |
| 2022 | Feb | -0.00 | +0.01 | -0.01 | -0.24 | -0.04 | -0.30 | -0.50 |
| 2022 | Mar | +0.15 | +0.27 | +0.03 | -0.07 | +0.22 | +0.74 | +0.02 |
| 2022 | Apr | +0.26 | +0.35 | +0.18 | -0.04 | -0.26 | +0.45 | +0.61 |
| 2022 | May | +0.17 | +0.25 | +0.10 | +0.01 | +0.59 | +0.23 | +0.20 |
| 2022 | Jun | +0.06 | +0.08 | +0.05 | -0.36 | +0.46 | +0.33 | +0.11 |
| 2022 | Jul | +0.36 | +0.37 | +0.35 | +0.13 | +0.84 | +0.55 | +0.65 |
| 2022 | Aug | +0.28 | +0.31 | +0.24 | -0.03 | +0.60 | +0.50 | -0.00 |
| 2022 | Sep | +0.24 | +0.43 | +0.06 | +0.03 | +0.88 | +0.69 | -0.28 |
| 2022 | Oct | +0.32 | +0.43 | +0.21 | +0.04 | +0.16 | +0.93 | +0.04 |
| 2022 | Nov | +0.17 | +0.21 | +0.13 | -0.16 | -0.51 | +0.51 | -0.56 |
| 2022 | Dec | +0.05 | +0.13 | -0.03 | -0.35 | -0.21 | +0.80 | -0.38 |
| 2023 | Jan | -0.04 | +0.05 | -0.14 | -0.38 | +0.12 | -0.12 | -0.50 |
| 2023 | Feb | +0.08 | +0.17 | 0.00 | -0.11 | +0.68 | -0.24 | -0.12 |
| 2023 | Mar | +0.20 | +0.23 | +0.16 | -0.14 | -1.44 | +0.17 | +0.40 |
The USA48 region had the 2nd coldest March in the 45-year satellite record, 1.44 deg. C below the 30-year normal. The coldest March was in 1981, at 1.91 deg. C below normal.
The full UAH Global Temperature Report, along with the LT global gridpoint anomaly image for March, 2023 should be available within the next several days here.
The global and regional monthly anomalies for the various atmospheric layers we monitor should be available in the next few days at the following locations:
Lower Troposphere:
http://vortex.nsstc.uah.edu/data/msu/v6.0/tlt/uahncdc_lt_6.0.txt
Mid-Troposphere:
http://vortex.nsstc.uah.edu/data/msu/v6.0/tmt/uahncdc_mt_6.0.txt
Tropopause:
http://vortex.nsstc.uah.edu/data/msu/v6.0/ttp/uahncdc_tp_6.0.txt
Lower Stratosphere:
http://vortex.nsstc.uah.edu/data/msu/v6.0/tls/uahncdc_ls_6.0.txt
So, no need for panic stations, then…
Well, apart from the fact that we are only just starting to transition out of cooling La Nina conditions and already even UAH is posting top-ten warmest monthly temperatures… Don’t panic. Don’t be complacent either.
Absolutely ZERO need to panic or even consider, even if we are lucky enough to get a bit more warming.
After all, the planet is only a degree or so above the COLDEST it’s been in 10,000 years, and considerably COOLER than most of that period.
Yes because of the ESNO transition along with a minuscule impact of our sins.
Uh, where is all that dangerous ocean heat content again? Or was that a another lobbyist tale?
If I remember correctly someone in the Climategate emails said it was “hiding”.
That is what Trenberth’s paper asserted. See essay ‘Missing Heat’ in ebook Blowing Smoke for all the amusing ocean science details he ignored. The ocean heat is not hiding. It was never there in the first place except in his faulty climate models.
Three mandatory readings (among many other studies/reports/books debunking CliSciFi): 1) Rud’s ebook “Blowing Smoke;” 2) Vaclav Smil’s “How the World Really Works;” and Steven Koonin’s “Unsettled.”
Leftists ignore all contrary science when making up their consensus “facts.” And just think: The usually-Democrat Party controlled U.S. House Un-American Activities Committee (Established in 1945, renamed House Committee on Internal Security in 1969.) when you hear anything coming out of the U.S. Congress or any Deep State Executive Office agency.
Thanks for the reminder, ResourceGuy. Back in 2019, I published a post that showed how much the global oceans to 2000 meters had warmed in deg C for the period of 2005 to 2017…the period being limited to the length of the NODC depth-averaged-temperature data available at the KNMI Climate Explorer at the time. They had warmed less than 0.07 deg C.
See my post here:
Deep Ocean Warming in Degrees C | Bob Tisdale – Climate Observations (wordpress.com)
It was cross posted at WUWT here:
https://wattsupwiththat.com/2019/01/23/deep-ocean-warming-in-degrees-c/
Regards,
Bob
A lot was just Sublimated away
So Sublimation of water is 2,830,000 J/kg.
To evaporate 1 m^3 of water with sea water specific volume @ur momisugly 15 oC at 0.001009 m^3/kg for each m^3 there is an exchange of
=> 2,500,000(J/kg)/0.001009(m^3/kg) = 2,477,700,000 J/m^3
And since most of this energy is taken from the nearby sea water – it will cool
Specific Heat Sea Water = 4,009 J/kg oC 2,830,000/4,009 = 705 or 705 kg by 1- C or @ur momisugly 1024 kg/m^3 sea water = .688 m^3
How many m^3 were evaporated to cause the west coast and central plains rain & snow storms this winter?
7th warmest March, but still a lot cooler than the warmest March in 2016, at 0.64°C.
Of the top 10 warmest March’s 7 have happened in the last 10 years.
“Pause” is now starting in July 2014. I think this might be the first time in a while where there is no starting point that will give you a trend of 0.3C / decade. The tend since September 2007 is still twice the overall trend.
My forecast for 2023 (just a simple linear extrapolation) saw a bit of a rise, up to 0.13 ± 0.13 °C from 0.09°C.
The tend since September 2007 is still twice the overall trend.
And the trend since 2004 is less than zero. Any other meaningless proclamations?
The trend since January 2004 is +0.18°C / decade,
So, faster than the long term trend. I wonder where Mike got his figures from? We may never know.
Possibly he meant 2014. Or maybe he’s just comparing one month.
”The trend”
Your ”trends”…..
…..seem to be part of a wave..
So, nothing to do with UAH data then? Just some random surface temperature values, which only go up to 2010. How exactly do you from that the claim that there has been a declining trend since 2004?
I picked a month or more that was high. Just as you make a comment every month about what is happening that month.
Be EXTREMELY grateful for the slight warming since the LIA, which was the COLDEST period in 10,000 years.
Hope for another degree or so, to bring the planet up near the MWP or RWP.
Curious…
Maybe this one is better for a longer look.
Well that is simply horrifying.
A quick math triangulation . The UAH observed rise is 0.13C/decade over now ~4 decades in a mostly ‘hot’ AMO and PDO, with AMO now likely shifting to ‘cold’.
In UAH beginning 1979, CO2 was ~340 ppm. At end 2022, ~420 ppm. Up about 25%, one fourth of a doubling. Observational EBM ECS for a doubling is about 1.7C. 25% of that is ~0.43C. So over about 4 decades UAH gets an observed 0.13C/decade while the EBM ECS says ~0.11/decade. Very close agreement considering the hot ocean cycle phases over the UAH record.
Cancel all climate alarms.
The date I have for the AMO shift to the cold phase is 2025 ± 1 year if it maintains the same periodicity. When that happens we can expect a decrease in the global average surface temperature of 0.1-0.3ºC over a decade and a half. Lots of action for the global warming wars.
”When that happens we can expect a decrease in the global average surface temperature of 0.1-0.3ºC over a decade and a half.”
That may very well lead to a lot of violent weather which the warmers will use as evidence that humans are bad. Will the warmers turn into coolers?
Hopefully, metal ones that don’t float.
“Very close agreement”
No. The E in ECS is Equilibrium. The rise in UAH is not an equilibrium value.
ECS descibes how much change would be caused for a given change in CO2 levels. As long as the ECS is not 0.0 (meaning extra CO2 has absolutely no effect), changing CO2 means a change in UAH. To reach equilibrium and no change in UAH, all outside factors affecting temperature would have to be held steady. CO2 levels as well as solar output and the drivers of PDO/AMO/La Nina would need to be fixed for a few years.
I’m trying to not misinterpret what you are posting, nutmeg, but the UN IPCC has declared that a period of 30 years is sufficient to identify climatic changes (should be 70+). According to them, UAH6’s 43+ years of data in the face of growing atmospheric CO2 concentrations should be sufficient to establish the benign impacts of CO2 emissions, especially considering the global greening effects of CO2.
Dave, I probably wasn’t clear enough that I was responding to Nick Stokes’ statement, which may have also suffered from a lack of clarity.
Nick’s statement was correct in that you cannot just state that the UAH change from 1979 to 2022 is all the warming that will occur due to the CO2 added from 1979 to 2022 (because there are feedback mechanisms that don’t happen instantly). Even if CO2 flatlined starting January 1, 2023, there could still be warming this year caused by CO2 added in 2022 or earlier.
The incorrect part of the statement is in implying that the UAH needs to be an equilibrium value in order to make a comparison to ECS. That may not have been Nick’s intent, but given a steady rise in CO2 levels or a good estimate for the time needed for feedbacks to occur, then we can use data to estimate ECS despite not having a steady UAH temperature.
Thanks for the reply, nutmeg. I agree with you.
My understanding that the time required to reach the equilibrium of ECS calculations is a steeply logarithmic function; i.e. most of it occurs early on. In that case, instantaneously and rapidly increasing temperature feedbacks in response to increases in atmospheric CO2 concentrations should be readily apparent in the real-time atmospheric temperature profiles.
Any effects of rapidly increasing atmospheric CO2 concentrations must therefore become readily apparent in UAH6 atmospheric temperature estimates in real time; certainly within a year or so, and 43 years+ is a long time. If one wants an exact answer, just apply the logarithmic formula and add in non-CO2 radiative and other physical process changes to atmospheric temperatures the best one can.
Anyway, it is clear that atmospheric temperature changes are not following changes in CO2 concentrations and any assumptions about water vapor and other feedbacks as postulated by CliSciFi climate model temperature outputs. Its an indication that Gaia doesn’t care what the UN Leftists think.
[As an aside, as a basis of the GHG theory CliSciFi dictates that surface temperature changes are a function of and forced by atmospheric temperature changes.]
It doesn’t matter, Nick. UN IPCC CliSciFi models (based on their 3℃+ ECSs) predicted warming up to 3X that of the actual historical UHA6 and radiosonde data. The models give temperature guesses based on pure extrapolation of atmospheric CO2 concentrations because, as the modeler’s say, their models are tuned to give an ECS that “looks about right.”
Nick, the quality and applicability of your comments seem to be deteriorating in the face of growing scientific evidence that CO2 is not a control knob for temperatures, much less a basis for CliSciFi speculation about long-term climate change and any impacts on the biosphere. The only parts of IPCC ARs having any science at all are the WG1 chapters. WG2s, WG3s and Synthesis Reports are wild activist speculation about physical impacts and politicized recommendations for policy actions based on exaggerated predictions of warming and its impacts. I believe history will not treat them nor you kindly.
This is a good paper based around that same premise
http://gpvjma.ccs.hpcc.jp/~tanaka/web/papers/PAIJ-05-00236.pdf
For Australia, the “pause” Lord Monckton style, now extends to 10 years & 11 months.
In a sense, one can say that Australian under 12 years of age have not been exposed to global warming while at home. Yet, they are taught, strongly, that they face an existential threat from global warming/climate change.
The media do not want to talk about UAH science, particularly this “pause” which should be near the top of the school curriculum. Courtest blogger Ross at Jo Nova’s blog, we have a new word to describe this reluctance to make news of an event. Ross noted –
….
…. a new word ‘totting’. English for totschweigetaktik. Means ‘death by silence’ and refers to a tactic employed to kill issues and news reports by simply ignoring them. Totting has been applied to numerous stories in recent times. Hunter Biden laptop, Twitter files, Nordstream II pipeline explosion story, adverse vaccine reactions and many more. One more of the reasons these days to not trust MSM.
………
Come on, Australian news reporters, here is the graph to show the pause. No fiddling, no adjustment, just the facts, Ma’am.
Geoff S
GS said: “No fiddling, no adjustment, just the facts, Ma’am.”
The myth that never dies.
Year / Version / Effect / Description / Citation
Adjustment 1: 1992 : A : unknown effect : simple bias correction : Spencer & Christy 1992
Adjustment 2: 1994 : B : -0.03 C/decade : linear diurnal drift : Christy et al. 1995
Adjustment 3: 1997 : C : +0.03 C/decade : removal of residual annual cycle related to hot
target variations : Christy et al. 1998
Adjustment 4: 1998 : D : +0.10 C/decade : orbital decay : Christy et al. 2000
Adjustment 5: 1998 : D : -0.07 C/decade : removal of dependence on time variations of hot target temperature : Christy et al. 2000
Adjustment 6: 2003 : 5.0 : +0.008 C/decade : non-linear diurnal drift : Christy et al. 2003
Adjustment 7: 2004 : 5.1 : -0.004 C/decade : data criteria acceptance : Karl et al. 2006
Adjustment 8: 2005 : 5.2 : +0.035 C/decade : diurnal drift : Spencer et al. 2006
Adjustment 9: 2017 : 6.0 : -0.03 C/decade : new method : Spencer et al. 2017 [open]
That is 0.307 C/decade worth of adjustments jumping from version to version netting out to +0.039 C/decade. And that does not include the adjustment in the inaugural version.
Pay particular attention to their infilling strategy.
15 grids representing 2.5° of longitude each at the equator is 4175 km. Compare this to GISTEMP which only interpolates to a maximum of 1200 km. And GISTEMP does not perform any temporal interpolation.
Every one of them for a valid SCIENTIFIC REASON
Unlike GISS, which uses fantasy reason for their manic adjustments of their mostly URBAN temperature fabrication.
“Unlike GISS, which uses fantasy reason for their manic adjustments of their mostly URBAN temperature fabrication.”
_______________________________________________
In 2022 GISS made 3856 Changes to their Land Ocean Temperature Index (LOTI). So far in 2023 it looks like this:
Jan Feb
365 236
I estimate that UAH made up to 50 million changes last year. That is 9500 cells * 516 months * 12 updates.
Not this idiocy, again.
It’s funny because…
1) UAH has a time-of-change change bias that they adjust for too.
2) UAH has an instrument package change bias that they adjust for too.
3) UAH performs infilling too.
4) The net effect of all UAH adjustments increases the warming trend.
5) The net effect of all GISTEMP adjustments decreases the warming trend.
So I have choice but to believe that your use of the phrase “valid scientific reason” is based who makes the adjustments. In other words, you believe it is “valid” if UAH does it, but not anyone else.
BTW…I should point out that I believe you are a minority here. I’m told over and over again that adjustments of any kind are not only unscientific, but without exception are fraudulent. I’ve even had posters here tell me it is criminal and that anyone doing it should be prosecuted. The hypocrisy here is palpable…
Canada has been paused since the step jump about 20 years ago.
https://showyourstripes.info/c/northamerica/canada/all
here’s what facebook shows me in the climate propaganda centre. Not sure why they stopped updating the data.
Because the new data didn’t comport with the narrative?
The visuals would be a hell-of-a-lot different if they used the correctly updated climatic period 1991 to 2020 used by those following WMO guidance.
“In a sense, one can say that Australian under 12 years of age have not been exposed to global warming while at home.”
No, you can’t. No Australians, of any age, have been exposed to the temperatures of the lower troposphere, where UAH measures, unless skydiving. And they would not like it. Back in the day when UAH listed temperatures as well as anomalies, global average was about -26 °C. Australia might have been a little warmer.
Yes you can.
Its not exactly a devastating warming when you have to argue about precisely where its measured, is it.
Nick, your CliSciFi says surface temperatures are driven by changes in tropospheric temperatures. Stick to the narrative or you might be canceled.
Nick Stokes,
Rats.
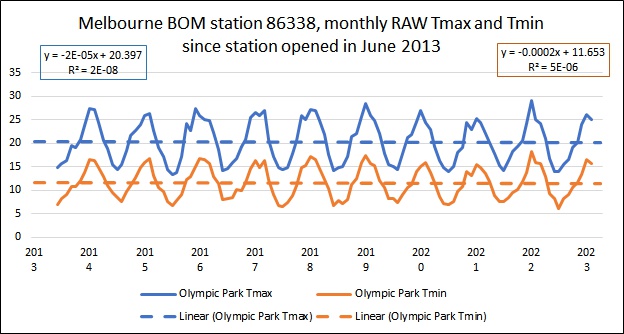
You maintain a weather web site in Melbourne Australia. Inter alia, you analyse routine temperatures like those curated by our BOM.
Children who have lived in Melbourne for the past 10 years can relate to these temperatures, where the thermometers would have been around chest high to an adult.
What? No global warming for the past decade at Melbourne’s main weather station?
Why is it hard to see any mention of this by the BOM?
Geoff S
p.s. The same type of pause exists in the national average of all Australian BOM ACORN-SAT sites (straight average of 112 sites). I have not area weighted these.
We had our coldest March of the 21st century in Northern Utah beating out even 2002 and 2008. Of course, this was not featured in the media. Instead thanks to our city’s rapidly expanding population, we’re going to have another hot summer even if in reality the climate gives us a mild summer, and the local media will scream climate change and heat wave apocalypse.
Oh, goody….
A new El Nino cycle will give Leftists an excuse to fan the the flames of Warmageddon, while they conveniently ignored all the extreme cold events during the rare triple-dip La Niña event that just finished, and ignored the fact there hasn’t been a global warming trend for the past 8+ years.
Thanks to math, the new El Nino cycle will end the 8-year warming hiatus until the next La Niña starts around the end of 2025, and then the silly Left will again proceed to ignore the global cooling events..
The only major difference is that the PDO is already in its 30-year cool cycle, and the AMO should start its 30-year cool cycle around 2026, which should bring 30+ years flat/falling global temperature trends as we saw from 1880~1913 and from 1945~1979 when the PDO and AMO were both in their cool cycles
CO2 forcing is a minor variable in earth’s complex and chaotic climate system and it’s insane and unscientific for Leftist political hacks to continue to waste $10’s of trillions and destroying global economies on a Warmageddon hoax that doesn’t exist.
Are you still expecting UAH TLT to drop to -0.3 C soon?
if the coming El Niño is weak, and the next La Niña is strong, perhaps we could see -0.3C around 2027.
Let me get this straight…so when you first predicted it would happen on the first La Nina, you actually meant the second. Then when you said the second, you actually meant the third. Now you’re saying that all along you actually meant the 4th La Nina around 2027?
No. My previous prediction was also based on a strong La Niña, but it was a weak one.
there hasn’t been a strong La Niña since 2010.
You didn’t say anything about a strong La Nina in the post I linked to above. You just said back-to-back La Nina.
BTW…you also said, based on what was happening in the Pacific and Atlantic, that the pause will connect up with 1996 and by 2026 will be 30 years.
What’s unusual is we’ve had an 8 year cooling period and we’re about to have a record breaking El Niño. These types of El Niños typically occur about 15 years after the last one. Even during the past warming period this is unprecedented just looking from 1978 to 2003. We may be in the midst of a new climate shift. Perhaps the idea of a cooling planet isn’t so outlandish anymore.
The last super El Nino was 2016. We went from that to a triple dip La Nina. It’s not unsurprising there has been a pause. Anyway, where are seeing that a record breaking El Nino is about to occur?
Does it not seem strange to you that CO2 has nothing to with warming the waters of El Nino? CO2 can only warm the top mm of the ocean and whoof, away goes water vapor!
USA48 is at -1.44!
Heating precedes emission.
A single lower troposphere temperature does not exist anywhere on the planet: over the 0-10km altitude range that the NOAA satellites measure, the air temperature falls by 50% (~280K-140K). The UAH values are a complex convolution of this large temperature range.
https://en.wikipedia.org/wiki/File:Comparison_US_standard_atmosphere_1962.svg
(I hate to quote the wikinisitas, but this is a decent graph)
So, what?
What exactly are these numbers telling you?
They tell me nothing; they’re just numbers without context. So what? What is your point?
That the UAH numbers are not surface temperatures? Does this help?
Your hero CliSciFi practitioners assert that surface temperatures are driven by atmospheric temperatures. It certainly doesn’t help you. And it absolutely doesn’t help you when nobody can find the CliSciFi-predicted Tropospheric Hot Spot. You do realize that that failure to find it blows up the predicted extreme water vapor CO2 temperature amplification theory of the warmunists, don’t you?
Oh my, you really made that leap into the abyss…
Got any evidence that I ascribe to what you allege here?
After rereading the whole of our exchange, I see where I made a mistake. I thought you were supporting Nick Stokes’ attack on on UAH6 because it was made up of layers of atmospheric temperatures that were substantially colder than surface temperatures.
I was fully aware that the graph you posted showed the elevation related to the temperature lapse rate and the corresponding changes to the speed of sound and the exponential changes in the density and pressure of air parcels. My though was that it did not invalidate the many calculations by UAH6 in estimating bulk atmosphere temperature averages. And I got snarky when I thought you were disparaging UAH6 data sets.
Please accept my sincerest apologies.
Signed: Dave
I keep seeing mentions of “wait till the El Nino arrives”, then you’ll really see man-made warming.
Can someone explain how manmade CO2 or the atmosphere warms the ocean and makes El Nino’s so bad? Seems like something else is controlling the variability of El Nino’s.
Bingo, el Nino is the last great hope to Keep the Rise Alive.
The “Pause” in Australia is shown by data from UAH.
The “Pause also exists in the Australian BOM data set, the official adjusted one named ACORN-SAT.
Here is a graph copied from Chris Gillham’s web site named waclimate. Both sources show the pause from mid-2012 to now.
Geoff S