Dave Burton,
CNBC and the Potsdam Institute (PIK) report that:
We’re halfway to a tipping point that would trigger 6 feet of sea level rise from melting of the Greenland Ice Sheet
PUBLISHED WED, MAR 29 202312:12 PM EDT
By Catherine Clifford
KEY POINTS:
● Once people have cumulatively emitted approximately 1,000 gigatons of carbon in total, then the southern part of the Greenland Ice Sheet will melt eventually causing the sea level to rise by almost six feet.
● Once humans have cumulatively emitted approximately 2,500 gigatons of carbon in total, the whole Greenland Ice Sheet will eventually melt and the sea level rise would rise by 6.9 meters, or 22.6 feet.
● And right now, now we are at approximately 500 gigatons of carbon emissions released.
Here’s the article:
https://www.cnbc.com/2023/03/29/were-halfway-to-a-tipping-point-for-melting-the-greenland-ice-sheet.html
Here’s the paper:
https://agupubs.onlinelibrary.wiley.com/doi/10.1029/2022GL101827
Like most things from PIK, this “study,” and this CNBC article, are nonsense.
The best estimates are that since 1850 anthropogenic carbon emissions have totaled about 675 Gt of carbon (a/k/a PgC) (not 500). Over that same period, the amount of CO2 in the atmosphere has increased by only about 135 ppmv CO2 = 287 PgC (gigatonnes carbon). The difference is the amount removed from the atmosphere by natural negative feedbacks, such as absorption by the oceans, greening the Earth, and rock weathering.
(Aside: Petagram ≡ gigatonne ≡ Gt, and “PgC” means “petagram of carbon,” so 1 PgC = 1 Gt of carbon (GtC). 1 ppmv CO2 = 7.8024 Gt CO2 = 2.12940 PgC.)
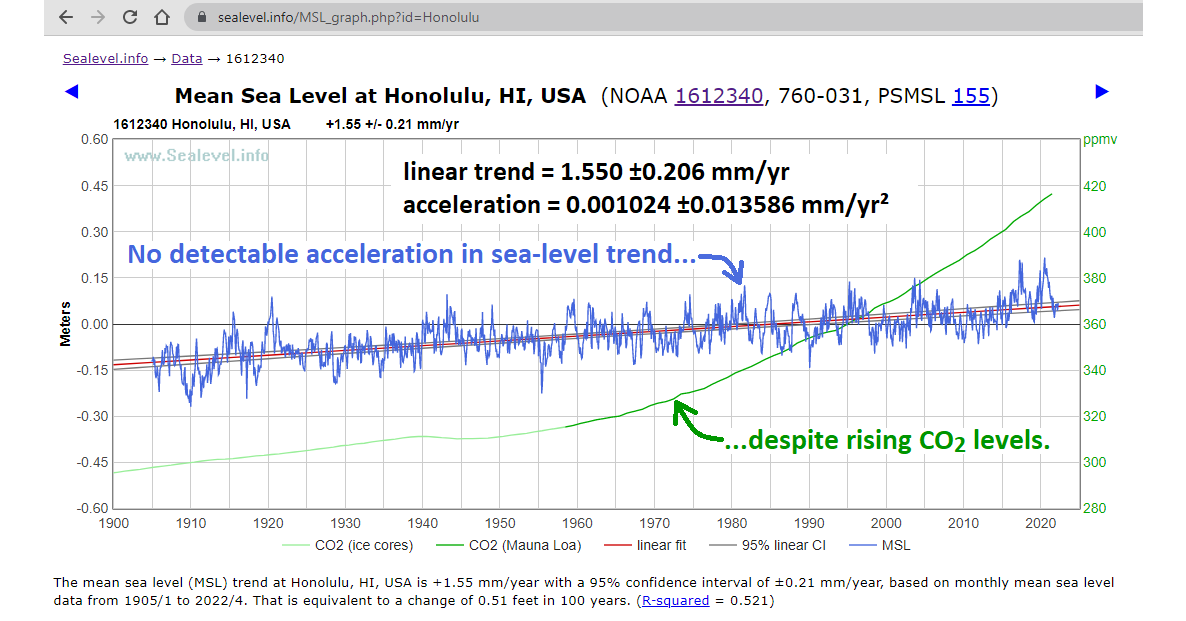
Yet we’ve only gotten an estimated 1.02 to 1.27 °C of warming from all that CO2, and it’s been accompanied by negligible acceleration in sea-level trends:
https://sealevel.info/MSL_graph.php?id=Honolulu

Another 325 PgC or 500 PgC of emissions would produce even less additional warming than the 675 PgC we’ve already had, and it would have even less effect on sea-level trends.
As a rule of thumb, anytime someone uses a term like “tipping point” or “runaway” in a sentence about contemporary climate change, without pooh-poohing it, it means they don’t know what they’re talking about, and they’re completely clueless about feedbacks.
Imaginary “tipping points” don’t melt ice, only temperatures above 0°C can do that. Thanks to “Arctic Amplification,” Greenland should get more warming than most other places, but still no more than a few degrees. That much warming would be nice for the hardy people who live there, but it could not melt the southern part of the Greenland Ice Sheet, because water has to get above 0°C to melt, and the southern part of the Greenland Ice Sheet averages much colder than that.
What’s more, we know that Southern Greenland was considerably warmer, 1000 years ago, during the Medieval Warm Period. We know that because Norse settlers successfully grew barley there, and the growing season now is too short for that, even with modern fast-maturing cultivars. Norsemen buried their dead in earth that is now permafrost, too. Yet that much warmer Greenland climate nevertheless produced no notable spike in global sea-levels.
That might be because in a warming climate, there are factors which both increase and decrease sea-level trends.
On one hand, ice which is near 0°C can melt, and if it was grounded (rather than floating) that would raise sea-level. Also, thermal expansion at the ocean’s surface can increase sea-level rise locally, though it doesn’t affect sea-level elsewhere. Those are things which raise sea-level.
On the other hand, warmer temperatures increase snowfall accumulation on glaciers and ice sheets, sequestering water, and thereby lowering sea-level, in two ways:
● Warmer air carries more moisture, increasing snowfall on glaciers & ice sheets. For each 1°C of warming the moisture-carrying capacity of the air increases by about 7%. That’s why the heaviest blizzards occur when temperatures are not far below freezing.
● Reduced sea-ice coverage increases Lake/Ocean-Effect Snowfall (LOES) downwind, some of which accumulates on glaciers & ice sheets.
The importance of the LOES is illustrated by the amazing story of Glacier Girl, a P-38 warbird which made a forced landing on the Greenland Ice Sheet, not far from the ocean, during WWII. She was buried by snowfall which averaged about 70 feet/year! Remarkably, she was nevertheless recovered (in pieces) from beneath the ice, fifty years later, and is once again airworthy. (click to enlarge)

The fact that global warming has not been accompanied by significant sea-level rise acceleration strongly suggests that the factors by which a warming climate increases sea-level and the factors by which a warming climate reduces sea-level are similar in magnitude, and largely cancel.
Furthermore, it’s not “cumulative carbon emissions” which affect temperatures, it’s the concentration of CO2 currently in the atmosphere. The authors of this awful paper seem to think that CO2 emissions just accumulate in the atmosphere, but that is untrue. As that atmospheric CO2 concentration increases, the natural negative feedbacks which remove CO2 from the atmosphere accelerate sharply. They are already removing more than 5 PgC per year from the air, and that removal rate accelerates by 1 PgC/year for every approximately 20 to 23 ppmv rise in atmospheric CO2 concentration.
Since the current CO2 emission rate is only outstripping the natural CO2 removal rate by about 5.3 Gt of carbon per year, that means the current CO2 emission rate is only sufficient to increase atmospheric CO2 concentration by about 100 to 125 ppmv. That means mankind could emit CO2 at the current rate forever (or until all the coal ran out), and the atmospheric CO2 concentration would still never reach even 550 ppmv.
An increase from 420 ppmv to 550 ppmv would yield only 39% of the radiative forcing of one “doubling” of CO2. For comparison, we’ve already seen 58% of the radiative forcing of a doubling of CO2 (plus about half that much from other GHGs).
The effects on temperatures have been modest and benign, the effects on sea-level have been negligible, and the effects of higher CO2 levels on agriculture and natural ecosystems have been highly beneficial.
###
Dave Burton @ncdave4life is the creator of the sealevel.info web site, a member of the CO2 Coalition, and a two-time IPCC Assessment Report Expert Reviewer. He lives in Cary, NC.
Great article!
Tipping points, the PIKs obsession.
As well as slowing AMOC.
Freak-Show of Potsdam.
It must be a bundle of fun working there. Smiles definitely verboten.
I’m sure they have belly laughs when they read out loud the crazy stuff they write, and especially after dimwit media outlets pickup their reports and broadcast it out as though it was hard fact.
I doubt it. I think many of them really are that silly.
Surely not all of them, but the few who aren’t that silly are mostly too timid to call out the crackpots, for the same reason they don’t call out the Guy McPherson and XR insanity. Those are the alarmists who know that the alarmist crackpots are crackpots, but they think of them as “on the same side.” So, out of solidarity, they won’t say out-loud that the Emperor has no clothes, even if they’re smart enough to recognize it, themselves.
I do like a good laugh, and PIK [et al] rarely disappoint.
“…halfway to a tipping point “
Would that be 0.5 Wadhams? How do they know there is a tipping point, let alone that we’re allegedly halfway there?
“With the fully coupled Earth system model of intermediate complexity CLIMBER-X…”
They put in their assumptions and guesstimates…
“emissions larger than 1,000 Gt carbon [provisionally; could be rated higher or lower if needed] are released into the atmosphere, the GIS will shrink below a critical threshold and mass loss will inevitably continue until a substantial part of the ice sheet has melted.”
https://agupubs.onlinelibrary.wiley.com/doi/10.1029/2022GL101827
So far, after all these decades, they still haven’t had the pleasure of saying ‘told you so’. And they never will.
Buried in the actual science report – I’m thinking of the one from a couple of years ago that trumpeted the impending, dangerous, emergency, crisis even of the Antarctic ice sheet becoming unstable – reaching a tipping point!!! – situation so dire, that if don’t immediately return to the stone age then the whole ice sheet could become unstable and melt or fall in the sea…. in 700 years. Yawn.
The alarmist scientists know this, even if they don’t tell their groupies and the ambulance chasing media – so it’s totally appropriate to call these so-called experts frauds and liars, even if the climate science was dead on – melting ice caps half a MILLENNIUM from now is not a crisis by any stretch.
“…halfway to a tipping point “
Same phrase caught my attention. My question:halfway from where? Once there is a quantifiable tipping point, isn’t it always a quantifiable distance away?
I enjoy looking at the DMI Greenland Surface Conditions chart.
This year has been at bit unusual in terms of accumulation
It’s melting all over……..not.
The guys of PIK should take their heads out of the microwave, danger of brain melting… 😀
Don’t tell the PIKmen but there are quite a few hot springs in Greenland.
https://visitgreenland.com/about-greenland/hot-springs-greenland/
And volcanos!
“Eyjafjallajökull consists of a volcano completely covered by an ice cap. The ice cap covers an area of about 80 square kilometres (30 square miles), feeding many outlet glaciers.”
I refer to the graph
Yes, below average accumulation in the south. (Click on ‘Acc’ on the site Ben linked).
Good article, from Dave at CO2. The only part of Greenland that has any actual summer is the southwest strip of land, where summer temperatures average less than 10 deg C. How many 10 deg C days does it take to melt a mile thickness of ice? What? The snow keeps falling and this creates a moving target? Never mind.
That’s where the model comes in. Just takes professors assigning projects in exchange for lifestyles.
At some point, CO2 will reach the saturation point whereby, ALL radiation absorbable by CO2 will be absorbed. At that point, it really won’t matter how much additional CO2 goes into the atmosphere. I believe the Wijngaarden /Happer research indicates we are already at that point!
Since the atmospheric water vapour also covers almost all of CO2’s absorption bands I don’t doubt your conclusions
We reached that point at around 100 ppm. Increasing CO2 at present does not cause warming. The reason is that increasing CO2 has a cooling effect that is never discussed. This shows up in the NOAA radiosonde data. The overall opacity of the atmosphere has been unchanged since 1948. See Miskolczi 2010.
How this happens was mostly explained by Dr. William Gray.
http://tropical.atmos.colostate.edu/Includes/Documents/Publications/gray2012.pdf
Dr. Gray actually overstates the warming potential because he assumed IPCC claims as a starting point.
Yet we’ve only gotten an estimated 1.02 to 1.27 °C of warming from all that CO2, and it’s been accompanied by negligible acceleration in sea-level trends
There is no proof that any of the observed warming was caused by CO2. Warmings of such magnitude and speed have happened many times before anthropogenic CO2 emissions.There is no acceleration of sea-level rise. No qualifier is necessary.
“water has to get above 0°C to melt”
Technically, ice made from distilled water and at 1 atmosphere pressure melts at zero degrees, not above.
It is much more complex, but it would be more correct to say that the ice environment must be above 0°C in order to bring the ice temperature to zero and supply additional heat to melt the ice , which still remains at zero while melting.
Technically how much of the Greenland Ice Cap, which is what the article is about, is distilled water?
Since nearly all of it is “distilled water”, i.e. it is condensed from vapour to liquid/solid, about all of it.
I’d venture all of it with minor qualification.
It did start as sea-water that was evaporated, then condensed then fell as snow/rain.
It meets all the criteria for ‘distillation’
The Qualification being that it fell (as liquid water anyway) it would have absorbed sufficient )no more, no less) carbon dioxide to give it a pH of about 5.4 – hence its Olde Worlde Scientifika Nayme of Ye Carbonic Acid
I’d venture that that **may** lower its melting point but by notta lot
Its real significant problem, and I’d assert that that is why the Arctic Sea Ice is melting, is how much salt is mixed into it.
For Arctic Sea Ice, the humongous amounts of road de-icing salt will be coming off New England roads whenever they dry out after a snowy spell and the traffic pulverises the stuff.
Prevailing winds along the line of the Gulf Stream will carry that finely powdersied salt dust salt right out over the North Atlantic and let it gently rain/snow down on everywhere underneath its track.
That salt-dust will also carry a lot of ‘road grime’ (powdered tyre-dust and asphalt)
The combination of the de-icing salt and the Albedo lowering grime means that ice anywhere, certainly thin ice as in Arctica, hasn’t got the proverbial ‘Snowball’s In Hell Chance.
As we see.
Greenland is another matter. The grime will melt the surface ice which will form lakes. The melted water will carry said grot/grime into them where it will sink into the lowest/deepest part and be concentrated there.
Out of reach of El Sol and vastly reducing its effect on Albedo.
The thick ice of Greenland is thus self-protecting, Arctica maybe not so.
More
researchwild unhinged and flamboyant speculation is needededit to PS
Arctic Ice will be under over a double whammy.
Not only will it have de-icing salt raining down on it, but water heated bu the UHI, carried by the Gulf Stream, will be eating it from underneath.
The ice in Arctica is not melting because of Global Gassing or garbage like that.
Its melting because of the very presence of New England
A flow from Upwind bring saltAnother flow from Upstream carrying warm water heated by the big cities
Thanks, but I think depending on what altitude it fell from and what direction it came from it picked up pollution of some kind and was not distilled when it landed.
It is interesting to note that much of the grimy-looking sea-ice is not dirtied by volcanic ash or by man-made pollution, but by being flipped like a pancake. It turns out there is an entire ecosystem on the underside of the ice. The MOSAiC expedition studied this ecosystem, and described long streamers of algae that grow downwards during the summer. (How they hang on to melting ice I’d like to know.) In any case, when ice floes collisde and form pressure ridges of jumbled plates of ice, the flipped ice displays bottoms that are anything but clean. (No, I won’t go there.)
Very good point – things have warmed and cooled by about the same amount or more even just in the historical period (~10K yrs BC to today) and it was all natural. So why is it any different now?
re: “[Burton wrote] ‘…has to get above 0°C to melt’”
You’re right, my wording was sloppy. Your description is much better.
re: “Warmings of such magnitude and speed have happened many times before anthropogenic CO2 emissions.”
True. Are you familiar with “Dansgaard-Oeschger events” (a/k/a “Greenland interstadials”)? Ice cores record about two dozen of them during the last glaciation. The ice cores record evidence that temperatures changed at rates as rapid as several degrees per decade in Greenland.
Re: “There is no proof that any of the observed warming was caused by CO2.”
Well, we know from physical principles that the increase in CO2 must have had at least a slight warming effect. But even if all of the warming in the last 150 years was due to anthropogenic GHGs (which I doubt), 1.02 to 1.27 °C is slight, and there’s no persuasive evidence that it’s at all harmful.
Re: “There is no acceleration of sea-level rise.”
Well, it is true that no acceleration is detectable in the last nine decades or more, in most of the best long sea-level measurement records. But some sites have seen a slight acceleration, and some respected studies of coastal sea-level trends have reported detecting a slight acceleration. Houston (2021) helpfully summarized ten such studies:
But when I say “slight” what I really mean is “negligible.” For instance, Hogarth (2014) reported, “Sea level acceleration from extended tide gauge data converges on 0.01 mm/yr²“
An acceleration of 0.01 mm/yr², if it persisted for 100 years, would increase sea-level by just 2 inches.
An acceleration of 0.01 mm/yr², if it persisted for 200 years, would increase sea-level by just 8 inches.
For those who’re panicked by that prospect, perhaps some professional counseling would help.
CO2 only has a warming effect if you ignore the cooling effect which also comes from physical principles.
When CO2 is increased much of the DWIR leads to increased evaporation. As Dr. William Gray pointed out, this accelerates convection which pushes this warm, moist air higher into a colder part of the atmosphere. The result is more condensation reducing the high atmosphere water vapor.
You get more latent energy moved away from the surface AND reduced water vapor greenhouse absorption.
The part of the DWIR which doesn’t cause evaporation is simply conducted back into the atmosphere due to the 2nd Law. After all, over 99.9% of that energy comes from the lowest few meters of the atmosphere. No warming occurs.
There are many “feedback mechanisms” which either amplify (via “positive feedback”) or attenuate (via “negative feedback”) the slight warming effect of CO2 emissions. To justify alarm over anthropogenic warming, one must believe that those feedbacks are strongly net-positive (amplifying). The evidence does not support that belief.
The best-known feedback is water vapor feedback. Each 1°C of warming increases the amount of water vapor that the air can hold by about 7%, and since water vapor is a radiatively active so-called “greenhouse gas,” that is a positive feedback, which must help to amplify the warming effects of other GHGs.
However, higher absolute humidity should also reduce the lapse rate, and, as you point out, the predicted slight acceleration in the water cycle should increase evaporative cooling of the surface. Both of those are negative feedbacks, which attenuate the warming effect of other GHGs.
Probably even more important are feedbacks involving clouds. Increased daytime cloudiness would generally have a sharp cooling effect, but increased nighttime cloudiness would have a warming effect. Cirrus clouds are thought to have a net warming effect, because they’re made of ice crystals, which makes them much more nearly opaque to outgoing longwave infrared than to incoming visible and near-IR solar radiation. Clouds are immensely important, but also complicated, and poorly understood. It is not known whether cloud feedbacks are net positive or net negative.
It is quite possible that the net effect of all those feedbacks is negative; i.e., that it reduces the warming effect of “forcings” like additional CO2. However, by their nature, even very strongly negative feedbacks cannot reduce the effect of “forcings” all the way down to zero. I have a web page on this topic, here:
https://sealevel.info/feedbacks.html
Good article!
“Furthermore, it’s not “cumulative carbon emissions” which affect temperatures, it’s the concentration of CO2 currently in the atmosphere.”
Or maybe it’s NEITHER of these that can be isolated for reliable attribution, by any means we have available to us, as having caused the reported warming.
Watch from space on what NOAA calls the CO2 Longwave IR band. In these high-resolution visualizations, the radiance at 30C on the brightness temperature scale (yellow) is 10 times the radiance at -90C (white.) See the problem? The motion changes everything about where to expect the energy involved in the static “forcing” to end up. The formation and dissipation of clouds has a lot to do with this. Highly self-regulating.
https://www.star.nesdis.noaa.gov/GOES/fulldisk_band.php?sat=G16&band=16&length=12
So while this post correctly argues against the claims of harmful warming, the framing of the rising GHG concentration as imposing a “forcing” is used. We should instead acknowledge this static concept in theory, but redirect attention to the observed evidence from space which is all about the dynamic response of the real atmosphere. What you see is a huge array of highly active, highly variable emitter elements. It’s not a radiative “trap” as an end result.
Glacier Girl “was buried by snowfall which averaged about 70 feet/year!”
Should that be 7 feet per year?
The planes were first located in 1988 under 264 feet of ice 46 years after they were abandoned. So that’s just over 6 feet a year. Glacier Girl was recovered in 1992. The ice had also moved the planes 2 miles from where they had been abandoned.
That is assuming that their greater density than ice didn’t cause them to sink in the ice, or that regelation didn’t play a role.
https://en.wikipedia.org/wiki/Regelation
Nope. They didn’t even sink significantly in the fairly loose snow that they landed upon. Here’s a photo, taken from a reconnaissance plane, of one of the P-38s which had landed on the ice sheet:
If the planes didn’t sink into the loose snow on the surface, then they certainly couldn’t sink into the denser firn and ice, farther down.
Nor were the planes actually denser than ice, anyhow, when you consider that the fuselages were full of air, and their fuel tanks were nearly empty.
That 264 feet of mostly ice (ice topped by firn and snow), was entirely the result of approximately 70 feet/year of accumulated snowfall.
Nope, it was about seventy (70) feet of snow per year!!
It takes about 11 inches of snow to compact into one inch of ice, and ice was piling up on the abandoned airplanes at around six feet per year.
That’s due to lake/ocean-effect snowfall, because of the nearly coastal location where the planes landed on the ice sheet. Here’s a map, courtesy of NoTricksZone:
Wow!
Greenland is below freezing nearly everywhere, nearly all of the time.
Ice loss or ice gain on Greenland is a function of how much snow fell
in the past, and how much ice calves into the sea today. Temperature
and surface ice melt doesn’t have much to do with it.
During the short Greenland summer there is surface melting, and rivers of blue water disappearing down the moulins produce some dramatic images, but don’t represent much loss of ice if any. Where does that water go once it disappears from view? A short search turns up this 2017 article from the NY Times:
As Greenland Melts, Where’s the Water Going?
Here’s a synopsis:
Research suggests that more meltwater may be trapped inside the ice sheet than previously thought. An experiment measuring a river of meltwater found that not as much flows through the ice sheet and out to sea as previously estimated. It appears that some meltwater is retained in porous ice instead, and models are overestimating the amount of runoff by 20 to 60%.
What’s missing is a physical process that is not currently considered by the models: “Water retention in ice.”
What happens at the bottom of the ice when meltwater gets there is understood largely through modeling.
____________________
That’s six years ago, but silence since then.
Average cumulative mass change in the Greenland Ice Sheet is an annual loss of ~280GT, a loss of ~5000GT over the last 20 years.
This paper discusses where melt water goes, there have been some other recent ones on the topic too.
https://agupubs.onlinelibrary.wiley.com/doi/10.1029/2020GL091418
As per Willis that looks like this, alarmism style
Forgot the pic
And then the punch line
I was responding to Steve’s post, just a mm/yr contribution to sea level rise at present. Also answered his query “Where does that water go once it disappears from view?”
Yet more stupidity from college “educated” idiots.
“ halfway to a tipping point”
Are tipping points approached in a linear fashion or perhaps as a power function?
Then I suppose we ought to consider that the approach is asymptotic.
Tonight’s dinner and wine is a bigger concern.
It probably depends on the type of system to which the inappropriate term is applied.
I would expect it to be a nonlinear process.
It’s kind of like when you put too many naval forces on one side of Guam, it may capsize due to the extra weight.
‘CNBC and the Potsdam Institute (PIK)…’
I know that any ‘appeal to authority’ is potentially a logical fallacy, but could the converse be correct, i.e., the opposite of what these people maintain is probably true?
I sure seems to be the way things are now days. For example the last five Pulitzer Prizes awarded for Journalism are all stories that turned out to be lies and yet not one of the awards has been retracted.
And then there is the Nobel Peace Prize!
One journo did return the prize – Janet Cooke- and it was awarded to runner up. Only one though
Theres 7 or 8 journalism categories covering news , features and investigations since 2017
so more chances for *literary journalism* the fancy name for stories that use techniques from novels to tell stories, or make up lies.
I believe the term used in the financial sector is “a contrarian indicator”.
I’m in western Europe and get “CNBC Europe” as part of what Americans would call my “cable TV package”.
Although I don’t watch it myself one of CNBC’s flagship programmes is “Jim Cramer’s Mad Money”, providing “expert” investing advice to the general public.
From a recent article on the “Seeking Alpha” website …
URL : https://seekingalpha.com/article/4590547-inverse-jim-cramer-strategy-q1-2023
In general this sort of strategy only works as long as the person or organisation doesn’t realise exactly why you are paying such close, and serious, attention to their “projections”.
“(Aside: Petagram ≡ gigatonne ≡ Gt, and “PgC” means “petagram of carbon,” so 1 PgC = 1 Gt of carbon (GtC). 1 ppmv CO2 = 7.8024 Gt CO2 = 2.12940 PgC.)”
Thanks for defining the term. I was about to ask.
A lot of people in the “climate biz” use units and terminology which sometimes seem intentionally obscure, or even intentionally misleading.
E.g., “BP” literally stands for “before present,” but it actually means “before 1950.”
Likewise, “1.5°C of warming” doesn’t actually mean 1.5 °C warmer. Instead, it means 1.5 °C warmer than the chilly “pre-industrial” late Little Ice Age (1850-1900), but only 0.23 to 0.48 °C warmer than now. (They don’t really know how much warmer that is, because they don’t know how cold it was in the late 1800s.)
The other day I ran into someone who is convinced that “420 ppm CO2” (the reported current average atmospheric CO2 concentration) means parts per million by mass. It doesn’t. It actually means the dry molar fraction, in µmol/mol, which is (almost exactly) a volume ratio, not a mass ratio. His confusion could have been avoided if NOAA would just write “ppmv” rather than “ppm,” to avoid ambiguity.
To facilitate deciphering climate industry obfuscation, I probably need to add more measurement units to my glossary: terms like “Olympic swimming pools” and “Lake Eries” for water & ice volume, “Hiroshimas” for radiative forcing, Manhattans for ice extent, “zettajoules” for water temperature, etc.
IF Southern Greenland coastal sea surface temp reached ‘x’, degrees Celsius, then how long would it take, years ‘y’, to melt a Greenland-glacier-sized solid ice volume (rectangular surface area). Then you get the “melting ice cubes don’t overflow a full cup” problem.I’m not sure what temperature I’d use to model land ice melt rate. Surface air temp, I suppose. Professors give these intractable-seeming, detail-oriented, math-intensive puzzles to very smart kids with zero real world experience.
..because they’re “inexperienced” enough to try it for free?
Teacup analogy only valid in ocean, not on land. Still, one extra kilometer cube water would probably not even register on a beach in Wookapookie.
I think you missed the best quotes from the CNBC article:
Well, that makes it an emergency, doesn’t it?
From the CNBC article:
Does that run on Playstation 5 or Xbox Series X?
I hardly ever go a week without seeing a report or article of some kind declaring the doom of the Greenland Icesheet on my MSN “news” feed. About one a week reporting some great catastrophe from somewhere in Antarctica too. They are relentless.
Catastrophe gets clicks
Excellent, this needs wide distribution.
Greenland is increasing in both permanent ice extent and elevation. It will have 100% permanent ice cover by 2100 at the present rate of accumulation.
From Jan 2007 to Jan 2023, the global average temperature was down by 0.09C. Siberia set new lowest ever recorded temperature on Earth’s surface. Most of the Arctic region was up by 4C but most of Antarctic region was down by 4C.
https://neo.gsfc.nasa.gov/view.php?datasetId=GISS_TA_M
In the 16 years from Jan 2007 to Jan 2023 almost every square metre of the equatorial Indian Ocean has ABSORBED 2E13 joules. That is the NET input of radiated energy into the atmosphere over the region. Over those 16 years every 6 sq.m of the equatorial Indian Ocean has absorbed the equivalent energy of the Hiroshima bomb. The temperature difference Jan to Jan after the uptake of all that energy, is zero. Anyone who thinks that Earth’s surface temperature can be derived by applying a local radiative energy balance has no understanding of physics. The concept of “greenhouse effect” influencing Earth’s energy balance and surface temperature is garbage.
Warming oceans in the Northern Hemisphere are a precursor to land ice accumulation and the termination of the current interglacial:
This statement is imprecise because the amount of moisture is a function of the elevation and the surface temperature. There is very little moisture in the air over the Greenland plateau but the January surface temperature has increased almost 10C in the last 70 years so is holding a lot more moisture that results in more snowfall.
“Yet we’ve only gotten an estimated 1.02 to 1.27 °C of warming from all that CO2.”
Sorry but that is still a huge overestimate, true only if all warming since 1950 is attributed to CO2, when the evidence for climate change being driven by the level of solar activity is 28 times stronger than the evidence for CO2.
At most the “climate sensitivity” forcing-multiplier is zero (almost certainly it is negative, or stabilizing), leading to a maximum CO2 driven warming of about 0.5 °C.
28 times stronger? The last 700 or 750 years all fit with a solar explanation. Before 1700 there were 400+ years of low solar activity, with an average sunspot number of about 40.
Those four hundred years were the period of saw-toothed cooling that is called The Little Ice Age.
Since 1700 solar activity has been high (average SSN of about 80), which has coincided with 300+ years of sawtoothed warming.
That’s 700+ years of very solid evidence that low solar activity causes cooling and high solar activity causes warming.
In contrast, the CO2-driven theory of climate change only fits with 25 years of climate history: from 1975 to 2000.
The warming from 1700 to 1950 can’t have been caused by human increments to atmospheric CO2 because they were much too small.
(To have accounted for the small forcing effect of CO2 at that point these forcings would have to have been multiplied up many times by water vapor feedback effects, implying an unstable climate, which is counterfactual, being inconsistent with climate history more broadly.)
From 1950 to 1975 the planet was cooling, and after 2000 there has been much less warming than the CO2 theory predicts.
So the solar theory fits with 28 times as much climate history as CO2 (700+ years vs. 25 yrs), and of course that is just the start.
But it’s a simple fix. Just qualify the lead sentence by adding: “thus even if we accept the radically implausible ‘consensus’ assumption that all recent warming was caused by CO2, their conclusions are still highly inflated.”
Always good to keep the climate alarmists’ larger frauds in mind, and in reader’s minds.
I think “tipping points” only apply to the kiddy teeter-totters on school playgrounds, ( if they are still allowed).
What do you and what do they believe is the climate sensitivity of CO2? I believe that it is zero. The IPCC does not really know since for decades they just publish a range of guesses. Pf’course the IPCC is not really sure of anything since they preface everything with an arbitrary assessment of confidence. The Edmian was warmer than the current interglacial period with higher sea levers and more icecap melting even though CO2 levels were lower than today, yet no climate tipping point ever happened. It was also warmer during the climate optimum of our current interglacial period yet there was no climate tipping point.
There are so many factors affecting temperatures that exact figures for “climate sensitivity” to changes in CO2 concentration are impossible to determine. But, based on comparing historical trends in temperature to concurrent changes in GHG levels, ECS is probably only about 1.5 °C / doubling, and TCR is only 2/3 to 3/4 of that.
The exact figures you find will depend on whose temperature estimates you use, and what time periods you choose. Here’s where I did that exercise a few years ago, using a period chosen to start and end in similar ENSO-neutral conditions:
https://sealevel.info/sensitivity.html
Alternately, you can just use the entire record of anthropogenic CO2 increases. Due to the increase of CO2 concentration from 280 ppmv to 420 ppmv, we’ve already had 58% of the “radiative forcing” which we would get from a doubling of CO2. At the same time, we’ve had perhaps 1.1 °C of averaged global warming, of which at most perhaps 2/3 could be attributed to the CO2 rise.
Even if you attribute all of that 1.1 °C of warming to anthropogenic GHGs (which I doubt is correct), you’ll still find a “practical sensitivity” (roughly the average of ECS & TCR) = (2/3) × 1.1°C / 0.58 = only 1.3 °C / doubling.
If TCR = 3/4 of ECS, we have two equations and two unknowns:
(ECS+TCR)/2 = 1.3
TCR = 0.75×ECS
So:
ECS = 1.486
TCR = 1.114
Or if TCR = 2/3 of ECS:
ECS = 1.560
TCR = 1.040
It is well-nigh impossible to approach the IPCC’s “central” estimate of 3°C / doubling with this sort of analysis.
Thank you for your reply. So you do not really know. You cannot rely upon historical temperature data because one cannot determine how much of the temperature change is caused by factors other than a change in CO2 One needs to apply atmospheric physics. I have always thought that if adding CO2 to the atmosphere really caused surface warming that the increase in CO2 over the past 30 years should have caused at least a measurable increase in the dry lapse rate in the troposphere but that has not happened.
.
The main problem with the “old” ECS and TCR measures of “climate sensitivity” (see Dave Burton’s reply just before mine) is that the climate modellers have to run the models for a long (simulated) “time” before they can read off the answers.
For ECS you typically have to input a “step” or “ramp” or “S-curve” and hold the atmospheric CO2 concentrations steady at the 2xCO2 (or 4xCO2) level for a few centuries before the model reaches a new “equilibrium”.
For TCS you have to get to the 2xCO2 level so that you can answer the question “What’s the delta-T as that level is passed through ?”.
With the AR6 cycle of documents, starting with the SR1.5 special report in 2018, the IPCC introduced the notion of “TCRE”, or “Transient Climate Response to Cumulative Carbon-dioxide Emissions”, which is explained in the Technical Summary of the WG-I contribution to the AR6 cycle (“The Physical Science Basis”, section TS.3.2.1, page 94) :
Notes
– This is limited to “CO2 emissions”, not (all / combined) “greenhouse gas (GHG) emissions”.
– For one viewpoint of the lack of correlation of the TCRE conjecture with a historical GMST anomaly dataset (HadCRUT5 in my case) see my exchange with poster “JCM” under WUWT’s re-post of Judith Curry’s “UN’s climate panic is more politics than science” WUWT article.URL : https://wattsupwiththat.com/2023/03/30/uns-climate-panic-is-more-politics-than-science/#comment-3701921
– Using “cumulative CO2 emissions since 1850” allows the IPCC to discard all “weather” events that happened from 4 billion BC (the Hadean era) to 1850, simply by resetting the counter to “1850 = 0”.
– – – – –
NB : I am still a long way from editing all this into a “clean and clear chain of reasoning” !
This is all still at the “stream of consciousness / throw everything at the wall and see what sticks” stage.
CO2 emissions since 1850 have been monotonically increasing. This allows the IPCC to use “cumulative CO2 emissions” as an alternative X-axis to the standard “calendar year” choice.
This weekend I got to wondering how, or even if, that change would “distort” the visualisation of the GMST proxies.
The result is shown in the attached graph.
[ With my computer setup I can only attach one graphic per post … ]
In the AR6 WG-I assessment report there is an entire section detailing the TCRE concept, and how it is used to calculate “carbon budgets” under different emission pathways.
This is summarised in Figure 5.31 on page 750, which is attached below.
Note that the IPCC admits that there are “unrepresented Earth system feedbacks” which mean that GMST anomalies aren’t 100% correlated with (cumulative) CO2 emissions, but they claim an “empirical” linear relationship that holds in the computer models up to “at least 1500 PgC” (as the ATL article notes, 1 PgC = 1 GtC), while the current “counter” for cumulative CO2 emissions since 1850 is (probably ???) in the 625 to 650 GtC range.
From the conclusion to section 5.5.1.2.1, “Sensitivity to amount of cumulative CO2 emissions“, of the AR6 WG-I report (on page 746) :
The IPCC is pretty “confident” about using TCRE as a measure of “climate sensitivity” to CO2 emissions — as opposed to the “historical” focus on how sensitive the Earth’s surface is to CO2 atmospheric concentrations — for the foreseeable future.
Thank you for educating me, Mark!
I don’t know who you are, but I’ll be grateful if you drop me an email.
In other words, the IPCC would have you believe, not merely that CO2 in the atmosphere has a warming effect, but that the memory by Gaia of CO2, which was once in the atmosphere, has a warming effect.
They reach that conclusion by noting the unremarkable fact that two things which have both been increasing for the last 170 years are therefore correlated, and then asserting (with “high confidence”) that that means one causes the other, even though there’s no plausible physical mechanism by which it could cause the other. It is every bit as ridiculous as blaming bedsheet strangulation on cheese consumption.
It astonishes me that something so obviously nonsensical could be accepted and published by so-called “scientists,” even in the IPCC. I was an AR6 WG1 Expert Reviewer, but I did not notice that particularly pure nugget of 24 karat craziness. I only read part of the 2409-page Report, and I unfortunately missed that part.
I wish that I’d noticed it, because it would have been so very easy to ridicule. It’s even more idiotic than the nonsense which I did notice and complain about.
Thie IPCC does not know what the climate sensitivity of CO2 actually is and apparently you do not know either. Without actually knowing this, how our global climate will change by adding cO2 to the atmosphere is just speculation. In general mankind does not know what the optimum global climate is let alone how to achieve it.
BTW, I invited Catherine Clifford and Dennis Höning (by both tweet and email) to join the discussion here, but neither of them has responded.
Dennis Höning replied to my tweet, but it doesn’t appear that he intends to participate in the discussion here.