March 2023 ENSO update: no more La Niña!
BY EMILY BECKER – originally published on NOAA’s Climate.gov
La Niña—the cool phase of the El Niño-Southern Oscillation (ENSO) climate pattern—has left the building! After a year and half of non-stop La Niña, the tropical Pacific ocean-atmosphere system has transitioned to neutral, allowing NOAA to issue its “Final La Niña Advisory”. What can we expect for ENSO through the summer and into next fall and winter? I’ll get to that!
Get outta town
First, though, let’s bid La Niña adieu. The most recent weekly measurement of the sea surface temperature in the Niño-3.4 region (our primary monitoring region for La Niña and El Niño) was a mere -0.2°C (-0.4˚ F) compared to the long-term average. (To calculate a change in temperature in degrees Celsius to Fahrenheit, multiply by 1.8.) Also, the latest monthly value from the OISSTv2.1 dataset was -0.4°C (-0.7˚ F) for this same region. The threshold for La Niña is cooler than -0.5 °C, so we can say the ocean surface has moved away from La Niña.

The atmosphere is a little more complicated, as it tends to be! We still see some indications of a La Niña-like strengthened Walker circulation, with more rain and clouds than average over Indonesia, less over the central Pacific, and enhanced trade winds. However, without the cooler sea surface characteristic of La Niña, it’s likely this pattern will diminish in the coming weeks.
One measure of the atmospheric component of ENSO is the Equatorial Southern Oscillation Index (EQSOI), which measures the relationship between surface air pressure in the western and eastern Pacific. When this index is positive, it indicates that the Walker circulation is amped up. In February, after nearly a year at or above 1.0, the EQSOI was just 0.1 This tells us that at least one element of the atmospheric La Niña response has weakened.
We’re often going on and on here at the ENSO Blog about how ENSO is a seasonal phenomenon, meaning the ocean and atmosphere criteria must be met for several consecutive months in order to qualify as La Niña or El Niño. The same is not true for neutral conditions, however. Once the tropical Pacific ocean-atmosphere system is showing signs of decoupling, such as a monthly Niño-3.4 index value warmer than -0.5 °C, we can say that neutral conditions have likely arrived.
Spring breakers
The forecaster consensus is indeed very confident that neutral conditions will remain through the spring. We know what you’re really interested in, though—will El Niño develop? If we can anticipate an El Niño, we can anticipate an increased likelihood of its impacts on weather and climate. In contrast, a continuation of neutral conditions means the tropical Pacific Ocean will not be an actor on the world’s climate stage. The lack of El Niño or La Niña means that there is no seasonal-scale influence from the Pacific to push around the global atmospheric circulation and influence seasonal climate patterns.
Many of our computer climate models are predicting a transition into El Niño sometime later this year. However, right now is a very tricky time of year for the models, due to the “spring predictability barrier.” ENSO events peak in the winter and tend to decay and transition in the spring, so models often don’t have a lot of strong signals to go on. (Why do ENSO events peak in the winter?? This is a really complicated topic that we don’t have a simple, satisfactory answer to… (yet!)

Our forecaster consensus does reflect the increased chance of El Niño, with chances around 60% by the fall. However, the spring predictability barrier, together with the still somewhat-La Niña-ish atmosphere and the lack of strong physical signs such as a large amount of warmer-than-average subsurface water in the tropical Pacific, mean we’re not yet hoisting an El Niño Watch.
One fun little nugget of information is that, in our historical record dating back to 1950, we have not gone more than four years in a row without an El Niño. If we don’t have an El Niño in 2023–24, that will be five years! However, 73 years is a short record for a phenomenon that has decade-to-decade variability, so this is more of an interesting factoid than anything.
Meanwhile, in Peru
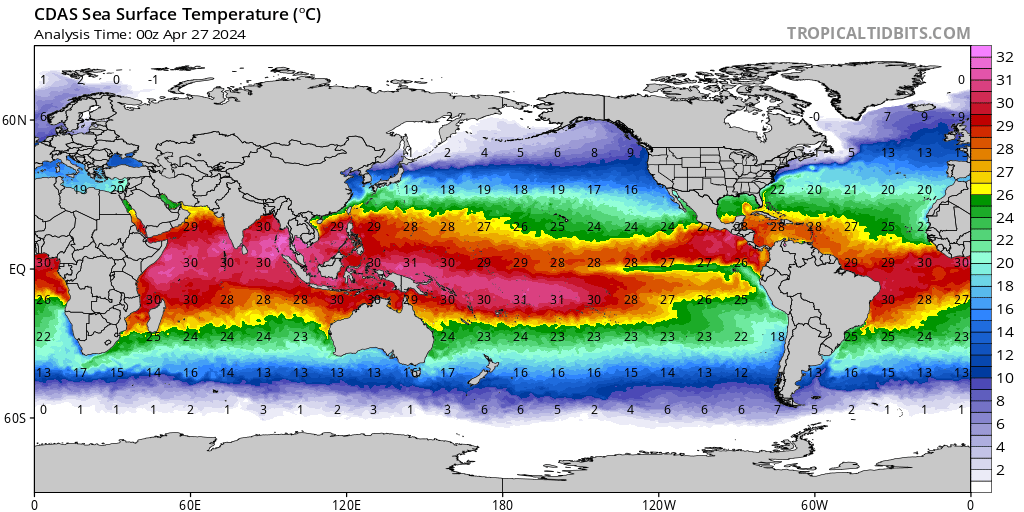
In the sea surface temperature animation above, you might notice a red patch growing off the coast of Peru in recent weeks. ENFEN (Peru’s commission on ENSO) recently issued a notice about the potential for a Coastal El Niño, an event which can have very significant consequences for rainfall in Peru. Coastal El Niño events can also spread west, preceding El Niño conditions in the Niño-3.4 region, so it’s something to keep an eye on. For more on the relationship between Coastal and larger-scale El Niño, check out this conversation between Michelle and friend-of-the-Blog Ken Takahashi back in 2017 (during the last coastal El Niño event), and Ken’s post about extreme El Niños.
I reached out to Ken about current events, and he pointed out that the Madden-Julian Oscillation, an area of increased storms that travels eastward around the equator over the course of one to two months, is in a phase that directly impacts Peru. Taken with the warm ocean surface, this is “a dangerous combination that may result in even heavier rainfall than what has already started to fall onto the northern coast of Peru,” he said.
Around-the-world cruise
As I mentioned above, the reason we care so much about El Niño and La Niña is that they can often be predicted months in advance, meaning we can get an early idea of some of our potential seasonal climate conditions. For example, the southeast coast of Africa tends to be cooler and wetter than average in December–February during La Niña.

Now that this La Niña has concluded, let’s take a look at how the December–February rain/snow and temperature patterns shook out around the world. In a couple of weeks, Tom will get into the winter weather in the United States, so stay tuned for a closer look there.

The first thing that jumps out here is the increased rain through the Maritime continent and northern Australia, and the dry region in the central Pacific, both expected La Niña impacts. Many of the more remote impacts that are common with La Niña, including increased rainfall in southeastern Africa and northeastern South America, and drier conditions around Uruguay, are also apparent here.

La Niña is linked to some cooler-than-average global impacts, including in western Africa, eastern Brazil, and eastern Asia. We don’t expect every ENSO impact to show up every winter—with random weather variations and the influence of climate change, ENSO is hardly the only player on the field—but overall, it’s not surprising that the December–February global patterns resemble the La Niña impacts.
If you dropped in today to get the final chapter of the daily temperature investigation (see parts 1, 2, 3), I’m sorry—there was just too much to cover this month. With at least a few months of neutral conditions expected, I will wrap that up in coming posts. See you in April!
Anthony, thanks for the ENSO update.
The last time I checked (a couple of weeks ago) there was a LOT of warm water in the west Pacific warm pool to depths of 300 meters, just waiting for a number of westerly wind bursts to drive that warm water eastward along the Cromwell current and create the next El Nino. We’ll have to wait to see if we get those westerly wind bursts later this year.
Regards,
Bob
The heat that is now stored in the West Pacific warm pool will enter the atmosphere in the next El Niño, so the atmosphere will warm, but that heat will be lost through radiant cooling to space as it moves through the atmosphere. The atmosphere is not warming now because the heat is stored in the deep warm pool. The system as a whole (ocean and atmosphere) has more heat now, but the atmosphere is cooler. When the heat is released the system will be cooling again, but the atmosphere will warm. That tell us how meaningless a global, average atmospheric temperature really is. When the atmosphere is warm, it’s cooling. I think the same hold true for a warm North Pole, which we have had for the past several decades. When the North Pole is warm, the planet is cooling.
Sunspot activity has exceeded my decadal sun-ocean warming threshold, leading to warming.
The equatorial region is predictably changing due to the solar activity increase in sunspots/TSI; as the sun progresses towards it’s next maximum, the ocean progresses to the next El Nino:
Well, California is very wet, which is typical of an El Niño. So should Australian be dry? Texas has been dry, but it is not quite as affected by ENSO.
In SE Queensland, it was like someone threw a switch in late November – the rains stopped or when they fell it was not much. December rain in Gympie was about 1/3rd of the longterm average; January ~5% of ‘normal*’; February about 60%; and nothing in March until yesterday, and still only half of what was forecast. A cool summer too, even though mostly dry.
North Queensland has been fairy wet, though, so maybe some La Niña is hanging around.
*Last year there were 3 major floods in Gympie, so the contrast with this year is striking and the idea of a monthly ‘normal’ rainfall is very ridiculous.
The whole top end of Australia is wet. Including WA..
Folks have time to find this book:
El Niño: Unlocking the Secrets of the Master Weather-Maker
(2002) by J. Madeleine Nash
Paperbacks are available for under $10.00.
I read the hardback 20 years ago so can’t say much about it now.
I do still have it and may get back to it.
El Niño may not be a done deal just yet – note that both statistical & dynamical models have generally over estimated future SST’s in the tropical Pacific over the last couple years. Let’s wait & see how this plays out ….
Anthony:
I have had an article published titled “The Definitive Cause of La Nina and El Nino events”
The abstract is as follows “Rather than being strictly random events, it has been proven that all La Ninas and El Ninos are caused by the increase or decrease of reflective SO2 aerosols in Earth’s atmosphere, from both volcanic eruptions and industrial activity.
Although volcanic eruptions are random events, an eruption usually signifies a forthcoming La Nina/El Nino cycle, and thus can have some predictive value”
https://doi.org/10.30574/wjarr.2023.17.1.0124
It will help to understand what is now happening, but a later article “The Cause of Atmospheric Rivers” provides additional clarification
https://doi.org/10.30574/wjarr.2023.17.2.0123
Somebody please tell me when it’s going to stop raining here on the Oregon Coast.
For sure on the next clear sunny day, unless of course it’s cloudy and stops then anyway.
Impressive model.
First one I have seen that generates 100% accurate predictions! Congratulations.
In my experience it was always 5 July when the rains went into diapause, the day after the annual departmental whitewater rafting trip and picnic.
To convert from C to F, multiply by 1.8!
Where did that come from?
Some of the younger “journalists”t in the UK MSM have great difficulty with the conversion. Temperature difference and actual temperature giving different answers.
A temperature 5’C = 41’F
A difference of 5’C = 9’F
I have seen the former for the latter more than once
a change of 1 degree C is ~= 1.8 degrees F
Not approximate. It is 1.8 degrees F.
To go from water freezing to water boiling in C is 100 degrees. In F it’s 180 (212 – 32) degrees.
180/100 = 1.8.
Of course you still need to add 32 to complete the conversion.
The conversion factor is for delta T, the anomaly which is what you have in your example, but converting to actual temperatures you have to add the 32F.
This is correct for converting temperature anomalies which are delta T.
Another cold fronts from the north will bring record snowfall to the mountains of northern California.

It’s a long way from El Niño, especially since sea surface temperatures are about to drop in the southern hemisphere.

But the beginning of eastward current flow along the equator is indicative that the Panama warm pool is winning the equatorial tug-of-war with PNG.
This switch occurred this week and will strengthen once the solar zenith moves north of the equator.
However Northern Australia had a massive downpour this week, which is inconsistent with a change to El Nino but it was from the north rather than the east. It is too late in the season to influence the strongest convection along ITCZ. So water off Panama now heading to be the mid level convergence zone but still months from an established El Nino.
Southern Oscillation IndexThe 30-day Southern Oscillation Index (SOI) for the 30 days ending 26 February 2023 was +11.6, while the 90-day SOI value was +14.6. The 30-day SOI has decreased slightly over the past week to two weeks.
Sustained positive values of the SOI above +7 typically indicate La Niña, while sustained negative values below −7 typically indicate El Niño. Values between +7 and −7 generally indicate neutral conditions.
http://www.bom.gov.au/clim_data/IDCKGSM000/soi30.png?1678431432
The spring predictability barrier is for sissies. We are getting a Niño after the summer.
Why do storms get names and Niños y Niñas don’t? It seems only appropriate that we name them, being children.
Arguments, evidence, observations?
http://www.bom.gov.au/archive/oceanography/ocean_anals/IDYOC007/IDYOC007.202303.gif
No evidence or observations are possible for the future. What kind of question is that?
Three reasons:
(1) Statistics. Niños happen at least once in a 5-year period, but usually 2-3 times. For 2023 the last 4 years only had 1 Niño. A new Niño is more probable than any other option. Niñas and neutral years may not happen for 5 years in a row.
(2) Solar activity. The fourth year of a solar cycle is the third most probable year of a cycle to have a Niño, after the first year and the sixth year.
(3) Warm water accumulation. After 3 years of Niñas, the warm water volume anomaly in the equatorial Pacific is positive. This is a Niño predictor.
I would say 4 to 1 chances of Niño, and the predictability barrier be damned.
2024 is more likely to be a neutral year. I think I could make a prediction for the next 20 years and be at least 50% correct, which would not be bad considering that there are three possibilities for each year.
Yes Javier, and you should name them in Spanish!
OK, next Niño gets my name (Javier). I expect it to be smallish, but I am not too tall either.
How often do we get two strong Ninos or Ninas in a single year?
Labeling them by the year in which they occurred is sufficient. Since we almost always get multiple strong hurricanes in a year, using the year alone is insufficient.
ENSO is phase-locked to the boreal winter. A year’s condition is decided by its January condition.
From the article: “One fun little nugget of information is that, in our historical record dating back to 1950, we have not gone more than four years in a row without an El Niño.”
So El Niño conditions did not prevent the temperatures from cooling by about 2.0C from the 1950’s to the 1970’s. It appears El Niño is not the control knob of the Earth’s climate, either. Back to the drawing board!
ENSO is part of the global meridional heat transport system. ENSO does not control heat transport. Heat transport controls ENSO.
During the Holocene Climate Optimum, the planet was a lot warmer and there were no Niños. The Pacific was in semi-permanent Niña condition. The need to transport heat poleward was less, so Niños were not required by the transport system.
The article says nobody knows why ENSO is phase-locked to the annual cycle. In reality, it is a very easy question to answer. It is locked to the Northern Hemisphere winter atmospheric circulation because meridional transport is asymmetric and the colder NH winter requires more heat from the tropics. ENSO contributes to providing that heat on demand.
Javier Vinos.
Balderdash!
What would you know? You are a one-trick SO2 pony. The climate is a lot more complex than you can fathom.
Javier Vinos:
No, the climate is NOT complex. Every aspect of our climate can be explained by increasing or decreasing levels of SO2 aerosols in our atmosphere.
Educate yourself. Read my papers on Google scholar.
You have been misled by accepting as truth garbage papers and books that others have written..
Tom Abbott:
You are entirely correct.
You need to read my post earlier in this thread.
The change in climate more than average are global problems. Every region are experiencing change of temperature . All these are global warming problems that are caused by humans. We are facing the result of harming environment system.
For any visit us on Energy Environmental Solutions http://sourcetester.org/
Spammage.
In your opinion, any change must be caused by global warming?
Prior to global warming nothing ever changed in the weather system?
Ironically, for people living in the northeastern US, low to moderate El Niño usually means a cold snowy winter.
In Spain, an El Niño this winter will mean the end of a three-year drought, so it will be very welcomed.
wait – I thought we were in for a prolonged cooling due to low sun activity in the last decade – some were calling it another mini ice age???
That prediction is ‘on ice’….
We got the “Double Pause”® instead, so no complaints on my part.
Wishing for severe cooling in the midst of an energy crisis is not wise.
I have no knowledge of climatology, apart from what I read, from knowledgeable contributors both here and in books etc.
But just looking at the two maps above, for precipitation and temperature, the various areas look as though they are completely randomly scattered. There must be some reason behind the formations, which I suspect, humankind is far from understanding the connections as yet.
So, the thought does strike me, if climate does appear as random, how on earth, can the IPCC climatologist, model and project the outcome of such a very complex subject, with such a degree of certainty, without crossing their fingers?
well their track record of 0 correct predictions should be the answer
🙂
Thanks Anthony!
Who erected “the spring predictability barrier”, and how scientific is it?
It’s your “out” if you are wrong, of which the nino/a predictions are about 50% of the time.
It is the boreal-spring predictability barrier, which should tell you what is all about. ENSO is locked to the boreal winter, so when the boreal spring arrives the previous phase is ending and the new phase hasn’t started so it hasn’t shown its true colors yet.
I note the low temperature in the southern Pacific, where the Humboldt Current originates.

The satellite record clearly shows MOST of the warming (during the satellite era) has been STEPWISE Temperature Jumps associated with ENSO Events. How does CO2 trigger El Nino’s? The sun directly warms the tropical ocean waters and the winds blow the waters West or East generating ENSO EVENTS. Where does CO2 fit in this? Direct Solar heating is 3 (maybe 4) orders of magnitude greater than CO2 LWIR paltry effect on ocean surface heating… the CO2 ENSO efffect is a rounding error.
Love that…CO2 LWIR paltry …
DocSsiders:
The actual sequence is that temperatures first rise, causing an El Nino to form.
The cause of the temperature rise is a decrease in the amount of dimming SO2 aerosols circulating in the atmosphere. CO2 has no detectable role in the process, as you have surmised
https//doi.org/10.30574/wjarr.2023.17.1.0124
DocSiders:
I need to re-enter the link:
https://doi.org/10.30574/wjarr.2023.17.1.0124