Jennifer Marohasy
When the Bureau called a new record hot day for 23rd September 2017, based on the instantaneous spot value from a platinum resistance probe in an automatic weather station at Mildura, I wanted to know the maximum temperature recorded by the mercury thermometer on that day as a check.
I wanted to compare the new record temperature with the temperature as recorded by the mercury at the same weather station, for verification.
I understood that Mildura was one of the few official recording stations with parallel data.
I had asked The Australian Bureau of Meteorology for this type of data before and been ignored. On this occasion I contacted 2GB radio host Alan Jones. He intervened on my behalf contacting the relevant government minister.
The Bureau claimed the temperature on 23rd September 2017 to be the hottest day ever for Victoria since records began back in 1889.
But as I explained to Alan Jones, there weren’t probes measuring temperatures back then; rather mercury thermometers. So, I wanted to know how much the mercury had measured on 23rd September 2017, the claimed record hottest day.
In short, I really wanted to see the A8 Form for 23rd September 2017, to know what had been written down for the maximum temperature from the mercury and compare this against the spot reading for the probe. To check, to verify. This should be standard practice when calling a new record hot day, but it’s not.
Instead of being provided with that one day of data, I acquired 10,761 scanned A8 Forms for Mildura. But not the form for 23rd September 2017.
Apparently, the mercury had been removed sometime in 2015. So, so disappointing, I thought.
But nevertheless, I thought, with all this data I can know how the newest probe records relative to the mercury including during September 2012, 2013 and 2014.
Except, there are no recordings from the mercury for September 2013 and 2014, and September 2012 has so far been withheld.
“Thirty days hath September, April, June and November …” is a traditional mnemonic verse for remembering the number of days in each month.
I really just wanted the temperatures as written on the A8 Form for 23rd September 2017. But denied that, then for other Septembers for Mildura from the same probe, please, so I can compare values for the same location for the same month. I could see that there was seasonal variation in the difference between the first two probes used at Mildura and the temperature as recorded from the mercury thermometer.
I wrote to Anthony at the Australian Bureau of Meteorology about this in January and then February 2018.
EMAIL #1
From: Jennifer Marohasy
Date: 24 January 2018 at 3:14:19 pm AEDT
To: Anthony R
Subject: Missing A8Forms, September 2012Hi Anthony,
My best wishes to you for 2018.
I took some time-off over Christmas and New Year, and I am now back transcribing the scanned A8 forms that you so kindly provided to me early December.
I was intending to transcribe September 2012 today, but I have found that this month is missing. It is not on the USB that you emailed me, nor was it one of the months that you originally uploaded at the FTP drive.
Perhaps this month in that year was never actually scanned?
Could the September 2012 A8 forms please be scanned, and provided to me… so the record is complete?Kind regards Jennifer
EMAIL #2
From: Anthony R
Date: Tue, Jan 30, 2018 at 9:38 PM
Subject: RE: Missing A8Forms, September 2012 [SEC=UNCLASSIFIED] To: Jennifer MarohasyDear Jennifer
Thanks for bringing this to my attention. I have just returned from leave but will follow up on the missing month of data now.
Kind regards Anthony
EMAIL #3
From: Jennifer Marohasy
Date: Mon, Feb 12, 2018 at 11:09 AM
To: Anthony RHi Anthony
I have tried to phone you a couple of times chasing this data: the scanned A8 forms for September 2012. I left a message on your phone again this morning.
When can you make the scanned A8 forms for September 2012 available to me? I had not initially realized how critical that month of data is.
When you first wrote to me you indicate that there were parallel readings through until January 2015. So, I had assumed that there would be at least three Septembers (2012, 2013, 2014) with parallel data from the current Rosemount probe installed in June 2012.
When I wrote to you on 24 January 2018 explaining that the month of September 2012 was missing, I had not yet realized that the months of 2013 and 2014 (while scanned) did not actually have any recordings from a mercury thermometer i.e. no parallel readings. I had been working slowly through the forms chronologically.
You had initially indicated, and I quote from your email of 28 October 2017:
“A8 records also exist from 1 January 2001 to 28 January 2015 and these are in the process of being extracted from archive and scanned. The scanning is a labour-intensive activity and will take some time to complete… As the station was automated in 2015 there are no liquid-in-glass measurements for 23 September 2017.”I don’t much believe in conspiracy theories, but it does seem somewhat suspicious that you have provided me with over 10,000 scanned pages representing a complete record for all the A8 forms from Mildura for the period 1 January 1989 to 31st January 2015, with the only exception being September 2012 – with every day for that month missing.
Of course, given the available manual recordings from the mercury thermometer this would be the only month of data that would provide a direct comparison with the recording on 23 September 2017; apparently the hottest day every recorded in Victoria since 1889.
Kind regards Jennifer
*****
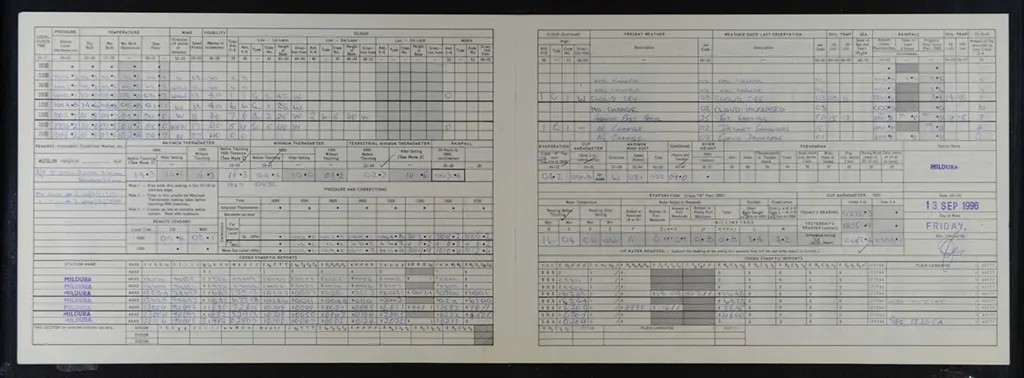
The feature image is a scanned A8 Form from 13th September 1996. This is the last September that the mercury was the official recording instrument at Mildura, from 1 November 1996 there was a change to the probe. An unusually cold 14.3C was recorded from the mercury as the maximum at 9am that morning, this being the maximum for the day before. Those interested in chasing down such things will see that this is also the maximum temperature recorded in the ADAM data archive for meteorology for 12th September 1996. Interesting the ACORN-SAT data base, used by the Bureau to understand climate variability and change, shows 15.1C for that day. To be clear, through remodelling alone the Bureau has changed this maximum daily value by 0.8C. Such dramatic changes via remodelling, also known as homogenisation, are not unusual.
Digital temperature readings need surrounding before and after confirmation. Say, 1%? Kelvin.
“The Bureau claimed the temperature on 23rd September 2017 to be the hottest day ever for Victoria since records began back in 1889.”
Really? I don’t believe you. Please quote what they really said.
Maybe the hottest September day? Maybe the hottest Sept 23?
Does anybody really care what the exact temperature was on the hottest Victorian Sept 23 ever? Does it really matter if the mercury said something slightly different.
If it doesn’t matter, then why go to such great lengths to protect that particular reading? It’s the apparent cover-up that’s more illuminating than the actual temperature.
It’s bad enough that “homogenization” is at a level far higher than years of alleged warming. Now we have original records apparently discarded because they might suggest dishonesty on the part of the government.
At this point, 30 years past Al Gore’s breathless promise that humans will cause all sorts of planet-ending mayhem within years, the AGW hypothesis is held together solely by homogenizations and outright lies. Ms. Marohasy’s efforts are as important as Erin Brockovich’s in many ways, perhaps more important given the impact of energy insecurity on the poor.
You should understand this, given your screen-name homage to the diminutive CSI tech who pursued the truth, even at great risk.
“If it doesn’t matter, then why go to such great lengths to protect that particular reading?”
Which particular reading? It seems the BoM just gets weary of Jennifer’s obsessions. As far as I can see, the only point of this inquiry is that 37.7 might have been exceeded in the past if a probe had been used instead of LiG. In fact, as I’ve mentioned earlier, BoM had already published their comparison of LiG and thermometer at Mildura, and found that probe was 0.22°C cooler.
I can’t look through all the Vic records, but in September, Mildura is often the hottest place in Victoria, so lets check its highest temps:
[1,] 2017 Sep 23 37.7
[2,] 2003 Sep 22 37.4
[3,] 2012 Sep 27 36.4
[4,] 1965 Sep 25 35.6
[5,] 1961 Sep 30 35.6
The hottest LiG number in that list is 1965, 2.1°C cooler. It is very unlikely that a probe would have added that 2.1.
So, how much would a probe add?
Going through the A8 Forms, after 27 June 2012 and until 31 January 2015, the BoM observer at Mildura omitted to record anything from the mercury on really hot days as measured by the probe. To the extent that the mercury data is not normally distributed.
Considering possible issues with electrical noise, etc. etc.. It has been explained to me, that given the nature of the legacy system in place, it could easily throw values in excess of 5C.
I’m hoping to post on some of the issues with the probes, and the lack of numerical averaging. Meanwhile, you can read something about all the probes not meeting basic standards at Warwick Hughes’s most recent blog post, including ““Bruce Hartley has kindly forwarded ITR 637 summarising the tests on the AWS ADC cards.
The test results on P4 indicate that the 4-wire resistance measurement (which answers an
earlier question of mine) does not perform as well as might be expected”
And from that document we read;
“4. CONCLUSIONS
a) The performance of the resistance channels of the ALMOS AWS does not meet Bureau
Specification A2671 [1] requirement for electrical system accuracy over the full scale range of -10
to 55 °C.”
Here is that hard to obtain document. See attached. ITR637 INSTRUMENT TEST REPORT NUMBER 637 – Summary Report on ALMOS A.W.S. Tests – Jane Warne Senior Physicist Physics Laboratory BoM 21Oct1994
****
http://www.warwickhughes.com/blog/?p=7084
“Considering possible issues with electrical noise, etc. etc.. It has been explained to me, that given the nature of the legacy system in place, it could easily throw values in excess of 5C.”
Hand waving. You’re just making it up.
From the facts Jennifer is listing, you are the one waving their hands.
So typical.
Stokes, you’re really showing a very unedifying side to your nature in this thread. Somewhat akin to a petulant brat who is always used to getting his own way. Sad.
Dear Jennifer,
You know PRT-probes do not give instantaneous spot-values. Yet you still insist they do.
You know the paired t-test is invalid for data-pairs that are autocorrelated, yet you still claim a difference of 0.22 degC is “significant”. Why don’t you place your paired-data file on your web-site like I do on http://www.bomwatch.com.au, so everyone can assess your claims.
You know that control charts are also invalid for processes that are not homogeneous, yet you published several papers based on control charts that should never have passed peer-review.
You don’t need artificial intelligence, just general knowledge and a rudimentary grasp of statistics; or just the internet where you check things out for yourself.
You also should know there is no compulsion for non-bureau sites such as Rutherglen, Wilsons Promontory, Cape Otway, Marble Bar and more … to continue observations after an AWS is installed.
You also know that manual observations ceased at Wilsons Promontory on the day the AWS was installed, and that overlap data are available online for other sites that you have badgered about including Marble Bar.
You have also never observed the weather, never filled-in an A8 field book, which you know is a field-book not a data register. You would NOT know the resolution of a meteorological thermometer because you have never observed one, yet somehow you are an “expert witness” and you are arguing about values that are well within margins of error (uncertainity).
If you have evidence of wide variation such as “I’ve got a difference of +8.6°C between probe and mercury for 8th April 2014” why not put the page up. You have made too many fake claims that I simply don’t believe you.
Your credibility is on the line. For instance, my research of Mildura metadata which I embedded in a reply to your previous WUWT post, found “no mention anywhere of a second dry-bulb probe being installed in May 2000″, yet you were adamant about there being a second probe. Then you changed your story by saying you just assumed all the stuff you previously said about the probe change https://jennifermarohasy.com/2023/02/hyping-maximum-daily-temperatures-part-4/.
Assuming something changed when it didn’t is a major stumble that Jennifer should explain. Perhaps she is in it for the shouting, not the science for example.
In relation to your post on Cape Otway, you said “The Bureau only seemed to replace the maximum in 2002 and for a period of just ten years”. However, the site was run by Parks Victoria, not the Bureau and while metadata records that a dry-bulb thermometer was in-place from 30 October 2002 to 5 December 2012 an expert witness could be expected to know such an instrument is NOT used to measure maximum temperature. This shows how little you know and how much noise you are prepared to make about the little you know.
Just for you, I’ve attached two Google Earth Pro satellite images for the Mildura weather station, which you could have found yourself, but you could not be bothered. On the left is the image for January 2017, on the right is September 2017. See if you can pick the difference. (X marks the weather station site.)
You have been a journey of harassment against the BoM ever since they would not give you parallel data for Wilsons Promontory, which did not exist! Had you actually examined site-summary metadata, which clearly showed the AWS was installed on the day that manual observations ceased, you could have saved yourself and many others that you involved in that fracas, much bother. But you like creating a fracas.
All the best,
Dr Bill Johnston
http://www.bomwatch.com.au
Hi Bill,
“You know PRT-probes do not give instantaneous spot-values. Yet you still insist they do”
I have not really kept up with this discussion, but can you point me to any official info that discuss’ the response times of the PRT probes the stations use and how that faster response time is mapped back to the previous slower response times of the merc in glass, especially in reference to the min/max calc’s.
Cheers
diggs, this stuff is going round and round like white noise in a washing machine.
There are two papers. I have read both and the arguments seem sound (at least unassailable). (The second paper is better than the first, which was based on ad hoc data.)
Had that not been the case I would have requested the data from the Authors and responded. If Jennifer believes her case is meritorious she could have done the same or reviewed the papers on her blog.
The papers are:
https://www.publish.csiro.au/es/pdf/ES19010 (2019), and https://www.publish.csiro.au/es/pdf/ES19032 (2020); both are freely availabe as PDFs.
In my view the thing has been thrashed to death. Jennifer could also have purchased the high frequency data and analysed it for herself. But that is not even the issue.
The issue for me is that Jennifer has not done the research she claims to have done. She has ignored those papers, she did not check metadata, neither did she examine the site using Goole earth Pro; surely a starting point for a competent scientist.
I am most disappoined in the way this argy-bargy develops. Here we are at Part 5. It is not something that shoud be thrashed-out by shouting and blogging for attention. Behind the debate there should also be a cache of credible information and analyses that supports Jennifer’s up-front stories and and opinions.
Lack of competent 3rd party research is mssing in Australia’s climate debate. It is also a void that my colleague and I set out to fill by establishing http://www.bomwatch.com.au.
Marohasy is simply intransigent. She continues to make claims that are not true. As an expert witness, she could be reasonably expected to have checked their veracity. Her credibility as a scientist is actually on the line.
Soon I’ll update and publish the story that I tried to publish about Mildura in 2018 on http://www.bomwatch.com.au. However, this is not about staking-out territory, it is about being factual and presenting empirical data that undermines the Bureau’s methods.
All the best,
Dr Bill Johnston
Contact me: scientist@bomwatch.com.au
Hi Diggs. I notice your question was simply not answered.
The BoM describe the samples incorrectly as follows.
“an instantaneous air temperature is the last valid one-second temperature value in the minute interval;” Quote showing them getting it wrong is from: “Review of the Bureau of
Meteorology’s Automatic Weather Stations” 4.2.4 Instantaneous temperature value to one-minute value,4.2.4.1
The BoM claim that this instantaneous reading is the air temperature. It is not. It is an instantaneous reading of the probe Voltage meters away at the other end of the cable by the AWS electronics. This Voltage indicates probe resistance at that moment plus or minus electrical noise. The resistance in-turn indicates the probe temperature not the air temperature.
Jennifer does not get this wrong. “based on the instantaneous spot value from a platinum resistance probe” Bill mis represents her words.
Your question is about a very different timing however. Response time is not sampling rate. For that see Page 16 of document or 22 of PDF here.
http://www.bom.gov.au/climate/data/acorn-sat/documents/ACORN-SAT_Observation_practices_WEB.pdf
At that link you can see some silly specifications for the dynamic matching like “The aim of the design was to mimic the time constant of the MiG thermometers to within a tolerance of ±5 seconds” Not hard to see if the wind speed is high enough to lower the inglass time constant to 5 seconds then 100% error is accepted.
Are you just playing with words Lance? The question was “but can you point me to any official info that discuss’ the response times of the PRT probes the stations”; my reply was to provide two references. I pointed out the most recent paper was an improvement on the first one.
Did you read the papers Lance?
An instantaneous value would require a very short response time, not 40 to 80 seconds.
You say “Not hard to see if the wind speed is high enough to lower the inglass time constant to 5 seconds then 100% error is accepted”, but what error are you talking about – where is this 100%? or did you just pluck it out of the air.
Do you think the Bureau’s metrology lab does not know what they are doing? Do you have any data Lance, have you analysed anything that supports your claims? After eight years of argy-bargy about 0.001DegC of differences, where are your papers?
I know PRT probes are prone to spiking, I worked with them in the 1980s. Filtering and time-averaging is probably necessary for probes with short response times, but there is no indication from the papers I cited that the Bureau’s probes are especially problematic in that regard.
Section 4.2.4 in the report you cited Lance, shows that both the Almos and the Telmet AWS have an error-trapping routine to identify spikes, which they mark as unavailable.
That is not to say PRT-probes are perfect (whatever that is in the context of measuring temperature of the air), but manually observed meteorological thermometers have well- known uncertainties also.
In comparing probe and thermometer data which instrument does Jennifer consider to the “best” (and why)?
The picture I provided shows the problem at Mildura in September 2017 was a site-related artifact.
All the best,
Bill
Hi guys, read through the papers and the BOM Observation Practices paper. I would agree with Bill on this front, that from a time/integration/lagging perspective, I don’t see any major issues with their process in how they generally mimic the liquid in glass devices. Never going to be perfect, but looks pretty close.
Where they reference the “5 sec” window, I am assuming they mean that the electronic system comes to settle to the correct reading within 5 sec of the LIG probe.
The BOM Observation Practices seems to make it clear is is not an “instantaneous” reading that is reported.
I did find it unusual regarding the fact probes were not calibrated, but were passed if within a tolerance of +/- 0.5 deg. That gives a wiggle window of 1 deg, which is a significant level, however I don’t have enough data to understand if or how they applied that error data to actual observations, so that would be a seperate issue.
It was also somewhat odd they refer to their measurements based on the resistance value then their formula for calculation. Of course this is how all digital meters would ultimately do this in the background. I assume they do it this way because they don’t use a best practice method of a two point hi/low physical calibration on each field probe against a certified reference unit (that would be a big job annually, but would be best practice).
All that aside, the final proof of course is a systematically run parallel process to compare the LIG and Electronic system in the field and analyse the data there, which I assume is the crux of what Jennifer is trying to achieve here, and it seems like a reasonable request. It probably won’t show a systemic error in the way the electronic probes are designed or implemented, but may highlight other issues related specifically to that site, the probes used, site changes, updates etc.
“All that aside, the final proof of course is a systematically run parallel process to compare the LIG and Electronic system in the field and analyse the data there, which I assume is the crux of what Jennifer is trying to achieve here, and it seems like a reasonable request.”
They do that. Trewin describes the results in his ACORN Tech Note BRR-032
http://www.bom.gov.au/climate/change/acorn-sat/documents/BRR-032.pdf
Thanks diggs. I understand from other reports that all probes are laboratory calibrated before they are deployed. However, there would seem be a potential problem in the ‘tails’, which is due to the quadratic relationship between PRT resistance and Tprediced by the probe verses Tthermometer.
Although they have changed since, when I worked with these things in the 1980s, it was difficult to ‘centre’ Tpredicted vs Tthermometer, and still control the ‘tails’. Other reports that Lance alluded to seem to support that conclusion.
Errors, however; are still within the error-band or confidence band (uncertainty) of manual Tthermometer observations, which in Australia (rounded-up) is +/- 0.3 degC.
Yours sincerely,
Bill Johnston
“Where they reference the “5 sec” window, I am assuming they mean that the electronic system comes to settle to the correct reading within 5 sec of the LIG probe.”
There are two wrong assumptions within that both fortunately are easy to prove and do the math for.
The actual description they give for the aim of the dynamic matching is quiet clear on this.
They wrote “The aim of the design was to mimic the time constant of the MiG thermometers to within a tolerance of ±5 seconds.”
The time constant is not the time to settling. That is over 7 time constants. They were attempting to match the dynamic thermal response measured at 1 time constant. By changing the thermal mass vs cooling area of the probe. They describe these changes EG: “The initial probe had a short thick steel…” and “smaller diameter and longer steel probe” Electronics is not involved at this stage. They are matching the thermal dynamics.
Now the math. A “time constant” is defined as the time delay to a 63.2% change of a step change. So for example if the air temperature were to suddenly step up by 10 degrees then th a time constant of 40 Seconds would be allow the thermometers to be 6.32 degrees hotter 40 seconds later. If the LiG is however 40 seconds but the Platinum 35 then the platinum will reach 6.32 earlier. It will actually be 6.81 at 40 seconds after the step. An increase of 0.5 degrees after rounding. The spot readings are of the probe temperature not the air temperature. Remember that at the start of the step the air is 10 degrees warmer than the thermometer. After one time constant of 40 seconds the thermometer is still 3.68 degrees warmer. It does not settle within one time constant.
Correction to my text
“After one time constant of 40 seconds the thermometer is still 3.68 degrees warmer. It does not settle within one time constant.”
Should read
After one time constant of 40 seconds the air temperature is still 3.68 degrees warmer than the thermometer. It does not settle within one time constant.
Hi Nick
I’ve got a difference of +8.6°C between probe and mercury for 8th April 2014. I could keep listing them … from my A8 Forms. That is how much the probe recorded warmer.
And according to the Bom’s relevant propaganda doc: “Mildura reached 37.7 °C on 23 September, setting a new Victorian high temperature record for September. The previous Victorian record for September was 37.4 °C at Mildura on 22 September 2003.
So we have a difference of +0.3, to make a record. And I’ve shown that the probe regularly records +0.4, https://jennifermarohasy.com/2018/02/bom-blast-dubious-record-hot-day/
So what difference would it really make if the record turned out to be in 2003 instead of 2017?
But in any case, both 2003 and 2017 were taken with the same instrument, the probe.
You and the Bureau have cherry picked a start date of about 1946 (only referring to values from the airport site), while the Bureau claimed a record back to 1889 (check the values from the PO site). So go back and have a look for the highest from a mercury. And also remember that the most recent probe is hyping temperatures, while the probe back in 2003 was recording cooler. So we need to compare values from a mercury with the current probe and ideally for September. Oh what a tangled web they weave. :-).
“So go back and have a look for the highest from a mercury.”
The highest at the airport, as said above, was 35.6 °C in 1965.
The PO never got that high. Highest were:
[1,] 1928 Sep 28 35.0 °C
[2,] 1907 Sep 21 35.0 °C
[3,] 1901 Sep 16 34.4 °C
[4,] 1899 Sep 9 34.4 °C
There is no LiG reading within 2 °C of the 37.7 °C record, at either Mildura site.
“the most recent probe is hyping temperatures”
On your numbers, probe and LiG are in excellent agreement after 2012.except for one outlier at about 0.2°C, the differences are evenly balanced around zero, with magnitude < 0.07°C.
A factual difference. Not one made by hand waving homogenization.
No difference at all, except in the minds of low information voters who unwisely believe the biased liberal/progressive government agency/MSM complex about accelerating “unprecedented catastrophic anthropogenic existential threatening global warming”.
+8.6°C is a massive difference. Should never ever get that much if everything working as advertised.
Possible transcription error?
Were you able to look at other local areas on the same day to see which side of the fence the error was likely on (electronic or LIG) ?
“It seems the BoM just gets weary of Jennifer’s obsessions.”
From here they do not seem like obsessions, simply requests for data that the BoM should have, and should have used, in verifying the integrity of their instruments and the consistency of their records. What’s the problem with supplying it?
My impression is that the official records and trends in the US, UK and Australia can’t be trusted. Adjustments, UHI, instrument changes.
And then you get the ridiculous Guardian etc style guide, only talk about global heating, not warming, endless talk about the supposed climate crisis, climate emergency, climate breakdown instead of simply describing the quite un-alarming weather. Every untoward event everywhere in the world, however commonplace, is attributed to this imaginary climate crisis.
Its a sort of mass hysteria which fuels the attempts to find record high temps by any means necessary. You could see last summer in the UK that record national temperatures were being claimed on the basis of one dubious station, and that there were endless proclamations about desperately dangerous high temps, when what was visible to anyone on the ground was no more than a normal, unusually hot, but by no means unprecedented, summer.
Michel,
Adding to the uncertainty is the UAH satellite-based lower troposphere temperature anomaly over the Australian land mass.
No linear least squares warming trend for the 10 years 9 months since April 2012 to end January 2023.
How so? What mechanism?
Is the probe data showing more warming than both UAH and mercury-in-glass?
Geoff S
http://www.geoffstuff.com/uahjan2023.jpg
“What’s the problem with supplying it?”
Bother. Lots of it. As she says, she has been given over 10000 hand scanned forms. Then she comes back saying that some are missing.
Yeah. Including the ones requested. Go figure.
It is like lawyers burying the defence under mountains of paperwork, but leaving out something apparently unimportant…or not.
These are not lawyers or schemers. They are ordinary technicians who don’t give a damn about whether something can be made of the difference in September 2012.
Basic science is about collecting data and keeping it. You have a rather cavalier attitude about data retention for a guy who is processing a lot of data.
Yes. The same standards should apply as in drug testing. Can’t produce the numbers, don’t get approval.
Stokes, No, they’re bureaucrats, do you actually think a meteorologist or some other scientist, scanned those files? If so you really are an idiot. It would be the lowest minion in the office. That’s what happens with requests such as this in a government department. I know that for a fact.
Yes, they are schemers. I want my $billions back.
Correction. A lot are missing.
My questions: Is the BOM untrustworthy because the don’t keep data that disproves their magical global warming theory (and therefore totally incompetent)?
Or is the BOM untrustworthy because they fraudulently doctor the temperature record to prove their magical global warming theory?
YES.
Their task, what they are being paid for, is verifiably to keep accurate and complete records and supply them on request for verification. They appear from J’s account to be both failing to do this and refusing to discuss their failure.
The question is why.
But one of the answers is that if we cannot verify the record, if they don’t have or will not supply the date to allow it, the claims they produce, the data series they produce, is not credible.
If this were a drug testing study, for instance, there is no way we would be making the kind of excuses you are making. We’d be telling the manufacturer to go back, do a proper study, and come back with complete set of results.
People’s lives and welfare would be at stake and perceived to be at stake, so we would insist on professionalism and rigor.
But this is climate, and so we are prepared to cite dodgy stats as if they were authoritative and then use them as the basis for demanding hugely disruptive and expensive changes in energy policy.
The answer is increasingly, no.
“They appear from J’s account to be both failing to do this and refusing to discuss their failure.”
No, they keep and publish complete records (from 1899). Jen has been posting sections of them. For the airport they are here
http://www.bom.gov.au/jsp/ncc/cdio/weatherData/av?p_nccObsCode=122&p_display_type=dailyDataFile&p_startYear=&p_c=&p_stn_num=076031
Her complaint is about records that apparently someone kept using the old LiG thermometer from 2000 for some years onwards. There was no obligation to do this. The handwritten numbers were apparently never digitised or used in any way. The thermometer had almost certainly drifted out of calibration.
You may say this is a management failing; it seems that the instructions to keep reading it were not cancelled as they should have been in 2000, when the parallel test had finished. But it does not render the records “data”. Especially if calibration was not done.
The “homogenized” manure they represent as the “temperature record” is not “data.”
Thermometer readings, as recorded, are data.
You are wrong too Nick.
Many Bureau-run sites maintained thermometer observations after AWS were deployed. Check for example, site-summary metadata for Canberra airport, Alice Springs ….
I did a post on this at Jo Nova a year before JM became aware of the issue. However, at Wilsons Promontory, which is where her crusade started, she never checked metadata and it WAS NOT a Bureau-run site.
(https://joannenova.com.au/2017/08/another-bom-scandal-australian-climate-data-is-being-destroyed-as-
routine-practice/). Neither you or Jennifer are well informed about the matters you claim to be expert on.
All the best,
Bill Johnston
http://www.bomwatch.com.au
“You are wrong too Nick.”
Where? I said they had no obligation to maintain a parallel record beyond the prescribed period. I didn’t say that no-one else did it.
Nick, download and read the metadata. The fact is you are wrong. They did maintain reguar daily observations after AWS were installed. Go and read (https://joannenova.com.au/2017/08/another-bom-scandal-australian-climate-data-is-being-destroyed-as-routine-practice/). To this scientist, your BS vs Jennifer’s BS does not work.
Why don’t you and Jennifer (and Lance) have a love-in and come up with a consensus. You could talk about the Bill-problem for example.
You must both (or the three of you), do better than this.
Cheers,
Bill, the Bill-problem
http://www.bomwatch.com.au
Bill,
“The fact is you are wrong. They did maintain regular daily observations after AWS were installed.”
If you think I’ve said something wrong, it would really help if you would quote what it is. I’ve been saying all along that observations on the old thermometer were taken daily.
Only at Bureau-run sites and then not all sites and not for a fixed-period. The Bureau also paid local observers (volunteers) to maintain observations in some cases, including Marble Bar.
To check this you would have to download and read site-summary metadata on a site-by-site basis, then try to make sense of it.
As I have explained before, at Mildura, coincidentally with completing the comparison in 2000, they replaced the 230-litre screen, with a 90-litre one and there is evidence that 90-litre screens are more sensitive than larger screens. Also that newer plastic 90-litre screens are more sensitive than wooden 90-litre screens.
Then there is the problem of the wind profiler array …
Yours sincerely,
Bill Johnston
“Then she comes back saying that some are missing.”
So you are complaining about her telling the truth?
You are complaining that she wants a complete record?
Why? That’s a rhetorical question. I know why: Because a bastardized temperature record is the basis for your climate change religion, and you don’t like it being called into question.
This is not a temperature record for Mildura. Someone decided to record temperatures on a retired thermometer. Even the best data has missing sections. This is not part of any published BoM record.
In Australia are these records public records? If they are public she is a member of the the public and has a right to them.
If it is a bother then maybe they could invite her in to make the copies herself (or her rep).
Nick, doesn’t the data belong to those that paid for it? Even if it’s a pain to produce that data they should be required to do so for any tax payer that requests it. That’s just one of the requirements of the job when working for the government.
“Even if it’s a pain to produce that data”
It is cost. It is the taxpayers who feel the pain. Scanning 10000 pages doesn’t come cheap. And for what?
On a different tack Nick, How can BoM homogenise over 200 readings for “statistical reasons”? Statistics can’t tell us what the temperature at a station was yesterday, let alone 100 years ago.
This is standard pairwise homogenisation. There is a huge amount of temperature data. Sometimes a jump or drop is observed which is out of the range of what is normally observed. So they check to see whether nearby stations recorded a similar change. If so, accept it. If not, treat the change as a non-climate effect.
So in essence, you’re saying that the data is crap. But the magical tool called homogenisation, whereby we take crap data and manipulate it into a warming trend, will create magical crap that we can trust?
This has nothing to do with “the data”. Jennifer has pestered them into forwarding A8 forms that continued to be filled in long after the parallel matching was complete. That clearly wasn’t used for anything; it was never digitised. The published data was from the AWS. It looks like the calibration of the LiG was not maintained.
What Jennifer is tangled with here is not “the data” It was never homogenised. In fact, it was never even digitised. No-one but Jen has ever looked at it.
Your dissembling and excuse making is rather pathetic. Try putting on a pair of big-boy pants.
“Your dissembling and excuse making is rather pathetic.”
Pathetic is a good description. I would have left out the “rather”.
“It is very unlikely that a probe would have added that 2.1”
This point is exactly what Jennifer is trying to establish. The fact that the BOM is hiding the data so earnestly, suggests that in fact the probe did add that, possibly more.
You can’t establish it. There were no probes to compare with then.
“the AGW hypothesis is held together solely by homogenizations and outright lies”
That’s exactly right. This is just one more example.
I would call this criminal activity seeing the amount of damage these temperature lies are doing to the Western world.
Wow, you found that point to pick on. What about stating your opinion on releasing the government data, (BOM weather stats in this case).
It is funded by the public so why isn’t it available for public review?
Come on, tell us what you think, should public funded data be readily available to the public or not.
I don’t care about any play on words or word omissions that you think you’ve found, talk about the topic at hand or as my friends would say, STFU.
Instead of jumping around, shouting irrelevancies, do something helpful and answer this:
WHY
37.7 °C was entered into the data archive as the official maximum temperature for 23rd September 2017 at Mildura.
“WHY“
???
Because that is what they recorded.
you would expect a new record to be verifiable. what is the equivalent from a mercury for that probe.
That is a question that may interest you. It has nothing to do with the validity of a record.
It matters because these “record maximum temperatures” are used as propaganda to incite fear into people so they will relinquish more control to the government.
If it didn’t matter, they would not have announced it, and if asked would have said that a single reading does not matter.
I don’t recall anyone using the maximum temperature in Victoria for September as propaganda. Some newspapers did note the event in reports at the time of the unusual warmth.
its all here, http://www.bom.gov.au/climate/current/statements/scs62.pdf
To be fair, it only says it was “exceptional”. /s
That is a 25 page report on an unusual warm spell in September 2017. On page 9 they say is
“Mildura reached 37.7 °C on 23 September, setting a new Victorian high temperature record for September. The previous Victorian record for September was 37.4 °C at Mildura on 22 September 2003.”
On p 2 they say
“On the 23rd, the warmth also extended south into Victoria with Mildura recording 37.7 °C—a new Victorian high-temperature record for September. “
And for which of the other records do we have some data from a mercury. They are all hyped, all from probes. :-).
Probes are the modern instrument.
Yes, but when they are used to compare modern temperatures with historical ones, they must record the same value for the same conditions. By all accounts they do not, not the least of which is the thermal mass issue. IMO claims of record temperatures using raw probe data is just wrong (and sloppy) when the previous records were LiG.
At met stations all over the world, equipment gets updated. Mildura’s record starts in 1889, but they aren’t still using 1889 thermometers. The standard process for updating when there is a substantial change is to run the two devices in parallel for a while to see if an adjustment is needed. BoM did that from Dec 1997 to May 2000. Often 18 months is considered sufficient. Then the old equipment is usually removed. The unusual thing at Mildura is that it wasn’t, and readings of it continued. But it is evident from Jennifer’s difference graph that the calibration of the old device was not maintained. No use was made of those readings – they were never digitised.
They try to match the thermal mass. According to Trewin’s report, that was successful, and for the changeover to probe no adjustment was required, in most cases. He did note Mildura as the exception.
It is near-universal scientific procedure to establish if a new instrument is fit for purpose, before it is accepted as a replacement.
There is very little BOM reporting of liquid-in-glass versus Pt resistance probes. Many of us would like to see more comparison studies.
It would be appreciated if you would list those studies that you have seen, in case we have missed significant reports.
I have just about given up on BOM as a source of information. They have seldom replied promptly to my queries. They often fail to reply to the questions asked. One wonders what their paid purpose is, because they delay and obfuscate as if they are frightened of some unstated enemy.
In reality, they are supposed to act for the benefit of the taxpayers who finance them. That does not embrace delay, petulance, obfuscation, declined answers and so on that are hallmarks of the present management which has long been besotted by ideology of unproven global warming.
In some ways, the BOM is the essence of anti-scientific juvenile thought.
Not good enough.
Geoff S
As I’ve linked before, the BoM published a very detailed technical report by Trewin which covers the changeover to AWS, and what they did to determine the effect on readings. He particularly mentions their study of Mildura:
http://www.bom.gov.au/climate/change/acorn-sat/documents/BRR-032.pdf
4. Evaluation of other potential systematic issues……………………………………. 19
4.1 The transition to automatic weather stations …………………………………………………. 19
4.2 Potential changes in response times with changes in automatic weather station probes …………………………………………………………. 21
Nick,
I am unable to ascertain if the probes reported by Trewin 2018 are the same 9engineering-wise) as the ones in use today.
Can you help?
Thanks Geoff S
Geoff,
The metadata for Mildura is here
http://www.bom.gov.au/clim_data/cdio/metadata/pdf/siteinfo/IDCJMD0040.076031.SiteInfo.pdf
Nick,
In 2021 Chris Gillham led a study of the 115 or so ACORN-SAT sites, looking at the patterns of 95 and 99 percentile daily high temperatures in 10 an 20 years before and after the probe data was commenced.
After showing that in the big majority of cases there was an increase in hot days, there was more analysis to try to separate a warming weather pattern to better look for probe patterns.
Then, Chris looked in detail at the 2018 Trewin BOM report that you mention. The Trewin report has many instances of probes reading higher. It is certainly not a dismissal of probe response problems.
You can read the many pages of data analysis on the web site that Chris owns at waclimate under the chapter asking about probes disrupting the weather data.
I thought that understanding had moved on from there.
I suspect that you might not be aware of the large volume of data analysis done by people in our informal group in which Chris and self and a few others have participated for over a decade now. Much of the outcome is reported on the waclimate web site and the Jo Nova site, largely because BOM doggedly refuses to learn from it. It is free of belief, so they might think it is in a foreign language like “science”.
Geoff S
I don’t think using raw data is wrong, they just need to be honest about how the new instrument data is not directly comparable to the old instrument data, with a detailed explanation of the issues involved and the date of each change.
That would be open, transparent, and objective. Pretending that they can “divine” what the temperature reading “would have been” if taken with a different instrument and filling in their guesswork for that is no longer “data.”
Once people understand how many instrument changes, station relocations, etc. have occurred and how all the related issues and discontinuities make the instrument record a disjointed collection of readings that can’t be directly compared and are unfit for the purpose of measuring “climate change,” they can stop worrying about it.
As I’ve linked before, the BoM published a very detailed technical report by Trewin which covers the changeover to AWS, and what they did to determine the effect on readings. He particularly mentions their study of Mildura:
http://www.bom.gov.au/climate/change/acorn-sat/documents/BRR-032.pdf
4. Evaluation of other potential systematic issues……………………………………. 19
4.1 The transition to automatic weather stations …………………………………………………. 19
4.2 Potential changes in response times with changes in automatic weather station probes …………………………………………………………. 21
“Some people did something.” Hmm, where have I heard that one before?
Google is always broken for Nick when he has questions.
So Nick, what I can’t understand is why are the BOM using paper forms for data capture rather than an on-line/electronic system? The BOM claims to be state of the art but this is seriously primitive.
They do use an online electronic system. You can see the latest readings here:
http://www.bom.gov.au/products/IDV60801/IDV60801.94693.shtml
Posted every 30 minutes, as they have been for twenty years.
Jennifer is pestering them about old instruments that they have kept on, and which apparently someone has been reading in the old style. That has nothing to do with results the BoM actually publishes.
Never ever down or up voted any comment on this website or any other until your comment above. You start by acting like nobody should care, and then make it oh so obvious in later comments that you care oh so much about the subject!
This all about denying access to data that should be a published records accessible to any citizen without jumping through any hoops or being stonewalled. No need for a copying machine. Simply publish what is entered in the governments database an make it available on-line. Something that could easily be done at the same time it is being entered into the database.
I can search extensive birth records, death records, even roosters and pay records of Union and Confederate units from 160 years ago all while sitting on my butt using this laptop.
But this lady can’t even get complete temperature data for a certain day or periods? And your not only defending that fact but attempting to portray the person that is seeking the data as a busy body that wasting other peoples time!
“But this lady can’t even get complete temperature data for a certain day or periods?”
Absolute nonsense. She has been posting scads of temperature data. Mildura has a very good record back to 1899. Raw data is online, as she says.
What she is demanding is the original records that someone continued to keep after 2000 of the old LiG thermometer, which was no longer the official instrument but hadn’t been removed. This data was never digitised, or used for any purpose. It was very likely out of calibration. No-one would ever have looked at it until she got the then Treasurer to pressure BoM to produce it. And, to no-one’s surprise, it turns out to have lots of gaps.
After that statement don’t ever accuse anyone of hand waving and making unsupported assumptions again Nick.
BTW many of the pay records and rosters for those civil war units are scanned copies of the original forms.
roster of civil war units – Bing images
”Does it really matter if the mercury said something slightly different.”
What a tosser…If the whole global warming debate surrounds fractions of a degree, then yes, it really does matter.
“If the whole global warming debate surrounds fractions of a degree, then yes, it really does matter.”
Exactly.
I get the impression that Nick doesn’t think that the data (or it’s accuracy) matters.
After all, in Settled / Consensus Science, as long as you have a good theory you can always make the data fit.
so nothing to see, please move along 😉
Lunatic(s) solution on the horizon
Proponents of a “moonshot” idea to deal with global heating have been handed a new, very literal, interpretation by researchers who have proposed firing plumes of moon dust from a gun into space in order to deflect the sun’s rays away from Earth.
Aha, so the sun is the cause of global heating?
I say build more asylums.
https://www.theguardian.com/science/2023/feb/08/moon-dust-moonshot-geoengineering-climate-crisis
I downvoted because moon-cannons sound fun.
Only if we can load climate ‘scientists’ into them.
Climate scientists are not full of moondust, they’re full of shit
Well if we send them to the moon they will be moondust eventually
“I say build more asylums.”
I second the motion.
Maybe on the Moon. Send all “climate scientists” who believe modest and 100% beneficial global warming since the Little Ice Age to be a “crisis” there, and tell them they’re collecting Moon dust that will be used to “fight climate change.”
Tell them they can return to Earth only after the “crisis” has been averted according to an assortment of leftist “news” outlets.
Thanks so much for reposting this.
I see Nick already asking for more information.
He asks, “Maybe the hottest September day? Maybe the hottest Sept 23?”
The headlines and articles can still be found with a Google search. It was big news. But no-one wanted to check the new hot day records against anything reliable.
“Victoria posted its hottest September reading on September 23, with Mildura clocking a 37.7 reading.
https://www.smh.com.au/environment/weather/how-twin-bursts-of-unprecedented-earlyseason-heat-scorched-eastern-australia-20171004-gyttd7.html
“Australian temperature records tumbled again in September this year, with the country experiencing the hottest day since records began, and New South Wales breaking that record twice within a few days.
As always, particular weather events caused the records to be broken. But in a special climate statement, the Bureau of Meteorology said climate change also played a role, and earlier research has shown global warming has massively increased the chance of these records being broken.
On 22 September 2017 Australia experienced its hottest September day since records began more than a century ago, reaching an average maximum temperature across the continent of 33.47C – breaking the previous record set 19 years ago.
https://www.theguardian.com/australia-news/2017/oct/05/sweltering-september-smashes-australias-temperature-records
Queensland also experienced its hottest day over the whole state on 27 September, reaching 42.5C in Birdsville, and Victoria recorded a new September temperature record, measuring 37.7C for the first time at Mildura.
The average temperature for the month was not a record temperature, with that record being set by a highly unusual spring in 2013. Research conducted in 2014 by Sophie Lewis from the Australian National University found if greenhouse gases in the atmosphere were at pre-industrial levels, Australia would break that September record just once every 704 years. But current levels of greenhouse gases make that 16 times more likely.
Lewis said that estimate was now considered conservative, with actual extreme weather being seen as almost impossible without the influence of greenhouse gases.
***
I wrote to Sophie Lewis and others at the time suggesting it might be more about equipment change than AGW.
“The average temperature for the month was not a record temperature, with that record being set by a highly unusual spring in 2013. Research conducted in 2014 by Sophie Lewis from the Australian National University found if greenhouse gases in the atmosphere were at pre-industrial levels, Australia would break that September record just once every 704 years. But current levels of greenhouse gases make that 16 times more likely.
Lewis said that estimate was now considered conservative, with actual extreme weather being seen as almost impossible without the influence of greenhouse gases.”
A ridiculous calculation. They can’t tell us how much warmth a given amount of CO2 adds to the atmosphere, the numbers are all over the place, and here they are making calculations based on guesses and speculation. They picked an unsubstantiated number out of their hat and are running with it. No basis in fact.
One of the Climategate emails is from a person from the BoM with the name of “Jones” who was crowing to the cabal about how whenever they were asked for temps records by curious private citizens, the BoM would “snow” the inquirer with thousands of files.
Sounds like that’s their standard response to requests for records, Jennifer.
Yes. SOP (Standard Operating Procedure) of the Solar-Wind-EV-etc. science pimps in Action
***********************
From: Phil Jones
Subject: Fwd: CCNet: PRESSURE GROWING ON CONTROVERSIAL RESEARCHER TO DISCLOSE SECRET DATA
Date: Mon Feb 21 16:28:32 2005
The skeptics seem to be building up a head of steam here ! *** Leave it to you to delete as appropriate !
Cheers
Phil
PS I’m getting hassled by a couple of people to release the CRU station temperature data.
Don’t any of you three tell anybody that the UK has a Freedom of Information Act !
********************
At 09:41 AM 2/2/2005, Phil Jones wrote:
Mike,
… Just sent loads of station data to Scott. … don’t leave stuff lying around on ftp sites – you never know who is trawling them. The two MMs have been after the CRU station data for years.
If they ever hear there is a Freedom of Information Act now in the UK, I think I’ll delete the file rather than send to anyone. …
We also have a data protection act, which I will hide behind. ***
Cheers
Phil
***************************
LP: “More on Phil Jones: Global Warming ate my data — We’ve lost the numbers: CRU responds to FOIA requests
http://www.theregister.co.uk/2009/08/13/cru_missing/:
The world’s source for global temperature record admits it’s lost or destroyed all the original data that would allow a third party to construct a global temperature record. The destruction (or loss) of the data comes at a convenient time for the Climatic Research Unit (CRU) in East Anglia – permitting it to snub FoIA requests to see the data.
Phil Jones, before admitting he’s lost all the data: “Even if WMO agrees, I will still not pass on the data. We have 25 or so years invested in the work. Why should I make the data available to you, when your aim is to try and find something wrong with it.” “
(http://wattsupwiththat.com/2009/11/19/breaking-news-story-hadley-cru-has-apparently-been-hacked-hundreds-of-files-released/#comment-227951 )
***********************************
“Lost” the data. Right.
Have they lost any data that doesn’t apply to their AGW hogwash?
They’ve still got their payslips
Mr,
In January 2012 Jo Nova kindly published a comprehensive review that I made of those early emails, with thans to Warwick Hughes, the Australian geologist who recieved that infamous Phil Jones email.
Geoff S
https://joannenova.com.au/2012/01/that-famous-email-explained-and-the-first-volunteer-global-warming-skeptic/
Thanks for that link Geoff.
(why do I feel a bit like vomiting whenever I read excerpts from the Climategate perfidy)
Anyway, the email I was recalling was from that bloke at the BoM called David Jones (as in the department stores).
He was crowing about how he responded to requests for records by flooding the person with wads of raw data records.
I’m sure that email is in the evidence somewhere.
Government employees who do not comply with legal requests should be fired immediately. Lying and cheating is not in their job description.
not part of their (official) job description.
Maybe not, but is in in their nature
Re: you have provided me with over 10,000 scanned pages
In civil litigation (a parallel to what you are involved in) in the U.S., such a response by BOM to your carefully tailored request would likely be held “non-responsive” by a federal judge.
… the courts are interpreting revised Rule 34 of the Federal Rules of Civil Procedure to require precision in the discovery demand and the response to it.
(https://www.abajournal.com/voice/article/lets_trash_data_dump_litigation_ploys – emphasis mine)
GOOD — FOR — YOU, Jennifer Marohasy. Don’t give in!
“a parallel to what you are involved in”
It is no parallel. Discovery is expensive, and paid for by the parties. It is ordered by a court and overseen by a judge. You have to justify the requests.
This is just a random member of the public making endless demands of a taxpayer-funded body. I’d rather my tax dollars went to studying the weather.
I’d rather my tax dollars find a cure for cancer. We already know what the weather can do.
This isn’t a random member of the public. This someone that the BOM is dead set scared of because she can analyze the data and point out their corruption.
Do you know what the alleged corruption actually is?
prima facia case. It is corrupt for any government to deny access to data obtained and compiled using tax payer funding unless there are actual national security concerns that it to qualify for having a security classification or other safety concerns.
The military taught me to make a self igniting Molotov cocktail and various other expedient explosive and incendiary compounds and initiation devices but would object to that information being published by the government.
No such argument can be applied to weather and temperature data.
They gave her over 10000 hand scanned sheets. They haven’t denied anything. Just that her demands are interminable.
It’s before the tribunal now. They don’t seem to find any corruption.
Jennifer Marohasy, PhD, who formerly worked with the Indonesian Bureau of Meteorology, is hardly a “random member of the public”.
Unless the federal judge was an Obama appointee. “Case dismissed”.
Not unusual, but very dangerous that such fraudulent corruption of the temperature record has become so routine. And all because they want to prove something which is so clearly false.