BY CHRIS MARTZ
Come rain or shine, there’s no shortage of people rushing to link human-caused climate change to just about everything that happens with the weather. The press in particular has become almost insufferable, especially in times of crisis.
Hurricane Ian made no exception as it barreled toward the Southwest Florida coastline as a high-end Category 4, making an initial United States landfall on Wednesday, September 28 on the island of Cayo Costa, then a second just south of Punta Gorda, with reported maximum sustained winds of 150 mph and a minimum central pressure of 940 mb, making it the first Category 4 hurricane to landfall in that region since Hurricane Charley back in 2004.
This occurred just after Ian had completed an eyewall replacement cycle, a process whereby a new eye begins to develop around the old eye. The newly formed eye gradually decreases in diameter replacing the original eye. Eyewall replacement cycles typically cause intense tropical cyclones to weaken, but once completed more often than not result in a stronger storm than there was to begin with.
After traversing Florida and weakening into a tropical storm, Ian restrengthened into a hurricane after emerging over open water in the Atlantic. On September 30, Ian made its final landfall as a Category 1 hurricane near Georgetown, South Carolina with winds of 85 mph and a minimum barometric pressure of 977 mb before undergoing a rather rapid extratropical transition.
An innumerable amount of damage, primarily from storm surge and excessive rainfall, was inflicted across the coast of Southwest Florida. Fort Myers Beach (Figure 1) and Naples, especially, suffered catastrophic damage, while the roadway to Sanibel Island collapsed entirely. As of the time of this writing, over 130 people have died, and many remain unaccounted for. This automatically makes Ian the deadliest tropical cyclone to strike Florida since the infamous 1935 Labor Day Hurricane, which killed 423. Bear in mind at that time, we didn’t have warning coordination systems which have done wonders to save millions of lives over the last several decades. When all said and done, it’s likely damage costs will surpass $100 billion, and the name Ian will be retired by season’s end altogether.
Despite the heartbreaking devastation and enormous loss of life, this hasn’t stopped the vultures in the newsroom from turning what should be a bipartisan recovery effort into a political escapade. Not only was the so-called “climate crisis” to blame, but it was also expressed that Republicans’ refusal to vote in favor of a “green” agenda makes them complicit. But, I’m not going to engage in partisan politics as it has no place in scientific discussion or recovery efforts. Journalists, take cue.
Over the last week, a plethora of headlines have popped up in my news feed. Their message? Case in point, climate change fueled Hurricane Ian. Here’s just a sample of some of the headlines from a simple Google search:
- “Hurricane Ian’s rainfall was a 1-in-1,000 year event for the hardest-hit parts of Florida” — CNN (September 28, 2022)
- “How climate change is rapidly fueling super hurricanes” — The Washington Post (September 29, 2022)
- “Climate change makes storms like Ian more common” — NPR (September 29, 2022)
- “Study finds that climate change added 10% to Ian’s rainfall” — ABC News (September 29, 2022)
- “Storms are becoming more common in the Atlantic Ocean.” — The New York Times (September 29, 2022)
- “Hurricane Ian is no anomaly. The climate crisis is making storms more powerful” — The Guardian (September 30, 2022) (Note: This one is particularly interesting, as it was co-written by Dr. Michael Mann.)
Oh, and how could I forget that MSNBC brought tropical meteorology expert Bill Nye on to lecture viewers on how climate change fuels stronger and larger hurricanes.
In a nutshell, each article or segment regurgitated the same basic talking points. There was no investigative journalism. No original thought. Just cookie cutter stories.
However, I have to tip my hat to The Atlantic’s Robinson Meyer for this piece who consulted a top hurricane expert, Dr. Kerry Emanuel from MIT, and discussed where there is confidence and uncertainty regarding specific areas of event attribution and what we know about observed climatological trends. While I disagree with a few of the details [e.g., the dismissal of the role of the Atlantic Multidecadal Oscillation (AMO) in governing North Atlantic tropical cyclone activity], I make no bones; it’s without a doubt a well-thought-out article.
I read through each of the articles bulleted above and took notes on the key points made in each. There was a lot of overlapping. Color me surprised (sarc). Below, I broadly list each of the main points; further down, they’ll be examined in greater detail individually to see if they hold any water.
- Hurricane Ian tied with several others as the 5th most intense to strike the Contiguous United States since records began in 1851.
- Storms like Hurricane Ian are becoming more likely because of human-caused climate change.
- Globally, we are observing stronger tropical cyclones; a greater proportion of hurricanes are reaching major hurricane status.
- Rapid intensification (RI) events (30-knot increase in 24-hours) are becoming increasingly common because warmth from rising sea surface temperatures (SSTs) is diffusing into deeper layers, increasing the fuel, or ocean heat content (OHC) for hurricanes.
- The size of storm surge has increased due to both sea level rise (SLR) and increasing tropical cyclone size.
- Climate change upped rainfall amounts in Hurricane Ian by at least 10%. For every 1°C rise in ocean surface temperatures, the amount of water evaporating into the atmosphere increases by 7% which exacerbates flooding from extreme rainfall.
Claim #1: Hurricane Ian tied with several other storms for 5th most intense to strike the United States mainland.
True or false? True, but Disputable.
Officially, hurricanes are classified into a 1 to 5 rating according to the Saffir-Simpson Hurricane Wind Scale (SSHWS)¹ (Table 1), which is based on their maximum sustained wind speed—the highest average wind speed measured in one-minute intervals 10 meters above the ground (as defined by the National Weather Service and Joint Typhoon Warning Center). Hurricanes reaching Category 3 status or higher are referred to as “major hurricanes.”
| Category | Sustained Winds (mph) | Type of Damage due to Hurricane Winds |
| 1 | 74-95 mph 64-82 kt | Damage to shingles, siding and gutters may occur. Tree branches can snap. Utility poles are often damaged leading to power outages lasting a few to several days. |
| 2 | 96-110 mph 83-95 kt | Well-constructed frame homes could be inflicted with major roof and siding damage. Smaller trees and branches could fall blocking roads. Power outages could last several days or up to a couple of weeks. |
| 3 | 111-129 mph 96-112 kt | Homes can sustain major roof damage. Electricity and water are often unavailable for several days or weeks after the storm passes. Some trees can be snapped and uprooted. |
| 4 | 130-156 mph 113-136 kt | Catastrophic damage to well-built houses, often with loss of roof structure and exterior walls. Almost all trees in its path are uprooted or snapped, and utility poles downed. Power outages can last several weeks to months leaving much of the stricken area uninhabitable. |
| 5 | ≥157 mph ≥137 kt | Homes incur catastrophic damage, many of which are destroyed entirely. Fallen trees and power poles can isolate residential areas for several weeks. Most of the area subject to damage is uninhabitable for weeks or months. |
Table 1. Saffir-Simpson Hurricane Wind Scale (SSHWS) categories and descriptions.
Ian made landfall on the island of Cayo Costa, Florida, and then on the mainland a jog south of Punta Gorda as a high-end Category 4 hurricane with maximum sustained wind speeds of 150 mph. By this official measure, Ian tied with seven other hurricanes in the NOAA HURDAT2 database² as the fifth strongest to landfall in the Lower 48 since official documentation began in 1851, the others being Last Island (1856), Indianola Texas (1886), Florida Keys (1919), Freeport (1932), Charley (2004), Laura (2020) and Ida (2021) (Table 2).
| Rank | Storm Name | Vₘₐₓ (mph) | Year | Date | State |
| 1 | Labor Day | 185 | 1935 | 9/3 | FL |
| 2 | Camille | 175 | 1969 | 8/18 | MS |
| 3 | Andrew | 165 | 1992 | 8/24 | FL |
| 4 | Michael | 160 | 2018 | 10/10 | FL |
| T-5 | Last Island | 150 | 1856 | 8/10 | LA |
| T-5 | Indianola Texas | 150 | 1886 | 8/20 | TX |
| T-5 | Florida Keys | 150 | 1919 | 9/10 | FL |
| T-5 | Freeport | 150 | 1932 | 8/14 | TX |
| T-5 | Charley | 150 | 2004 | 8/13 | FL |
| T-5 | Laura | 150 | 2020 | 8/27 | LA |
| T-5 | Ida | 150 | 2021 | 8/29 | LA |
| T-5 | Ian | 150 | 2022 | 9/28 | FL |
Table 2. Top five strongest hurricanes to landfall in the Continental United States since 1851 by maximum sustained wind speed (Vₘₐₓ) at landfall (NOAA HURDAT2). T indicates a tie.
Based on the chart above, Ian also tied with the Florida Keys Hurricane (1919) and Charley (2004) as the fourth most intense hurricane to strike the Sunshine State.
However, not all meteorologists think that rating hurricanes by their maximum sustained wind speed and grouping them into five different categories based on the Saffir-Simpson scale is an adequate assessment of their intensity. There aren’t any problems with the wind scale per se, but there are inconsistencies with measurement practices and issues with how wind speeds are reported.
- Tropical cyclone wind speeds today are measured by aircraft reconnaissance, a task carried out by the 53rd Weather Reconnaissance Squadron and NOAA Hurricane Hunters. Dropsondes, parachute borne sensors dropped from the plane, obtain meteorological information. This is done at flight-level, which is approximately 850 mb (~5,000 ft.) in altitude. To estimate the 10-meter one-minute Vₘₐₓ, there is a 10% reduction to account for surface friction.
- Prior to the implementation of aircraft observations, hurricane wind speeds were actually measured from surface weather stations 10-meters above the ground or ship and buoy observations. In other words, the gusts reported in the detailed summaries you read on NOAA or Wikipedia were measured not from flight-level with a correction for friction, but from the surface.
- Another pet peeve of mine is that wind speeds are reported in 5 mph increments (e.g., 95 mph, 100 mph, 105 mph, etc.), which is by no means precise. While accurate in nature, in science you want to have both accurate and precise measurements to boost confidence in the results.
These inconsistencies are seldom discussed, and when brought up are often sidelined as irrelevant. Yet, that couldn’t be further from the truth. The highest wind gust associated with Hurricane Ian that was reported was 140 mph in Cape Coral, followed by 135 mph in Punta Gorda, 132 mph in Port Charlotte, 128 mph in Grove City, 126 mph at Pelican Bay and 112 mph at Southwest Florida International Airport in the South Fort Myers area. The 140 mph wind gust reported at Cape Coral seems to be the outlier in this subset of data, which means that with 10-meter wind gusts generally in the 120s and 130s, historically, this would’ve been rated as a low-end Category 4 or high-end Category 3.
One way to corroborate this is using the wind damage descriptions outlined in the Saffir-Simpson Hurricane Wind Scale itself. Category 4 wind gust damage is associated with almost all trees being uprooted or snapped in half. If you examine some photos of the damage compiled here, you might be surprised to see very few snapped or uprooted trees. The damage is more resemblant of a Category 3 hurricane, not a Category 4.
Thus, one could reasonably argue in good faith one of two things:
- Tropical cyclones intensities today are overestimated, or,
- Hurricane intensities prior to aircraft recon were underestimated.
As a disclaimer, I am by NO means trying to undermine the severity, devastation and heartbreaking loss of life wrought by Ian. All I am saying here is that from photographic evidence, by definition, there doesn’t appear to be structural or tree damage associated with wind speeds of upper tier Category 4 strength.There was an immense amount of damage caused by storm surge and flooding rains, and it doesn’t take very high wind speeds for that to occur. For an area geographically not acquainted with frequent hurricane landfalls, makes it all the more crippling.
Objections to rating hurricanes by their maximum sustained winds aren’t new. Within the last two decades, several different scales have been proposed to either modify or even replace the Saffir-Simpson Scale [e.g., Kantha et al. (2006)³ which proposed a scale based on Vₘₐₓ, radius of Vₘₐₓ, and translation speed; Powell and Reinhold (2007)⁴, which suggested a scale based on the wind destruction potential calculated from integrated kinetic energy (IKE); and Walker et al. (2018)⁵, that proposed the Kuykendall scale based on fiscal losses in relation to modeled storm surge height and velocity] but as noted in Klotzbach et al. (2020),⁶ while these metrics are useful for specific applications, they either can’t be calculated in real-time or haven’t been historically documented over the last several decades.
Klotzbach et al. (2020) then went on to say that one measure of tropical cyclone intensity that has been documented in HURDAT2 database for all North Atlantic named storms since 1979 and is available for all Continental United States landfalling hurricanes is their minimum sea level pressure (MSLP). The relationship between a tropical cyclone’s MSLP and Vₘₐₓ has been examined in a number of studies [e.g., Knaff and Zehr (2007)⁷] and the relationship is linear (Figure 2).

The 2007 study examined 15 years of tropical cyclone MSLP and Vₘₐₓ data from the North Atlantic, Northeast Pacific and Central North Pacific basins. By simple linear regression, the authors found that the coefficient of determination (R² value) is over 0.9 (Figure 2), which means that the data fits well with a linear model.
Indeed, in my university’s ESCI 344 Tropical Meteorology course, we learn that the lower the central pressure, the greater the maximum wind will be. The mechanics of this are simple. Pressure falls in the core of the storm tighten the horizontal pressure gradient between it and the surrounding environment. In an attempt to equalize the pressure deficit, air accelerates toward the storm’s center (+Vₘₐₓ). The relationship between Vₘₐₓ and MSLP is approximated by:
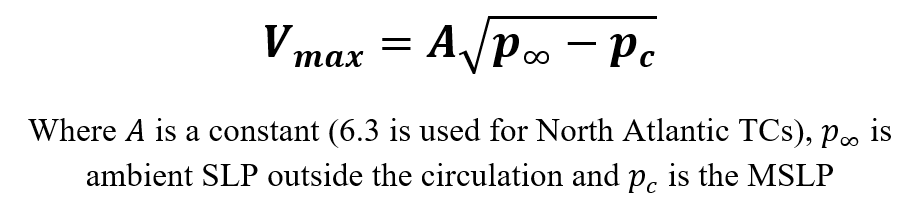
One other advantage to using a tropical cyclone’s minimum pressure as a proxy for its intensity is that it’s a much more precise measure than maximum sustained winds, which as aforementioned are reported in 5 mph increments. Pressure is reported in single units of hectopascals (hPa) which is equivalent to a millibar (mb).
By ranking hurricane intensities by their landfall pressure, Hurricane Ian ties with three other storms for the 18th strongest hurricane to landfall in the Continental United States over the last 172 years (Table 3). Thus, by using a more accurate and precise measure, it’s nowhere near the top five strongest. For some trivia, out of the other 25 hurricanes to landfall at least at the same intensity, 14 of them occurred at or prior to 1960 and 16 of them occurred before 1970.
| Rank | Name | MSLP (hPa) | Year | Date | State |
| 1 | Labor Day | 892 | 1935 | 9/3 | FL |
| 2 | Camille | 900 | 1969 | 8/18 | MS |
| 3 | Michael | 919 | 2018 | 10/10 | FL |
| 4 | Katrina | 920 | 2005 | 8/29 | LA |
| 5 | Andrew | 922 | 1992 | 8/24 | FL |
| 6 | Indianola Texas | 925 | 1886 | 8/20 | TX |
| 7 | Florida Keys | 927 | 1919 | 9/10 | FL |
| 8 | Okeechobee | 929 | 1928 | 9/16 | FL |
| 9 | Miami Donna Ida | 930 | 1926 1960 2021 | 9/18 9/10 8/29 | FL FL LA |
| 10 | Carla Irma | 931 | 1961 2017 | 9/11 9/10 | TX FL |
| 11 | Texas | 932 | 1916 | 8/18 | TX |
| 12 | Last Island Hugo | 934 | 1856 1989 | 8/10 920 | LA SC |
| 13 | Freeport | 935 | 1932 | 8/14 | TX |
| 14 | Galveston | 936 | 1900 | 9/8 | TX |
| 15 | Rita Harvey | 937 | 2005 2017 | 9/24 8/25 | LA TX |
| 16 | Hazel | 938 | 1954 | 10/15 | SC |
| 17 | Laura | 939 | 2020 | 8/27 | LA |
| 18 | Galveston Cuba-Brownsville Florida Ian | 940 | 1915 1933 1948 2022 | 8/17 9/4 9/21 9/28 | TX TX FL FL |
Table 3. Top 18 strongest hurricanes to landfall in the Continental United States since 1851 by minimum sea-level pressure (MSLP) at landfall (NOAA HURDAT2).
As far as Florida landfalls exclusively go, by minimum barometric pressure at landfall, Ian ranks 8th strongest tied with the unnamed Florida hurricane of 1948. Out of the top 10 (12) most intense hurricanes to strike there, six occurred at or before 1960 (Table 4). For all intents and purposes, out of the total of fifteen Category 4-5 hurricanes to hit Florida since 1851, ten of those were in or before 1960, five of which hit between 1945 and 1950.
| Rank | Name | MSLP (hPa) | Year | Date |
| 1 | Labor Day | 892 | 1935 | 9/3 |
| 2 | Michael | 919 | 2018 | 10/10 |
| 3 | Andrew | 922 | 1992 | 8/24 |
| 4 | Florida Keys | 927 | 1919 | 9/10 |
| 5 | Okeechobee | 929 | 1928 | 9/16 |
| 6 | Miami Donna | 930 | 1926 1960 | 9/18 8.10 |
| 7 | Irma | 931 | 2017 | 9/10 |
| 8 | Florida Ian | 940 | 1948 2022 | 9/21 9/27 |
| 9 | Charley | 941 | 2004 | 8/13 |
| 10 | Opal | 943 | 1995 | 10/4 |
Table 4. Top 10 strongest hurricanes to landfall in Florida since 1851 by minimum sea-level pressure (MSLP) at landfall (NOAA HURDAT2).
So, while Ian was in fact the fifth strongest hurricane to directly impact the United States coastline by its maximum sustained winds (Vₘₐₓ), it barely cracks the top 20 in terms of minimum sea-level pressure (MSLP), which is a much more skillful metric due to a higher precision of measurement.
Claims #2-3: a.) Storms like Ian are becoming more likely, and b.) a greater proportion of hurricanes are reaching major hurricane status.
True or false? False.
Several outlets ran with the story that storms like Hurricane Ian have become more common on a warmer planet, and that it’s part of a much larger trend that will continue in the future. CNN said that “[climate change is] also making storms stronger…” while NPR’s Rebecca Hersher wrote “Storms like Ian are more likely because of human-caused climate change.” Oh, but it doesn’t stop there, The New York Times argued that “Climate change has already contributed to a rise in destructive hurricanes like Ian,” and Dr. Mann and Susan Hassol asserted confidently in The Guardian that “…it’s part of a larger pattern of stronger hurricanes, typhoons and superstorms that have emerged as the oceans continue to set record levels of warmth.”
As convincing as these arguments may be, they don’t hold any water when tested against empirical data and peer-reviewed scientific literature. So, let’s break this down into three different components to address the following questions:
- Has climate change contributed to a rise in intense hurricanes like Ian? If so, is this part of a larger pattern of more intense tropical cyclones?
- Are major hurricanes—those that reach Category 3 status or higher—on the rise?
- Are hurricanes becoming more destructive due to climate change?
Before diving headfirst into the data, let’s take a look at what the United Nations’ Intergovernmental Panel on Climate Change (IPCC) has to say on global tropical cyclone trends in Chapter 11⁸ of their latest AR6 report:
“Identifying past trends in TC metrics remains a challenge due to the heterogeneous character of the historical instrumental data, which are known as ‘best-track’ data (Schreck et al., 2014). There is low confidence in most reported long-term (multi-decadal to centennial) trends in TC frequency- or intensity-based metrics due to changes in the technology used to collect the best-track data. This should not be interpreted as implying that no physical (real) trends exist, but rather as indicating that either the quality or the temporal length of the data is not adequate to provide robust trend detection statements, particularly in the presence of multi-decadal variability.”
IPCC AR6, 11.7.1.2 Observed Trends
Colorado State University’s Department of Atmospheric Science keeps an archive of tropical cyclone data for each basin, hemisphere and for the globe. Global data [linked above] goes back to 1980,⁹ which covers the satellite-era. While 41-years of data inhibits the ability for scientists to detect multidecadal variation, it is useful in assessing trends we can confidently measure over the last few decades, a period characterized by a robust increase in carbon dioxide emissions. Thus, if there’s a detectable signal, it should emerge in the data, but lo and behold, it doesn’t, as shown in Figure 3 below. In fact, a case can even be made for an ever-so-slight decrease in global hurricane counts (red line) over the past four decades. It’s also very clear that there hasn’t been any significant change in the number of major hurricanes over that same time period, particularly since 1990.
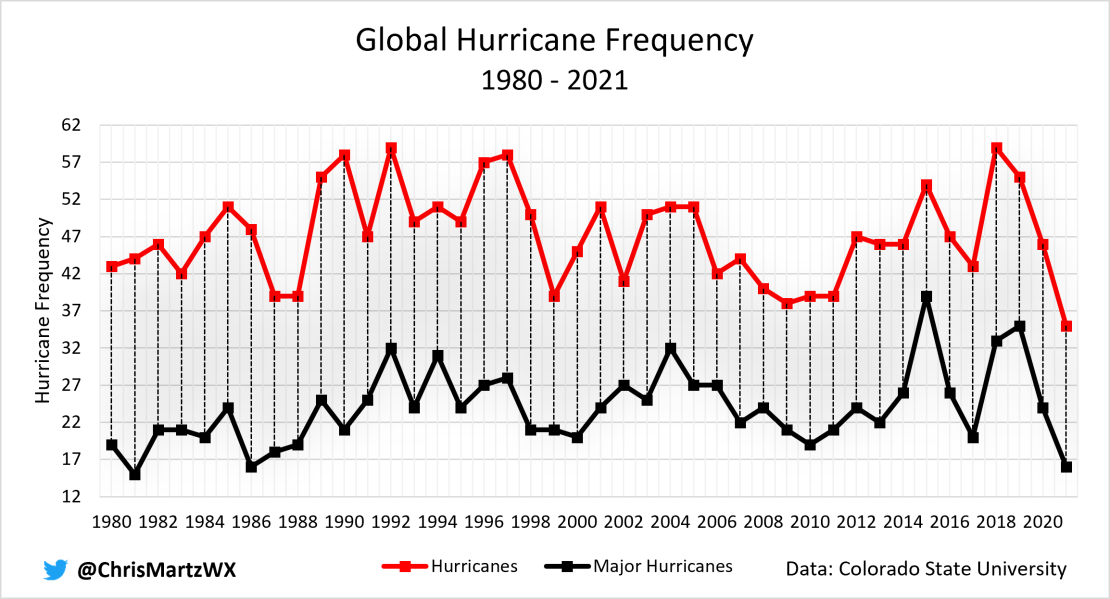
Keep in mind that the nomenclature of and scales for rating tropical cyclones varies depending on basin (e.g., “hurricanes” are referred to as “typhoons” in the Northwest Pacific and as “severe cyclonic storms” in the North Indian Ocean). As such, the data presented above compiled all of the data from each basin and fitted it to the Saffir-Simpson Hurricane Wind Scale. While a scatter plot of each storm’s MSLP would probably be more useful, as I argued earlier, an annual tally of the number of tropical cyclones with Vₘₐₓ ≥ 74 mph (C1-5 hurricanes) and ≥ 111 mph (C3-5 hurricanes) correlates well enough to categories based on MSLP proposed in Klotzbach et al. (2020)⁶ that trends aren’t affected all that much.
To be sure, a study published in March of this year in Geophysical Research Letters (GRL) examined various metrics of tropical cyclone activity since 1990, a period characterized by consistent observational practices, and found that globally, while there has been no discernable trend in the occurrence of major hurricanes (Figure 4b), there has actually been a markedly downward trend in the number of total hurricanes (Figure 4a), which the authors attribute to a tendency toward a more La Niña-like base state (which, by the way, is not supposed to happen according to Global Warming Theory) that suppresses activity in the North and South Pacific.¹⁰
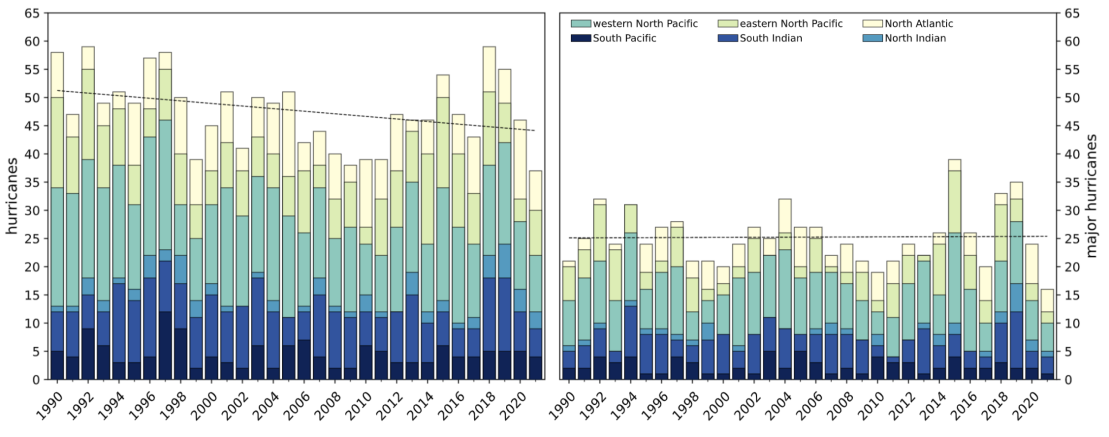
Klotzbach et al. (2022) also noted that while the number of Category 4-5 hurricanes globally have increased during the last 31-years, the trend is not at all significant.¹⁰
One intriguing aspect about the statistics presented above is that even without arbitrarily selecting a different starting date, scientists can manipulate these numbers to change no trend into an increasing one. That’s precisely what was done in Chapter 11, Section 7.1.2 of IPCC AR6:
“It is likely that the global proportion of Category 3–5 tropical cyclone instances…have increased globally over the past 40 years.”
IPCC AR6, 11.7.1.2 Observed Trends
While there’s technically nothing incorrect about this statement statistically, it’s missing context and is worded in a manner as to suggest a significant increase in the number of major hurricanes over the last four decades.
Recall, during the last 40+ years of reliable satellite coverage, there has been no measurable increase in the number of Category 3-5 hurricanes on a global basis, but during that period, the total number of hurricanes have downturned. Setting this up as a ratio of major hurricanes to hurricanes will make it appear as if there are more major hurricanes today than there used to be simply because the gap narrows. It’s statistical deception at is finest.
Arguably, the best measure of tropical cyclone activity, however, is the accumulated cyclone energy index, abbreviated ACE. It’s essentially a measure of a named storm’s potential for wind and storm surge destruction. It’s calculated by summing the squares of the estimated Vₘₐₓ of a named storm at six-hour intervals. The summation is then divided by 10,000 (multiplied by 10⁻⁴ kt²) to make the numbers more manageable (1 unit ACE = 10⁻⁴ kt²).

Seasonal ACE is calculated by summing each individual storm’s generated accumulated cyclone energy. Using the same database from Colorado State University, I plotted the ACE index since 1980 for the globe (Figure 5).⁹ Simply put, there has been no detectable multidecadal increase or decrease in the destructive power of tropical cyclones.

While the notion from the press and some scientists that major hurricanes like Ian are becoming more common has already fallen flat on its face, one might want to do a more thorough analysis by examining trends in the Atlantic basin and in the Continental United States. After all, the North Atlantic has records going back to 1851, far longer than any other basin. One might suggest a signal could emerge there whereas it might not globally due to the limited temporal scope of reliable observations.
The New York Times reported that since 1980, “…strong storms are becoming more common in the Atlantic Ocean, as its surface water has warmed.” Indeed, if you examine raw numbers of major hurricane counts in the North Atlantic since 1851 (Figure 6), there has been a sharp increase since the 1980s with the last 20-years or so observing a record number of Category 3-5 storms.
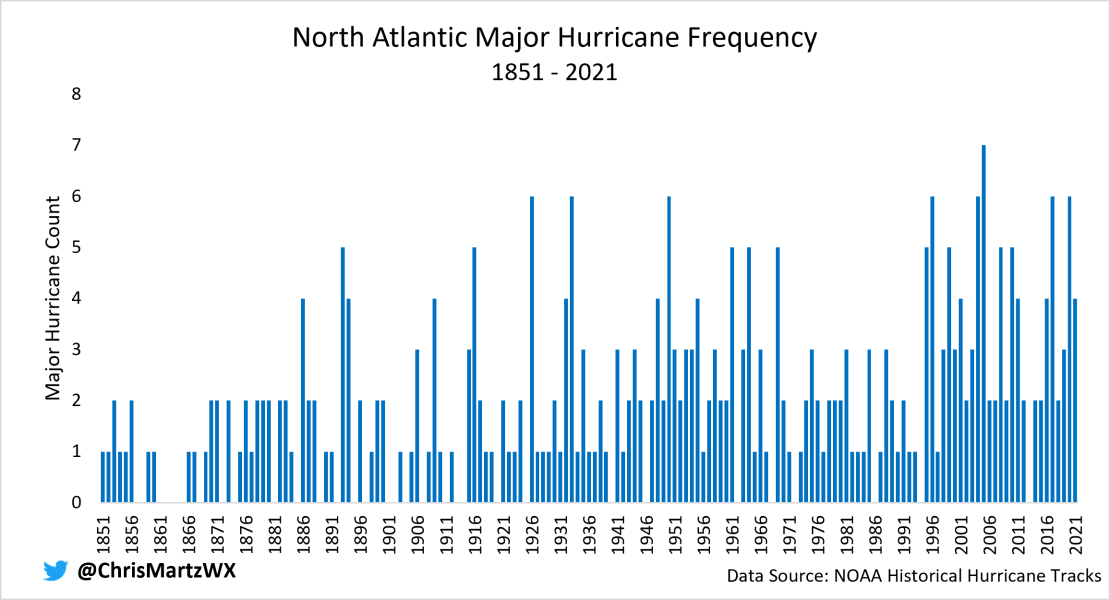
Yet, it’s more likely than not that this observed century-scale increase, particularly since the mid-1990s is almost entirely due to two things, neither of which have to do with human-induced climate change:
- Changes in observing practices over time (i.e., sparse ship observations, to limited aircraft recon in the 1940s, to satellite instrumentation in the 1960s/70s) that allow meteorologists to spot storms out-to-sea that would have otherwise been missed in the historical record.
- Recent periods of high activity is a recovery from a deep minimum of inactivity during the 1970s, 1980s and early-1990s, partly influenced by multidecadal ocean oscillations (e.g., the AMO) and perhaps reduced aerosol use.
The inhomogeneities plaguing the historical record have been examined in a few studies such as Vecchi et al. (2021)¹¹—co-authored by one of the world’s leading hurricane experts, Dr. Chris Landsea from the National Hurricane Center—and Klotzbach et al. (2022).¹⁰ Here’s an excerpt from the abstract of the former:
“We find that recorded century-scale increases in Atlantic hurricane and major hurricane frequency, and associated decrease in USA hurricanes strike fraction, are consistent with changes in observing practices and not likely a true climate trend. After homogenization, increases in basin-wide hurricane and major hurricane activity since the 1970s are not part of a century-scale increase, but a recovery from a deep minimum in the 1960s–1980s.”
Vecchi et al. (2021)
NOAA’s Geophysical Fluid Dynamics Laboratory (GFDL) also touched¹² on the subject matter:
“Similarly for Atlantic basin-wide hurricanes (after adjusting for observing capabilities), there is not strong evidence for an increase since the late 1800s in hurricanes, major hurricanes, or the proportion of hurricanes that reach major hurricane intensity.”
NOAA GFDL: Global Warming and Hurricanes, Summary Statement
Vecchi et al. (2021)¹¹ in fact did just that—homogenized hurricane and major hurricane counts in the North Atlantic between 1851 and 2019. Results indicate that once changes in observing platforms are considered, there has been no century-scale increase in either hurricane or major hurricane counts (Figure 7).

The authors noted that once the adjustments are applied, there is significant variability from year-to-year and from decade to decade and the unprecedented epoch of basin-wide hurricane and major hurricane counts since the mid-1990s is eliminated, as other periods of maxima appear during the late-19th century and mid-20th century, with minima during the early and late 20th century.¹¹ These multidecadal swings with recurring periodicity are likely attributable to the Atlantic Multidecadal Oscillation (AMO), while the period of highly suppressed activity between the 1970s and mid-1990s was probably influenced in part by increased aerosol use and a negative AMO state.¹¹
Some of this is also reflected in the number of hurricanes landfalling in the Continental United States over that same time period. Klotzbach et al. (2018)¹³ did a comprehensive study of landfalling hurricane data for the Lower 48 between 1900 and 2017. Using “best-track” data, the study found an overall slight negative trend, though not statistically significant, in both hurricane and major hurricane strikes.
Below I graphed CONUS landfall data covering the period 1851 to 2022. I’m confident enough in the historical data for Atlantic basin landfalls that I used the entire period of record. Based on this analysis, the number of hurricanes making landfall in the Contiguous United States has decreased slightly over the last 172 years (Figure 8a), while there has been no statistically significant trend up or down in Category 3-5 strikes (Figure 8b). (Please note that I didn’t insert a linear regression line on these two charts as the variables aren’t linear in nature; such a line would be statistically inappropriate).

For what it’s worth, the United States went through a 12-year “major hurricane drought” between 2005 and 2017, as no Category 3-5 hurricanes struck the mainland, an unprecedently quiet stretch. You can see this period stick out like a sore thumb in Figure 8b above. It was also during this period that Florida wasn’t hit by a single hurricane (Figure 9).
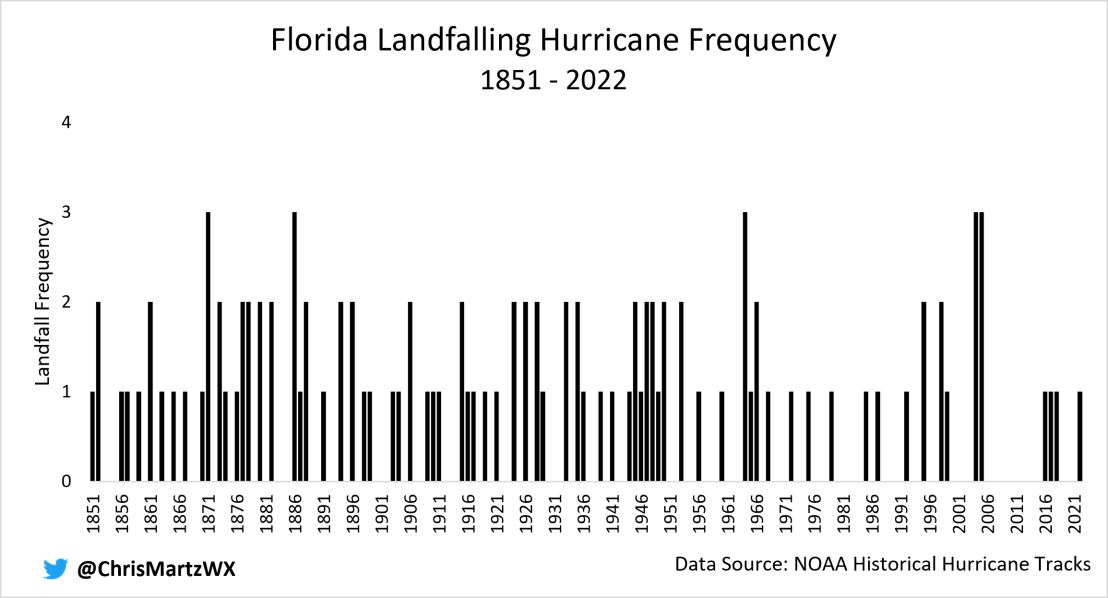
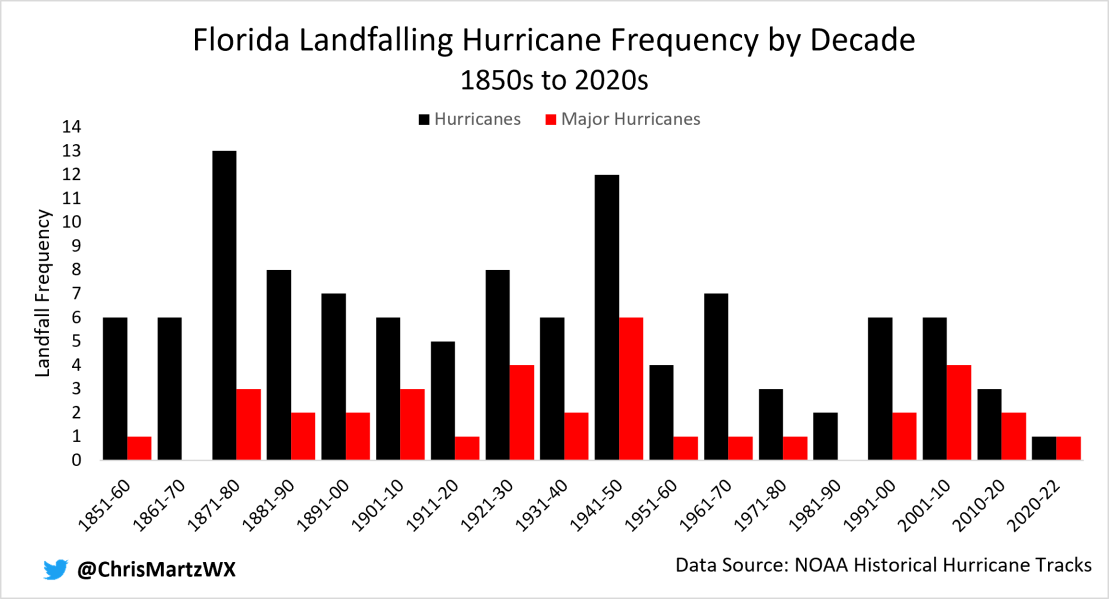
During the 1940s, Florida was directly hit by six major hurricanes, but it was in the 1870s that the Sunshine State was struck by a total of 13 hurricanes (Figure 10). Compare those statistics to the 2010s where only three hurricanes made landfall, two of which were Category 3-5. The downturn in direct hits can really be seen when the results are grouped by decade.
There’s also no evidence that hurricanes are becoming stronger at landfall. Pressure data is sparse prior to 1900, so data from 1851 to 1899 was eliminated. Graphed in the scatterplot below (Figure 11) is each hurricane’s MSLP at landfall since 1900. The red dot represents Hurricane Ian. Over the past 122-years, there’s a slight negative trend which innately means that hurricanes are making landfall at a stronger intensity. However, the R² value isn’t even 0.01 meaning that the linear trend is, to put it bluntly, meaningless. It’s also worth remembering that out of the 26 hurricanes to strike the United States at least at the same intensity as Ian (≤940 mb), 16 of them occurred before 1970.

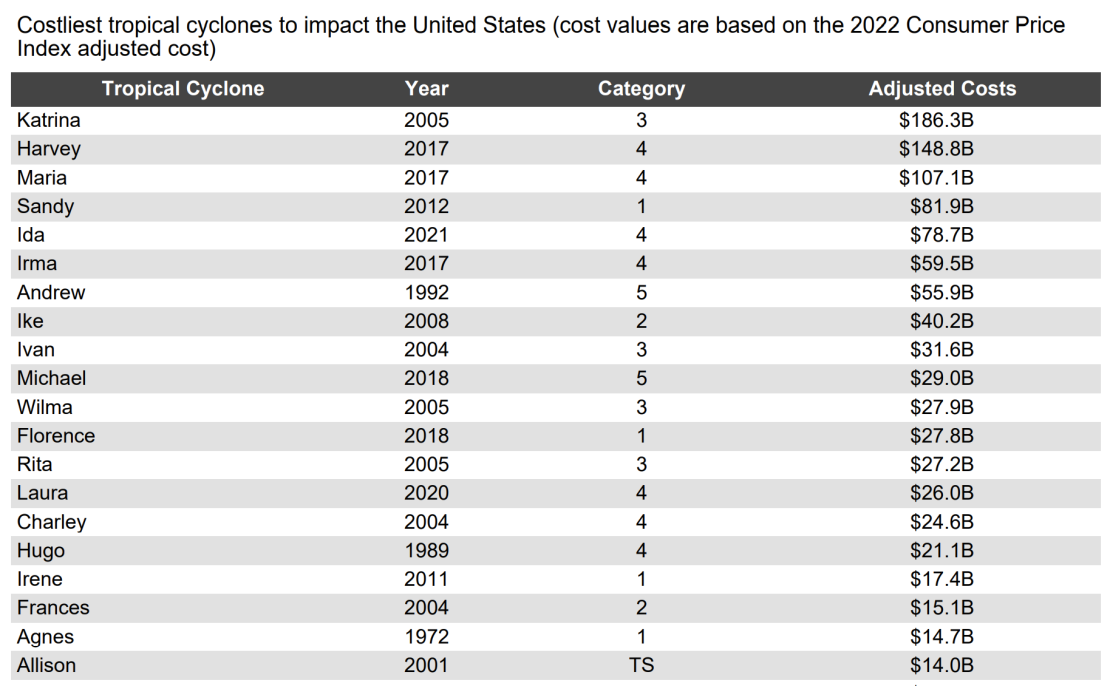
The New York Times reported, “Climate change has already contributed to a rise in destructive hurricanes like Ian, and its effects are still growing.” While it’s indeed true that hurricanes have become more destructive—17 of the top 20 costliest tropical cyclones to impact the United States (Figure 12) have been in the 21st century¹⁴—their argument rests on the case of misunderstanding of basic economics.
The rapid increase in cost of hurricane damage over the last few decades is explained entirely by the fact that there is more wealth being placed in the path of these destructive storms. Hurricanes have always hit Florida and there will be more to come in the future. If you build a house along the coast two feet above sea-level in a region that has always been susceptible to hurricane strikes, it’s nothing but a spectacular display of ignorance to blame climate change when your home is flooded from surge.
A 2018 study published in Nature Sustainability, co-authored by Dr. Chris Landsea, Dr. Phil Klotzbach and Dr. Roger Pielke, Jr., normalized the losses (in USD) from North Atlantic hurricanes between 1900 and 2017.¹⁵ After accounting for inflation, population growth, and per capita wealth, historical extreme event damage costs can be adjusted to an estimated value it would have if the event occurred today.
Weinkle et al. (2018) found that once Atlantic hurricane losses were normalized, the data doesn’t convey an upward trend, consistent with the lack of trends in both the number of hurricanes and major hurricanes coming ashore in the United States, or their intensity at landfall.¹⁵ On his blog, Dr. Pielke recently updated the chart from the study with data through last year. The data in Figure 13 below shows the estimated damage from United States hurricanes on the assumption that each season had the same levels of development as 2021.¹⁶ From the updated normalized loss statistics, out of the top 20 costliest hurricanes 11 of them occurred before 2000.

Claim #4: Hurricanes are intensifying more rapidly due to warmer ocean waters.
True or false? False.
Trends in the maximum intensity tropical cyclones attain during their life cycle isn’t the only area of interest among climate scientists. In fact, the rate at which these storms intensify has been subject to increasing scientific examination. It has been hypothesized that as ocean temperatures rise, developing tropical cyclones traversing over these warm waters are increasingly likely to undergo a process known as rapid intensification, something exhibited in Ian and many recent hurricanes just before landfall in the United States.
Rapid intensification (RI) is a meteorological process by which a tropical cyclone intensifies by at least 30 knots (35 mph, 55 km/hr) in a 24-hour period. In order for this to occur, not only must ocean water temperatures be sufficiently high enough (≥30°C or 86F), but vertical wind shear between 250 and 850 mb must also be low and there mustn’t be any ambient dry air being wrapped into the circulation, which lowers the vapor pressure which causes entrainment and evaporates clouds.
Because rapid intensification is often difficult to forecast with accuracy, it has become an active area of research. In recent years, a number of studies have been published examining trends in rapid intensification.
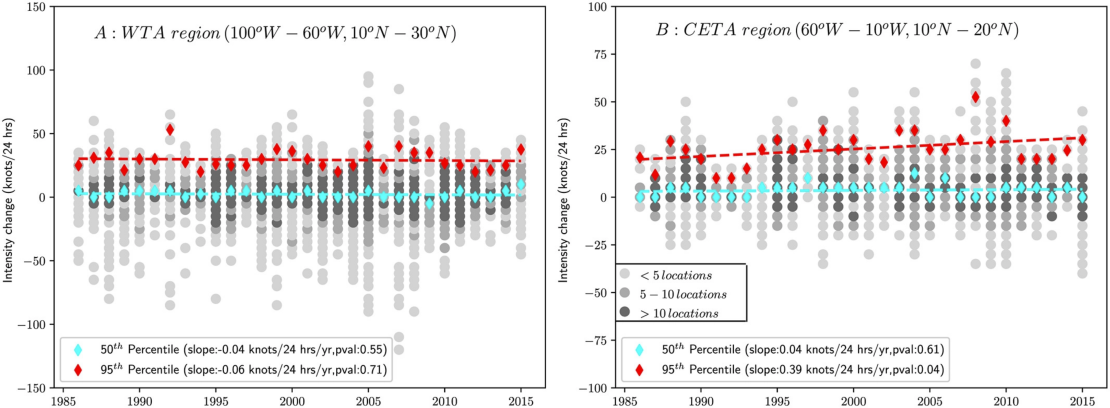
Balaguru et al. (2018), published in GRL examined the trends in 24-hour hurricane intensity changes in terms of percentiles for the Western Tropical Atlantic (WTA) and Central and Eastern Tropical Atlantic (CETA).¹⁷ According to the research findings, trends in the 50th percentile of 24-hour intensity changes are statistically insignificant in both the WTA and CETA (Figure 14a, left), which means that intensification rates have not changed during the period 1986 to 2015 in either region selected for analysis in the North Atlantic basin.¹⁷ However, what is interesting is that for the 95th percentile, while no trend is observed in the WTA, there is a 3.8 knot per decade increase in the CETA.¹⁷
An updated and more wholesale analysis of rapid intensification was conducted by Klotzbach et al. (2022), which explored trends in an array of different tropical cyclone metrics since 1990. Included in the supporting information attachment was the plot below (Figure 15) of global 30-knot rapid intensification (RI) and rapid weakening (RW) occurrences by year from 1990 to 2021. Briefly mentioned was that no significant trends of statistical significance materialized in the data.¹⁰

Also included in the supporting information was a table of the linear trends for each basin with significant trends accentuated by bold text. For the North Atlantic, no significant trends in either rapid intensification (RI) or extreme rapid intensification (ERI) events (50-knot increase in 24-hours) exist over the 31-year period analyzed.¹⁰ Keep in mind that while the time period analyzed is relatively small, this is the only period with the best and most consistent observational capabilities.
Thus, while it is likely that the anthropogenic culmination of greenhouse gases in the atmosphere has effectuated a gradual long-term warming trend, much of which has transpired in the ocean due to its higher heat capacity, increases in ocean heat content (OHC) brought about by warmer surface layer water diffusing down, it remains to be seen in the number of storms undergoing rapid intensification. This is particularly true for the Western Tropical Atlantic, which is an important consideration given that’s where Hurricane Ian rapidly intensified.
In theory, all else being equal, warming oceans provide more fuel for developing tropical cyclones. Yet, the lack of data supporting this theory only further emphasizes the very importance other environmental conditions (e.g., 250-850 mb wind shear, dry air and/or Saharan Dust, and instability) during the development and sustainability of tropical cyclones.
Despite a mountain of evidence to the contrary, this did not stop essentially every outlet [e.g., here, here, here and here] from maintaining the idea that Hurricane Ian’s rapid intensification was not only caused by background global warming, but is also something occurring with increasing regularity.
Claim #5: Hurricane Ian’s storm surge was made worse by sea-level rise and increasing storm size.
True or false? Missing Context.
Most of the damage associated with Hurricane Ian can be ascribed to storm surge, as discussed earlier in greater detail.
Storm surge, as defined by the National Weather Service,¹⁸ is “An abnormal rise in sea-level accompanying a hurricane or other intense storm, whose height is the difference between the observed level of the sea surface and the level that would have occurred in the absence of the cyclone.” Surveys are still underway in areas like Fort Myers Beach, but current estimates suggest there was a 15-foot surge from Ian, though that number could ultimately be higher or lower.
Without hesitation, the usual suspects in the media erroneously attributed the size of the storm surge to human-induced climate change:
- “A sea level rise of only a couple of inches can make a dramatic difference in how far inland a hurricane’s surge can travel.” — CNN (September 29, 2022).
- “There is…evidence that human-caused warming is increasing the size of these storms [tropical cyclones]. All else being equal, larger storms pile up greater amounts of water, leading to larger storm surges… Add sea level rise, and that’s the better part of [a] foot of additional coastal flooding baked into every single storm surge.” — The Guardian (September 30, 2022).
- Bill Nye even hinted that climate change is fueling larger storms that produce higher storm surge. — MSNBC.
In essence, it is argued that both sea level rise (SLR) and the growing diameter of tropical cyclones is leading to higher storm surge.
The first of these contentions is demonstrably false without any peer-reviewed literature or data. Recall, by definition, storm surge is a function of the observed water level from a storm relative to the current sea level. Thus, despite the incremental rise in sea-level, which more or less is reflective of long-term geological processes, SLR itself does not affect the magnitude of storm surge (i.e., how much the water rises with respect to current sea level).
Where SLR is applicable is in the fact that it does raise the level of the sea, meaning that one foot of SLR added onto a 4–6-foot surge (the magnitude of which does not change due to SLR) translates to the damage expected from a 5–7-foot surge. While this could make a difference in whether or not the coastal areas flood with weaker and smaller storms, it’s not as significant in terms of intense and particularly large storms like Ian. A 15-foot surge with sea-levels a foot higher than they were a century ago isn’t going to make much of a difference in terms of damage than a 15-foot surge would’ve done in 1922 with same levels of development, especially with a shallowly sloped coastline.
The size of a tropical cyclone, particularly the radius of the Vₘₐₓ, has a profound effect on the magnitude of storm surge. Yet, contrary to the claims made by Bill Nye, in The Guardian and by CNN, there isn’t much evidence to suggest that tropical cyclone radius of Vₘₐₓ has increased during the satellite era (e.g., Knaff, 2014)¹⁹ or that they will in the future. According to NOAA GFDL, “Storm size responses to anthropogenic warming are uncertain.”¹²
Traditionally, the size of a tropical cyclone is based on the mean radius of the outermost closed isobar, something we learn in ESCI 344, not the wind field, though the two are closely related. Deriving a long-term climatology of trends in Western Tropical Atlantic (WTA) tropical cyclone radius (or diameter) would be relatively easy to do with surface-maps for storms that moved through the Caribbean Sea, Gulf of Mexico, and up the east coast. As far as I know, this hasn’t been done, but would prove useful for a more extensive climatology.
Sea-level rise could certainly prove to be a major issue for coastal communities during the next couple of centuries assuming rates either remain constant or accelerate. However, that’s an entirely separate issue from the size of a hurricane’s storm surge, and with current scientific understanding, discernable trends in magnitude remain to be seen.
Claim #6: Hurricane Ian’s rainfall was increased by at least 10% thanks to climate change
True or false? False.
Perhaps my favorite headline to surface was from ABC News just one day after Ian’s devastating Florida landfall. It read, “Study finds that climate change added 10% to Ian’s rainfall.” To be fair, I shouldn’t exclusively throw ABC under the bus; a number of outlets ran this headline such as here, here and here.
The study conducted by two scientists, one of Stony Brook University and the other of Lawrence Berkely National Laboratory, mandated that the “climate crisis” made Hurricane Ian 10% rainier than it would have been if there was no global warming. According to Dr. Michael Wehner, who co-authored this study, he and Dr. Kevin Reed used the same methodology of hindcast attribution in a study both scientists took part in published earlier this year in Nature Communications.²⁰
Peak rainfall rates from Hurricane Ian were compared to that of approximately 20 different computer model scenarios of a storm possessing Ian’s characteristics making landfall in Florida in a world where there was no global warming. The problem with this methodology is that computer models are programmed with the assumption that rainfall rates increase in a warmer world. Thus, the authors were reaching a conclusion that they were assuming to begin with. Circular reasoning.
Apart from the fact that this study was completed only one day after Ian made landfall, possibly even more dazzling is that nobody in the press even questioned the validity of the findings. They unanimously ran with the story notwithstanding the fact that it has yet to be published in a scientific journal, let alone be subject to a rigorous peer-review process. Science!!
In all fairness, the idea that global warming yields more extreme rainfall, not just in hurricanes, but in thunderstorm complexes isn’t a new idea. Indeed, it stems from this physical principle that temperature sets a limit for how much moisture can be in the air at saturation. The vapor pressure—which is the partial pressure exerted by water vapor in a volume of air—at saturation is known as the saturation vapor pressure and is given by the Clausius-Clapeyron Equation:
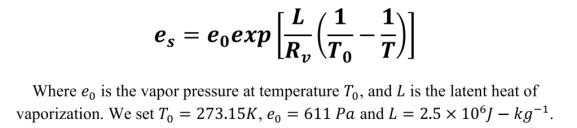
Anyone who has taken a basic meteorology course can spot the flaw right away. The Clausius-Clapeyron relation calculates the maximum amount of moisture the air can hold at a given temperature, but there must also be a correction for the solute and curvature effects. Thus, in theory, as the globe warms, the atmosphere can hold more water vapor without reaching saturation. That part is indisputably true. Yet, this relationship so commonly cited by climate activists does not quantify a.) how much water actually evaporates into the air, or b.) how much rain there will be and at what rate it will fall.
In an ideal world, all else being equal, if the maximum amount of water is evaporated into the air under warmer conditions, rainfall rates and amounts should be heavier. However, precipitation dynamics are governed by a multitude of factors unrelated to background warming of the climate. Oversimplifying a complex issue leads to erroneous results and flawed reasoning.
One issue I did not yet touch on is the misuse of event return periods [e.g., “1-in-500” or “1-in-1,000-year event”] as a basis for event attribution. It has become the latest buzz phrase in just about every headline covering extreme weather events over the past summer. This statistic has been worn out like an old, corny pick-up line.
Statistically speaking, a 1-in-1,000-year event for instance has a 0.1% chance of occurring in any given year at any one location. Earth is a big place, meaning that extreme events can and do occur every day, somewhere on the face of the planet. This makes it irresponsible to claim that climate change caused an “X” number of 1-in-1,000-year events to occur around the world in a given year.
Return periods of this extent also fit well beyond the scope of our instrumental climate data, which at best goes back give or take 150-years for certain locations. To compensate, a curve is applied based on numerous statistical assumptions. Resultantly, when an extreme event such as the rainfall from Hurricane Ian does occur, it can drastically (and artificially) alter the return periods simply because there isn’t enough instrumental data to compute a reliable long-term record from which reliable return periods can be calculated.
Concluding Remarks
Climate change is a multifaceted issue, and what the larger body of scientific work is saying needs to be accurately articulated to the public. Laypeople don’t often have access to scientists, so when new research is published, it is the job of journalists to break down complex topics into easily comprehensible tidbits, and perhaps even ask questions about the findings of a study. That’s what investigative journalism is.
Yet, when it comes to extreme event coverage, investigative journalism sorely lacks. Often, the same talking points are reiterated over and over again chalking up cookie cutter stories from one outlet to another. It’s increasingly hard to believe that this is sheer ignorance. After all, the press has extensively covered climate, energy and environmental topics for the last two or three decades and accurate information on the subject isn’t that hard to find. Constant misrepresentation or cherry-picking of data, and mischaracterizing research findings has led me to believe that this is all part of a much larger narrative being pushed.
This tendency to link climate change to every single weather event after is passes has in all honesty become tiresome. After careful examination of the data and literature, there doesn’t appear to be any reason to suggest that human-induced climate change played a significant role in the occurrence, intensification or storm surge and rainfall associated with Hurricane Ian. Any signal gets lost in the noise of natural variability.
As a final remark, this silly blame game does absolutely nothing to help recovery efforts and it most certainly does not help society as a whole mitigate future losses due to increased vulnerability to natural disasters as more and more wealth is placed in Mother Nature’s path.
References
[1] “Saffir-Simpson Hurricane Wind Scale.” National Hurricane Center and Central Pacific Hurricane Center. Accessed October 11, 2022. https://www.nhc.noaa.gov/aboutsshws.php.
[2] “HURDAT Re-Analysis Various Data Tables.” Atlantic Oceanographic and Meteorological Laboratories. Accessed October 11, 2022. https://www.aoml.noaa.gov/hrd/hurdat/Data_Storm.html.
[3] Kantha, Lakshmi. “Time to Replace the Saffir-Simpson Hurricane Scale?” Eos, Transactions American Geophysical Union 87, no. 1 (2006): 3. https://doi.org/10.1029/2006eo010003.
[4] Powell, Mark D., and Timothy A. Reinhold. “Tropical Cyclone Destructive Potential by Integrated Kinetic Energy.” Bulletin of the American Meteorological Society 88, no. 4 (April 1, 2007): 513–26. https://doi.org/10.1175/BAMS-88-4-513.
[5] Walker, Amanda M. et al. “A Fiscally Based Scale for Tropical Cyclone Storm Surge.” Weather and Forecasting 33, no. 6, (December 1, 2018): 1709–23. https://doi.org/10.1175/WAF-D-17-0174.1.
[6] Klotzbach, Philip J. et al. “Surface Pressure a More Skillful Predictor of Normalized Hurricane Damage than Maximum Sustained Wind.” Bulletin of the American Meteorological Society 101, no. 6 (June 26, 2020): E830-E846. https://doi.org/10.1175/BAMS-D-19-0062.1.
[7] Knaff, John A., and Raymond M. Zehr. “Reexamination of Tropical Cyclone Wind-Pressure Relationships.” Weather and Forecasting 22, no. 1 (February 1, 2007): 71-88. https://doi.org/10.1175/WAF965.1.
[8] Lawrence, J., B. Mackey, F. Chiew, M.J. Costello, K. Hennessy, N. Lansbury, U.B. Nidumolu, G. Pecl, L. Rickards, N. Tapper, A. Woodward, and A. Wreford, 2022: Australasia. In:Climate Change 2022: Impacts, Adaptation, and Vulnerability.Contribution of Working Group II to the Sixth Assessment Report of the Intergovernmental Panel on Climate Change [H.-O. Pörtner, D.C. Roberts, M. Tignor, E.S. Poloczanska, K. Mintenbeck, A. Alegría, M. Craig, S. Langsdorf, S. Löschke, V. Möller, A. Okem, B. Rama (eds.)]. Cambridge University Press, Cambridge, UK and New York, NY, USA, pp. 1581-1688, doi:10.1017/9781009325844.013.
[9] “Colorado State University.” Global Statistics compared with climatology. Accessed October 11, 2022. http://tropical.atmos.colostate.edu/Realtime/index.php?arch&loc=global.
[10] Klotzbach, Philip J., Wood, K. M., Schreck, C. J., Bowen, S. G., Patricola, C. M., & Bell, M. M. (2022). Trends in global tropical cyclone activity: 1990–2021. Geophysical Research Letters, 49, e2021GL095774. https://doi.org/10.1029/2021GL095774
[11] Vecchi, G.A., Landsea, C., Zhang, W. et al. Changes in Atlantic major hurricane frequency since the late-19th century. Nat Commun 12, 4054 (2021). https://doi.org/10.1038/s41467-021-24268-5
[12] Knutson, Tom. “Global Warming and Hurricanes.” Geophysical Fluid Dynamics Laboratory. Accessed October 11, 2022. https://www.gfdl.noaa.gov/global-warming-and-hurricanes/.
[13] Klotzbach, Philip J., Bowen, Steven, Pielke Jr, Roger, and Bell, Michael. “Continental U.S. Hurricane Landfall Frequency and Associated Damage: Observations and Future Risks.” Bulletin of the American Meteorological Society 99, no. 7. (July 1, 2018): https://doi.org/10.1175/BAMS-D-17-0184.1
[14] NCEI.Monitoring.Info@noaa.gov. “Billion-Dollar Weather and Climate Disasters.” Billion-Dollar Weather and Climate Disasters | National Centers for Environmental Information (NCEI). Accessed October 11, 2022. https://www.ncei.noaa.gov/access/billions/.
[15] Weinkle, J., Landsea, C., Collins, D. et al. Normalized hurricane damage in the continental United States 1900–2017. Nat Sustain 1, 808–813 (2018). https://doi.org/10.1038/s41893-018-0165-2.
[16] Jr., Roger Pielke. “Series: What the Media Won’t Tell You about . . . Hurricanes.” SERIES: What the media won’t tell you about . . . hurricanes. The Honest Broker by Roger Pielke Jr., June 1, 2022. https://rogerpielkejr.substack.com/p/what-the-media-wont-tell-you-about?r=2n1fv&utm_medium=ios&s=r.
[17] Balaguru, Karthik, Gregory R. Foltz, and L. Ruby Leung. “Increasing Magnitude of Hurricane Rapid Intensification in the Central and Eastern Tropical Atlantic.” Geophysical Research Letters 45, no. 9 (2018): 4238–47. https://doi.org/10.1029/2018gl077597.
[18] NOAA’s National Weather Service. “Glossary.” November 1, 2004. https://w1.weather.gov/glossary/index.php?word=storm%2Bsurge.
[19] Knaff, John A., Longmore, Scott P., and Debra Molenar. “An Objective Satellite-Based Tropical Cyclone Size Climatology.” Journal of Climate 27, no. 1 (January 1, 2014): 455-476. https://doi.org/10.1175/JCLI-D-13-00096.1.
[20] Reed, K.A., Wehner, M.F. & Zarzycki, C.M. Attribution of 2020 hurricane season extreme rainfall to human-induced climate change. Nat Commun 13, 1905 (2022). https://doi.org/10.1038/s41467-022-29379-1.
Originally posted on Chris Martz’s Blog
Or you could say global warming prevented Ian from becoming a Cat 5 storm.
Actually Ian’s cloud cover regulated it. Hurricanes only survive “transit” of Florida if Florida’s local environment adds energy and Ian had most the state under cloud cover for more than 48 hours prior to contact with the storm intensity.
Great, comprehensive article. Thanks for it. As a layman it looks to me as though this year is turning out to be very inactive for Atlantic hurricanes. Am I right? The end of the hurricane season is approaching.
The alarmists haven’t had much of an opportunity to scare us about hurricanes this year. It must be really frustrating for them.
Tom, they’ve moved on…..now it’s “rapid intensification”
It’s always something. 🙂
Reminds me of a skit on SNL where the character “Rosanna….” sez, “its always sumptiin”.
So it seems to be with the AGW cultists, only the “sumptin” is focused on humans causing weather variables which they describe as “climate change”.
The entire claim by the cultists could be ignored as chicken little claims if not for the idiots in media and the lefty government. Even those voices are becoming dimmer lately. Thank God.
Delusional activists utterly fail to recognize their own absurdities and hubris. Unfortunately, failure to recognize self hubris is the personality flaw of narcissists. They tend to double down and dig themselves deeper in their own pit of ridicule.
Yes, this year was predicted to exhibit above average activity. As of right now, it looks like the 2022 Atlantic season will actually have below average activity. (But the season is not over.)
However, the current Atlantic picture is a little surprising for October 16th.
Click the link below to the National Hurricane Center to open your little “surprise”! (I promise, the surprise is NOT a malicious link.)
https://www.nhc.noaa.gov/
It’s to a USGOV site – of course it’s malicious.
You are of course correct.
My bad!
We have fun on the occasional Thursday with Blaze TV who do UFO Thursdays. “Ancient Aliens” is a prominent feature, and with a catchphrase… Could… blah blah blah (von Daniken type proposition about extraterrestrials)…
…Ancient Astronaut Theorists say Yes.
Is Global Warming Responsible for Hurricane Ian?
Climate Change/Global Warming Theorists say Yes.
Just as meaningful
The true estimate of Ian’s power the author states as a high end 3 or low end 4 is exactly what I thought and said it was before it was even across the state. I can’t disagree with any of the authors conclusions. Except I could have sworn that at one time just before the Eyewall Replacement Cycle began the NHC had Ian’s top sustained windspeed at 155 mph which would have made it right at the top of the scale for a CAT IV.
I’m a much better hurricane expert than they are. I surveyed the Chandeleur Islands after Camille and Andrew in Louisiana after it strengthened and went into the Atchafalaya Basin where there wasn’t much population or measurements. It took out considerable trees there and even beyond. Camille almost topped the highest sand dune ~12′, but wiped out Breton Island and killed lots of hard clams. Mine and many other houses correctly built survived Harvey and I’ve been in and run from others. While improved, lots of self-inflicted damage.
Not all hurricanes kill fish, but Andrew left a lot of many species on the central Louisiana coast. Over two weeks too late to examine so not sure of cause, may have just been trap of storm. Near there Hurricane Juan in 1985 carried several dozen at least over an estimated hundred miles of rarely known Clymene dolphins that live well offshore, died on Point au Fer still alive based on the scraping. Hurricanes are not consistently even, would like to see complete wind maps of one someday.
Also this on the Last Island hurricane, probably a manta ray hyped by the press, perhaps carried from the delta. There is a recent book out on the storm that I don’t have handy, but they badly need to read it. Barrier Islands require large subsidies. Last Island (Isle Dernieres), historically since a large nesting area, is barely holding on.
Brasseaux, C. A. and H. D. Hoese. 1991. Close encounter with a creature “of the finny tribe”: Louisiana’s sea monster sighting of 1856. Gulf Coast Historical Review. 7(1):1-17.
Is Global Warming Responsible for Hurricane Ian? The Evidence Says No
___________________________________________________________
The Mainstream Misleadia didn’t really say that. What NPR and the whole gang generally said was:
Climate change supports rapid intensification of hurricanes NPR
There was also the claim that Climate Change made hurricanes move slower, so they dump more rain.
The problem is, there’s no way for ordinary clods like me to check those two claims out. I’m forced without any information to the contrary to take them at their word. The only opposition I can mount is that their word, NPR most of the media and climate science isn’t very good.
“I’m forced without any information to the contrary to take them at their word”
Why? If someone is a notorious liar do you still take them at their word? So why would you with anything the media says?
I dont’ get it. Assume they’re lying sacks of crap and move on.
I do not take them at their word. They are saying they have statistically shown rapid intensification, when they have done no such thing.
Ask them to see the measurements of hurricane intensification speed over the last three full cycles of the AMO. The Atlantic Multidecadal Oscillation has a period of roughly sixty years.
When they have 180 years of satellite observations that exhibit statistically significant rapid intensification, then I will START to believe their model MAY be correct.
Until then, their conclusions are definitely NOT scientific – because they lack sufficient data!
Common sense says NO. Don’t need pages of charts and formulas to tell me that….
Thanks. Some things in this world are false at first look or on its face. Prima facie is the legalese term.
The notion that a warmer world is a looming existential disaster is one of those things.
How could global warming be counted as a factor when it was a quiet storm season during the hot summer and Ian occurred during the cooler temps of September?
The list of strongest hurricanes in the article confirm my memory that hurricanes are a late summer/autumn phenomenon – none on the list are from July and few from August, and an October storm is high on the list.
Nice article! Thanks.
The maximum sustained wind speed reported at landfall of 150 mph is not consistent with any land or buoy-based measures. We have been over this so I won’t belabor the point. I just don’t understand how anyone with experience in hurricane damage can look at the pictures and think there was 150 mph sustained wind.
Here is what I find just plain weird. Here is an exert from the 8pm update from the NHC on Sept 28th. At 8pm, when Ian was well on shore, the NHC is saying max sustained winds were 115. I’m sorry, this just isn’t measured according to the Saffir-Simpson methodology.
Here is a link to the data at Punta Gorda International Airport on Sept 28th
Punta Gorda, FL Weather History | Weather Underground (wunderground.com)
At 3 pm with Ian 20 miles west according to the NHC, Punta Gorda reported sustained winds in the 70s. Yet the NHC center reports maximum sustained winds of 155 mph. What in the world does “maximum sustained winds” mean? Sustained wind speeds are reported as 1-minute averages. For SS calculations they need to be measured 10 meters off the ground.
The NHC lied about the max sustained winds. Further evidence is found in the transponder data from the actual hurricane hunter aircraft as it transited the eyewall as Ian made landfall. Accounting for the Hercules max manuevering speed in turbulence, the plane’s track, the wind direction in the eyewall at the plane’s location and the transmitted ground speed from the transponder (ADS-B) the winds in the eyewall at 10,000 feet MSL were between 110 and 120 MPH. Period, no debate this is actual data. Not just spot data but data over a period if time and space as the plane was doing 230 mph airspeed and the transit lasted for at least 15 miles and several minutes.
I posted links to the actual ADS-B data in a previous post. This combined with a host of ground based wind measurements and the lack of severe wind damage shows their positing that the max sustained winds were 155 mph is simply false. At best it was a strong Cat 2 and at worst a weak Cat 3 at landfall.
They have been adjusting the wind speeds upwards now for around 5 years, often reporting flight level winds as wind speed on the ground (or sea level), or ignoring lower speeds reported from the dropsondes or the transponder data to put their guesstimate down as the “official” wind speed. Often ocean buoys or land based stations reveal their lies, so they tend to reduce the fudge factor as it approaches land.
They used to make the raw dropsonde data transmitted from the hurricane hunters available, but this year you cannot find the data – because people were pointing out that data did not correspond with the official narrative…. but they cannot hide the ADS-B data of the plane’s transponder. (which I will argue is better than dropsonde data by far when the plane transits the eyewall)
It is indeed a dangerous and stupid game to play, as if they cry wolf too often, no one will listen to legitimate warnings!
It is indeed a dangerous and stupid game to play, as if they cry wolf too often, no one will listen to legitimate warnings!
_____________________________________
They’ve been crying wolf for over 40 years and getting away with it.
Thanks, Nelson.
The way these authoritarians are gonna get us is by “misinformation.”
They will FIRST censor what they do not like – which is already happening.
Then, they will impose legal penalties. Jail, prison, etc.
At the SAME TIME, they are advancing their agenda with….
Misinformation.
The examples from recent years are too numerous. Trump-Russia has been debunked.
Why is no one calling this “misinformation,” and excoriating the perpetrators?
“Trump called Nazi decent people:” debunked.
“Trump made fun of physically handicapped people:” debunked.
“Take the Covid vaccine to reduce transmission:” debunked.
“Restrictions on oil drilling and refining not responsible for inflation:” no one ever believed this.
“Inflation Reduction Act” will reduce inflation. Nope. Fake news all the way.
“Life does not begin at conception;” has always been misinformation for a hundred years.
Can you post a link to the surface measurement at 26.0N, 83.0W at 10:29Z that you feel is inconsistent with category 4 status? I’d like to review it.
Can you post a link to the ADS-B data that you mention above? I’d like to review it.
amen brother !
& it didn’t help that up until the storm actually turned in on land where it did, that for at least two days the forcasted path of the storm was to go in on Tampa.All the articles I read said Tampa,Tampa,Tampa, in fact there were all kinds of maps with the cone going thru Tampa & bypassing Ft Meyers completely. If I lived in Ft Meyers I would be pretty upset that they missed it that bad & could it be why there were so many casualites cause a lot of people didn’t expect it & weren’t well prepared for it.
as they expected the fringes of it & got the direct hit instead.
Nelson said: “The maximum sustained wind speed reported at landfall of 150 mph is not consistent with any land or buoy-based measures.”
Yes it is. Land and buoy measurements are consistent with the NOAA2, AF301, AF307, KTBW, GOES16, etc. measurements confirming Ian’s category 4 classification.
Nelson said: “I just don’t understand how anyone with experience in hurricane damage can look at the pictures and think there was 150 mph sustained wind.”
Winds weren’t sustained at 150 mph over land. They were sustained at 150 mph in the location of the band of maximum winds over the open water in the eye wall.
Nelson said: “Here is a link to the data at Punta Gorda International Airport on Sept 28th”
1) The Punta Gorda station was not in the maximum winds.
2) The Punta Gorda station failed so it would not have been able to report the maximum wind even if the band of maximum wind occurred there.
Nelson said: “What in the world does “maximum sustained winds” mean?”
It is the maximum sustained wind speed located anywhere inside the outer most closed isobar of the tropical cyclone. For Ian this occurred at 25.9N, 83.1W at 10:13Z per NOAA2, 26.0N, 83.0W at 10:29Z per AF301, and 26.8N, 82.5W at 17:09Z per AF307.
“Winds weren’t sustained at 150 mph over land. They were sustained at 150 mph in the location of the band of maximum winds over the open water in the eye wall.”
If these winds were not at landfall but instead were over open water, then why is the Vmax of 150mph used as the landfalling windspeed intensity?
Tropical cyclone intensities are set based on Vmax_anywhere not Vmax_land.
The caption from Table 2:
“Table 2. Top five strongest hurricanes to landfall in the Continental United States since 1851 by maximum sustained wind speed (Vₘₐₓ) at landfall (NOAA HURDAT2). T indicates a tie.”
Landfall has nothing to do with it. It is always based on Vmax anywhere within the outermost closed isobar. In fact Vmax is usually located over the ocean even at the moment of landfall. This is primarily because land slows the wind due to the significantly higher surface roughness.
I have found no measured data from buoys or land-based measures consistent with what you are saying. Yes, I see the data for the various flights. They estimate surface wind speeds, but they don’t measure them.
The NHC claimed that Ian came ashore with 150 mph sustained winds. Now you say that 150 mph wasn’t over land. So what was the sustained wind speed at land fall?
Punta Gorda was 20 miles away from the center according to the 3 pm NHC update. While Punta Gorda may not have been in the highest wind, where on land was 100+ sustained wind speed measured.
That’s what I found as well, but see my other post (just below yours).
Buoy data from the NDBC website. “WU” = “Weather Underground” land-based weather stations, mostly at airports.
NB : Times in UTC, subtract 5 (or 6 ?) hours to get them in EDT.
Nelson said: “I have found no measured data from buoys or land-based measures consistent with what you are saying.”
Did you not see the VENF1, BCGF1, Punta Gorda, Cape Coral, etc. data?
Don’t hear what I’m not saying. I’m not saying these stations recorded 115 kt winds. I’m saying they recorded winds consistent with Vmax > 115 kt. Remember, none of the ground stations observed Vmax. But what they did observe was consistent with the Vmax that was observed.
Nelson said: “Yes, I see the data for the various flights. They estimate surface wind speeds, but they don’t measure them.”
They are measured. Both via SFMR and dropsonde.
Nelson said: “The NHC claimed that Ian came ashore with 150 mph sustained winds. Now you say that 150 mph wasn’t over land. So what was the sustained wind speed at land fall?”
The maximum sustained wind speed at landfall as measured by AF307 was 121 kts (140 mph). The NHC will likely enter 140 mph (IMHO) as the official landfall intensity as part of their “best track” product that will be available in 2023 for the 2022 season.
The sustained wind speed over land was 92 kts (106 mph) at Cape Coral.
These values are consistent with each other.
The HAFS analysis at 18Z should help you visualize what was going on. Notice that Vmax was not occurring where VENF1, BCGF1, Punta Gorda, Cape Coral, etc. were located. It was occurring well offshore over the open ocean. NOAA2, AF301, and AF307 were targeting (intentionally) where Vmax was occurring.
Nelson said: “Punta Gorda was 20 miles away from the center according to the 3 pm NHC update.”
And about 30 miles from where Vmax was occurring at the time it (the KPGD station) failed with a 120+ mph wind gust and when Cape Coral was observing 92 kts sustained winds over land.
Remember, not only was the northeast quadrant the weakest part of the storm, but it was also over land where the surface roughness slows the winds down a lot. The fact that Cape Coral was still observing winds that were only 30 kts less than Vmax is actually pretty remarkable given the storm structure and its location relative to Vmax. It would not have been unexpected for the land winds to be even less. It is a testament to just how strong Ian actually was.
bdgwx said: “The NHC will likely enter 140 mph (IMHO) as the official landfall intensity as part of their “best track” product”
I should be careful what I say. I just remembered that AF307’s mission plan took it through Ian in a more NW-to-SE line to comply with flight rules prohibiting encroachments over land. As a result AF307 may not have actually surveyed Vmax. If I remember correctly that 121 kts measurement was in the S or SE portion of the eyewall, but according to the NOAA2 and AF301 surveys, the HWRF, HMON, and HAFS analysis, and the KTBW radar data Vmax was likely in the SW portion of the eyewall. For that reason the NHC may opt to keep the 135 kts figure as the Vmax at landfall.
It will be interesting to see what the best track analysis concludes in terms of both peak and landfall intensity. There are other sources of data that are not available in real-time. The NHC will evaluate all of the data and even perform calibration test of the instruments after-the-fact. One notable outlier in the data is buoy FMRF1. Was it damaged?
Following our exchange under a previous WUWT article on hurricane Ian I continued looking (out of curiosity) for where all these “maximum sustained wind speeds of 155 mph” were coming from.
I eventually found the IBTrACS (V4) dataset (link to website), and downloaded the latest (11th of October) version of their netCDF dataset.
Note that the HDF5 compressed “_ALL_” file is around 25 MB in size, more manageable (to me !) than the CSV / ASCII text files are.
NB : That database contains “tracks” for 13662 tropical storms, with offsets 0 to 13661. Hurricane Ian has offset 13649.
Extracting the “lat”, “lon”, “time”, “usa-wind” and “usa_pres[sure]” data for Ian I produced the graphic below.
Notes
1) The “usa_agency” field for Ian was “nhc_working_bt”, rather than the more common “HURDAT_ATL” or “ATCF”. I have no idea who the “NHC’s BT Working (Group ?)” is.
2) Landfall was closer to Gasparilla Island than Sanibel Island (Cayo Costa).
3) According to the IBTrACS data Ian was indeed a Category 4 at landfall, at 135 knots it was only 1 knot away from being a Category 5. When the centre of the eye reached Punta Gorda it had almost “weakened” to a Category 3.
4) The strongest winds around a hurricane aren’t in the (middle of the) eye, but often in the eye-wall and “peripheral” quarters (NW or NE ???). I don’t know where the strongest winds for Ian were relative to the “track” shown below.
5) 0.1 degrees of latitude (/ longitude) is just over 11 kilometres, or ~7 miles. It is unclear just how wide the “reconstituting” eye was during this time period.
6) The various “buoy” and land-based weather stations, including those that didn’t either “break” or lose power, show sustained wind speeds considerably less than 155 mph …
Bugger ! I managed an “off by one” error when reading the pressure values.
It was actually 938 mb about an hour before landfall, and 949 mb as the eye passed over Punta Gorda.
Try the following instead.
Mark BLR said: “4) The strongest winds around a hurricane aren’t in the (middle of the) eye, but often in the eye-wall and “peripheral” quarters (NW or NE ???). I don’t know where the strongest winds for Ian were relative to the “track” shown below.”
It was left of the track. For example, AF307 located Vmax at 26.8N, 82.5W at 17:09Z. Also see the HAFS analysis at 18Z I posted. When Ian was upgraded to category 4 Vmax was around 26.0N, 83.0W at 10:30Z. The KTBW radar was consistently showing the left side of the storm as being where Vmax was located. Interestingly, KTBW was observing increasing wind speeds that eventually topped out at about 170 kts (200 mph) with one bin even recorded at 190 kts (220 mph) around 16:00Z (between the recon flights) at typical recon flight level consistent with the possibility that Ian may have actually obtained category 5 status albeit briefly just prior to landfall. Ian’s flight level to surface wind reduction was about 0.9 (typical of strong cyclones) suggesting Vmax could have been as high as 150 kts! Unfortunately there was no surface observation to corroborate that KTBW observation. Thus, the NHC kept Vmax at 135 kts.
Mark BLR said: “5) 0.1 degrees of latitude (/ longitude) is just over 11 kilometres, or ~7 miles. It is unclear just how wide the “reconstituting” eye was during this time period.”
At 18Z the RMW (radius of maximum wind) was about 18 nm. The eye can be easily seen via the KTBW radar. The data can be found here.
Mark BLR said: “The various “buoy” and land-based weather stations, including those that didn’t either “break” or lose power, show sustained wind speeds considerably less than 155 mph …”
Correct. But, can you find any ground station or buoy at say 26.0N, 83.0W where Vmax was occurring at the time of upgrade to category 4 or 26.8N, 82.5W where Vmax was occurring just prior to landfall?
After navigating to the “…2022/09/28/KTBW/” subdirectory I discovered a set of “File type unknown” (to my computer setup …) files.
From the NCEI “Decoding Utilities and Examples” webpage (direct link)” :
Unpacking (standard / generic / widely used) netCDF is “easy”, that’s something else entirely … and it looks like you posted the relevant plot in your reply to “Nelson” above anyway.
I use GR2Analyst and AWIPS to load the radar data. GRAnalyst is like $250, but AWIPS is free. I believe IDV can open the files as well, but I don’t typically use it.
Off topic…GR2Analyst is what the NWS typically uses for post mortem analysis of events. It is a one of a kind software package that can take the full radar volume and render it in 3D. This is what the Joplin tornado looks like via the radar data. Not only can you see the mesocylone and vertical structure of the tornado but the purple colors represent the debris getting sucked up.
No, but that’s a long way offshore !
How many buildings were damaged by hurricane Ian at 26.8N, 82.5W as it made landfall (~20 miles east of those coordinates) ?
Mark BLR said: “No, but that’s a long way offshore !”
Exactly. Ground stations were incapable of measuring Vmax.
Mark BLR said: “How many buildings were damaged by hurricane Ian at 26.8N, 82.5W as it made landfall (~20 miles east of those coordinates) ?”
None. There are no buildings at 26.8N, 82.5W.
And that’s part of the problem with the article’s argument. There was nothing that could be damaged at the Vmax location. Nevermind, that the Saffir-Simpson scale is not based on damage anyway.
Great post. Bookmarked. The minimum eye pressure/max sustained wind discussion is very good. Many find the NHS max sustained wind reports suspect—inevitably significantly higher than ground observations during and after landfall.
As for any relationship to AGW, the Ryan Maui ACE data definitively say no. And have for years.
Salute!
Very good artice and discussion.
Being a hurricane vet, I like sustained pressure criteria better than wind speed to rate the storms. Much of the wind damage occurs due to the mini-tornado vortexes that come thru. You can actually have your ears pop due to pressure changes. But sustained pressure seems a good measure of merit. During a minimal cat 2 storm(Erin) I had a 70 foot pine tree come crashing thru the roof. I had my garage door open due to the direction of the wind and the wind was only about 50 or 60 mph at the time. Heard the thing coming down the street and whammo! No other house had a tree fall on them,and only Opal a coupla months later had trees falling everywhere…a much stronger storm with higher surge on the coast and the sustained wind at my house was demonstrably higher then Erin.
Secondly, the water damage is different from the wind, and worst happens right on the coast where you have a 15 foot surge with 15 foot waves on top and the 120 mph wind. Just 10 or 15 feet elevation makes a lot of difference. Somehow I have a hard time believing that a few millimeters of sea level rise makes any difference. And ditto for high tide or low tide – Katrina’s 25 to 30 foot surge was ten times what the basic tidal change for that part of the coast – figure 25 feet higher!
Gums sends…
I think minimum pressure is better too. Integrated kinetic energy is better yet.
Thank you, glad you liked the article. I thought pressure vs Vmax would be an interesting aspect to examine in greater detail. Seems to have been popular among readers.
I liked it too and will post this in my forum to spread the information around for the few who still care about science research.
Thank you.
Make sure you include the NOAA2, AF301, AF307, KTBW, GOES16, etc. observations that were not included in this article.
Good suggestions, I will eventually have a Meteorological link to dozens of sites that covers weather events as they unfold and some databases to build charts from.
The forum is only 2 months old but will have some old files transferred from my old Climate forum that Wayback Machine trawled unusually deep as they apparently liked my site to the point that most of the forum still exist.
Rud Istvan: “inevitably significantly higher than ground observations during and after landfall.”
They’re always higher than ground observations at landfall. That is expected. What would be suspect would be if Vmax_land > Vmax_anywhere when all or part of the eyewall was not on land yet.
Regarding sustained wind velocity versus ground observed velocity: isn’t it the same ground effect that forces wind turbines to be very tall? Maybe the NHS should revisit historical hurricane records and upgrade any hurricane categorized solely on ground measurements one category higher.
So when you “follow the science” as Chris Martz has done above, why aren’t retractions from major news agencies about their false headlines and reporting happening?
Tropical system strength, speed and direction are determined by a multitude of factors, not just water temperature. If all these factors are not considered then the any “conclusions” are meaningless.
There is no global warming.
Joe Bastardi went off on the liars in his last Saturday Summary and said flat out the Saffir-Simpson needs to be dropped.
I agree with replacing Saffir-Simpson. Integrated Kinetic Energy is a better metric, but it requires knowledge of the spatial distribution of the wind field which would be difficult to assess for cyclones prior to the satellite era.
Case in point, climate change fueled Hurricane Ian. Here’s just a sample of some of the headlines from a simple Google search:
none of the titles say that
https://google.gprivate.com/search.php?search?q=climate+change+fueled+Hurricane+Ian
https://www.miamiherald.com/news/local/environment/climate-change/article266611416.html
When asked, scientists like Kevin Reed usually push back. Most researchers agree it’s not valid to point to a single storm and say it was “caused” by the warming world. Too many variables. “That is a question that is really difficult to answer. There is no ‘what would have September 2022 looked like without climate change?’ We don’t have that,” said Reed,
Read more at: https://www.miamiherald.com/news/local/environment/climate-change/article266611416.html#storylink=cpy
man it sucks when you cant even get google to support your scepticism
Exactly. It’s not binary. Climate change isn’t 100% responsible for Ian (or any other hurricane), but nor is the influence 0%. Even if you remove the few percentage points (or whatever) increase in intensity due to the warmer overall SSTs Ian was still going to cause significant damage. This is true for most extreme weather events. I will say one notable exception might be heatwaves. The studies on the Siberian 2020, Pacific Northwest 2021, etc. heatwaves suggest statical anomalies that make it nearly impossible for them to occur sans global warming.
Right, so those heatwaves saw high temperatures at a given location exceed the 1960-1989 average for each day for 5 consecutive days by 5C (9F) [WMO definition]? Let’s see the data.
Phillip et al. 2021
Ciavarella et al. 2021
CBS -How climate change is making storms like Hurricane Ian stronger more quickly
Time.com – Yes, Climate Change Is Making Storms Like Hurricane Ian Worse
Phys.org – Hurricane Ian: How climate change is making North Atlantic tropical storms worse.
etc…..
Michael E Mann and Susan Joy Hassol in the Guardian:
“Too often we still hear, even from government scientists, the old saw that we cannot link individual hurricanes to climate change. There was a time when climate scientists believed that to be true. But they don’t any more.”
Just for chuckles and grin, I sent the entire piece to NPR’s Public Editor.
Chris Martz said: “The highest wind gust associated with Hurricane Ian that was reported was 140 mph in Cape Coral, followed by 135 mph in Punta Gorda, 132 mph in Port Charlotte, 128 mph in Grove City, 126 mph at Pelican Bay and 112 mph at Southwest Florida International Airport in the South Fort Myers area.”
And those are all land stations none of which were in the band of maximum wind. The maximum wind was occurring over the open water. NOAA2 and AF301 reported 137 kts (158 mph) at the surface around 26.0N, 83.0W. After those recon missions KTBW was reporting 170 kts (200 mph) at flight level which is not inconsistent with the possibility that Ian actually strengthened to category 5 status before it weakened back to category 4 status at landfall Why do you not mention the observations in the band of maximum wind?
Chris Martz said: “Thus, one could reasonably argue in good faith one of two things:
Or possibly 3. Cyclone intensities today and in the past are reasonably estimated but that contrarian bloggers and comments do not understand that the maximum wind can occur anywhere within the outermost closed isobar of the storm, but is usually within the eyewall over the open water. It is not measured at cherry-picked sites especially those over land and that you cannot claim that stations outside the band of maximum winds are observing the maximum wind.
Why are you so invested in Cat.4/5 status when the damage doesn’t support that?
Tropical cyclone classifications are not based on damage.
When you want to “juice” the numbers to support a narrative, that’s offtly handy, isn’t it?
And yet the article here is actually downplaying Ian’s classification based on damage.
Well, when it appears smoke is being blown up our ass, someone has to call a spade a spade…
The article is calling a spade a diamond in this case.
That strange. The NOAA says: “The Saffir-Simpson Hurricane Wind Scale estimates potential property damage.”
https://www.nhc.noaa.gov/aboutsshws.php
But you say it doesn’t.
Doonman said: “But you say it doesn’t.”
I did no such thing. What I said is that tropical cyclone classifications are not based on damage. And I standby that statement.
Hurricanes are tropical cyclones.
I know. And the fact that Hurricanes are tropical cyclones does not change the fact that tropical cyclone classifications are not based damage.
Am I out of date or are Huricane league tables ranked differently to football (soccer) leagues? In Tables 3 and 4 the ranking of Ian is higher than I would have made it. In Table 3 Ian would be the 23rd equal, there being 22 higher placed storms. In Table 4 Ian ranks 9th equal as there are 8 hurricanes higher up the ranking.
That was also my thought when looking at the rankings: Gotta include the total numbers of hurricanes above a certain event you are ranking.
Too lengthy a thesis for likely highly compromised data. You know as a fact that today when assessing metrics in climate, instead of objectivity, climateers look at a likely range of data and then choose the most extreme figures that they can get away with. They even change the procedures and technologies to give them
the spread to facilitate hedging.
Conclusions: there is no way to compare corrupted modern weather phenomena with past examples, except to subtract the available ‘hedge’, say 10% from modern. E.g. if we could correct the temperature record, we would still have the late 1930s to mid 40s as the record high since the end of Little Ice Age of 200years ago.
Ukraine is in talks with US drillers to pump gas from its vast untapped reserves to Europe and ease the region’s energy crisis by the end of the decade, The Telegraph can reveal.
Naftogaz, Ukraine’s state-owned oil and gas giant, is preparing to market its national gas reserves, the second-largest in Europe, to international drillers and is already in discussion with US firms.
https://www.telegraph.co.uk/business/2022/10/16/ukraines-vast-untapped-gas-reserves-lined-supply-energy-europe/
Ain’t going to help this winter. And will this work if the war is still underway?
The sad part of the whole thing (regardless of the nitpicking) is that our government, through NOAA and NASA, refuses to provide the whole truth to the populace. National cynicism will be the result.
Up until the last day or two before landfall, models had Ian going north into the Florida panhandle and predicted to weaken before landfall. It would have been a Cat 2 or 3. The same hurricane, just slightly different track. Even then, the media would have been saying the same canned dog food (dogma).
Weather (porn) Channel would have had their crews on the beach and relentlessly talking about climate change, citing some unique characteristic of the storm or saying what might have been. I miss the days when Weather Channel consisted of elevator music as a backdrop to static forecast tables and images with the droll weather reader speaking from time to time. Today, it is weather pornography.
Here was forecast before Ian was even a tropical storm. Note that the NHC follows the TVCN/IVCN model for track and intensity forecasts.
Salute!
Thanks for recalling that early path for Ian. Being a seasoned storm vet, the blogs had the thing shifting west to the Panhandle and then back to the east and Tampa got all the attention. Being at 86.5 W and 30.5N, I was interested…seems Michael hit here 3 years ago.
Ian would have done more damage if getting further out in the gulf, then coming in on a more easterly track.
Too many variables, but from family and personal experience, the lower MS and LA coast topography and sea floor shape makes for immense surges compared to most Florida chores. Here in the Panhandle the water is 30 or 40 feet deep within a half mile, but at Biloxi you can walk out a quarter mile in 4 or 5 feet of water. The depth we have for most of Florida and the east coast is much greater close to shore than Gulfport or Biloxi or Holly Beach. The deeper water allows the surge to spread horizontally more.
Gums sends…
Point being that it really didn’t matter. The talking heads would have called it climate change in any case.
Be as that may be the landfall location of Ian was always within the NHC’s forecast cone with the Fort Meyer’s area having a full 5 days of lead time to prepare. The NHC even forecasted Ian to be a major hurricane before Ian even formed. Forecast model skill was above average for Ian.
The most trusted name?
https://youtu.be/Z9eBOxxQw4U
(Keep your eye on the background.)
Doozie of grammar in the headline. Yes, adding warmth to the globe causes hurricanes, weather, life, waves…. but MMAGW doesn’t exist.
Why is this even a debate? I appreciate the tables, graphs and calculations but to even consider Hurricane Ian some manifestation of global warming is absurd. Off the bat, if one assumed it to be true, what caused all the other hurricanes that have hit Florida (and the East Coast in general) over the past centuries? Does global warming somehow time travel? Human CO2 production in the 16th century was pitiful and certainly not enough to alter the climate. Once again, breathless faith in the ridiculous and improbable.
Bill Nye the ??? guy. The one that couldn’t tell which way the the trade winds blew.