by Javier Vinós & Andy May
“Probably no subfield of meteorology has had as much effort devoted to it as the effects of solar variability on weather and climate. And none has had as little to show for the research labor.” Helmut E. Landsberg (1982)
For those that prefer it, Christian Freuer has translated this post into German here.
1.1 Introduction
The sun has been correctly identified as the source of climate since the dawn of human intelligence, and consequently the sun was worshipped in many ancient cultures. Large sunspots are visible with the naked eye when the sun is low on the horizon and partially obscured by dust or smoke. Several myths and iconography suggest sunspots were known to ancient cultures from America, Africa, and Asia, however, the first written mention of a sunspot comes from Theophrastus’ De Signis Tespestatum c. 325 BC. This first written record of solar variability was already linked to a climatic effect, since Theophrastus mentions it is related to rainfall. Theophrastus is considered the father of botany and was a student of Aristotle. He succeeded Aristotle as the head of the Lyceum when Aristotle, teacher of Alexander the Great, had to flee Athens due to anti-Macedonian sentiment. Theophrastus’ mention in passing of sunspots must have referred to common knowledge from the past, since he lived during the Greek grand solar minimum of 390–310 BC (Usoskin 2017) and it is very unlikely that anybody at that time could have seen a sunspot with their naked eyes. Most naked-eye sunspot observations known to us come from China, where records have been found starting from 165 BC. The oldest known drawing of actual sunspots is from the Chronicon ex chronicis by John of Worcester, dated in the manuscript to December 1128, during the Medieval grand maximum in solar activity.
Aurorae are an atmospheric light phenomenon that results from the interaction of solar wind and the geomagnetic field, usually produced between 10-20° from the geomagnetic poles. Aurora is the Roman goddess of the dawn, sibling of Sol and Luna. Every morning she would open the gates of heaven for the sun to rise and then race across the early morning sky in her chariot to announce a new day. The name aurora borealis was given to the atmospheric phenomenon by Galileo in 1619, indicating its northern (boreal) direction. Aurorae are occasionally seen in mid-latitudes and rarely in low latitudes when a geomagnetic storm temporarily enlarges the auroral oval. Aurorae have been observed since antiquity. The first records of aurora appear to be three Assyrian clay tablets c. 660 BC (Hayakawa et al. 2019). The prophet Ezekiel also recorded an aurora c. 593 BC in the Bible, and Aristotle wrote about aurorae in his treatise Meteorologica in 340 BC. However, aurorae were not associated with solar activity until the arrival of modern science. Anders Celsius was the first to propose that aurorae were linked to the Earth’s magnetic field in 1733, but the solar link had to wait until the Carrington event of 1859, when the solar flare detected by Richard Carrington and Richard Hodgson that caused a great geomagnetic perturbation was followed by the most intense and lowest latitude reaching aurora in recorded history. Aurorae historical records since antiquity are used, together with naked-eye historic sunspot records, to study past solar activity.
The invention of the telescope in 1608 was soon followed by multiple sunspot telescopic observations. The first records correspond to Thomas Harriot in 1610, and the first publication to Johannes Fabricius in 1611 (Vázquez & Vaquero 2009). Galileo Galilei and Christoph Scheiner carried out systematic sunspot observations in 1612, both realizing they were never far from the solar equator and rotated with the sun. Telescopic sunspot observations arrived just in time to register the Maunder grand solar minimum (GSM) from about 1645 to 1715. No other GSM has taken place since, as the Dalton Minimum was not a GSM (Usoskin 2017).
At least one variable star was known to the ancient Egyptians three millennia ago. There is now evidence that the Cairo Calendar, dated 1244–1163 BC, records, as lucky and unlucky days, the period of the eclipsing binary star Algol, associated with the Egyptian god Horus (Jetsu & Porceddu 2015). Algol was the second variable star described by modern astronomers in 1669. It was preceded by the discovery that Mira was pulsating with an 11-month period by Johannes Holwarda in 1638. The number of known variable stars grew slowly until c. 1850 when it accelerated, and particularly since the introduction of astrophotography in the 1880s. The 2017 General Catalog of Variable Stars (version GCVS 5.1) contains data for 52,011 variable stars. The sun is currently considered a variable star with a very slight variation of one milli-magnitude. Over 80% of sun-like stars display a variability like the sun (Connolly et al. 2021).
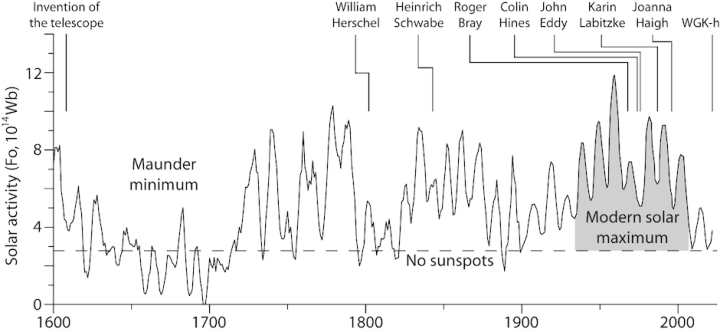
Fig. 1.1 shows solar activity since 1600 after Usoskin et al. 2021 (Fig. 8), and Wu et al. 2018 for the 20th century, in open solar flux Weber units. Some landmarks in the study of the sun-climate effect are indicated. In 1608 the telescope was invented. In 1801, Herschel developed the sunspots to climate hypothesis. In 1843, Heinrich Schwabe discovered the solar cycle. In 1968, Roger Bray discovered the 2500-year solar activity cycle associated with a 2500-year climate cycle. In 1974, Colin Hines proposes a sun-climate mechanism mediated by planetary waves. In 1976, John Eddy wrote a landmark article on the Maunder Minimum. In 1986, Karin Labitzke discovered the first solid sun-climate effect in the polar atmosphere during winters. In 1996, Joanna Haigh proposed the “top-down” sun-climate mechanism. In 2022 we propose the “Winter Gatekeeper” sun-climate mechanism hypothesis.
1.2 William Herschel, Heinrich Schwabe, and the early sun-climate frenzy
With the advent of the telescope and the interest in sunspots there came speculation that changes in sunspot number and changes in weather were related, as Theophrastus suggested in 325 BC. Italian Jesuit astronomer Giambattista Riccioli and Mexican astronomer José Antonio Alzate made the same suggestion in 1651 and 1784 respectively.
Musician, composer, mathematician, astronomer, and the best telescope builder of his time, the discoverer of Uranus and infrared radiation, William Herschel, was the first to propose that the sun was a variable star and sunspots reflected changes in solar activity that influenced climate. In an article presented in 1801 at the Royal Society he said:
“I am now much inclined to believe that … [abundant sunspots], may lead us to expect a copious emission of heat, and therefore mild seasons. And that on the contrary, … the absence of … [sunspots], will denote a spare emission of heat, may induce us to expect severe seasons”
(Herschel 1801)
It is interesting that Herschel was also the first to correctly relate more sunspots to higher solar emissions, unlike all previous observers and nearly all that followed him until the 20th century. He then proceeded to relate the price of wheat since 1650, obtained from Adam Smith’s The Wealth of Nations to early sunspot counts, finding a correspondence. Herschel’s proposed correspondence is likely incorrect. He himself warned that the criterion was probably not real since the price of commodities is also regulated by their demand, but the lack of temperature records left him with no other method. Figure 1.2 shows that grain production is a better choice, as expected. The great mortality from the 1317 famine and the Black Death from 1346 that killed one third of the European population resulted in decreased demand that kept grain prices low despite the fall in production during the Spörer Minimum from c. 1400-1500.
Herschel sun-climate proposal was met with derision. Lord Brougham scoffed and called it “a grand absurdity” and went on to say that “since the publication of Gulliver’s voyage to Laputa, nothing so ridiculous has ever been offered to the world” (Edinburgh Review 1803).
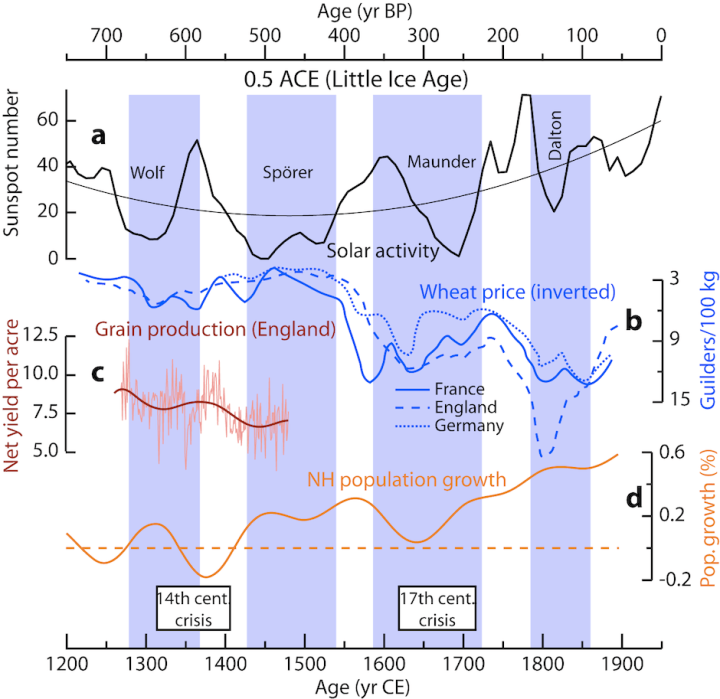
In Fig. 1.2, plotted are: a) Solar activity reconstruction that shows the Wolf, Spörer, Maunder, and Dalton solar minima. After Wu et al. (2018). The quadratic regression (thin line) follows the long-term change in solar activity. Plot b) shows the wheat price in Dutch guilders per 100 kg (inverted), for France (continuous line), England (dashed line) and Germany (dotted line). After Lamb (1995). Plot c) shows three main crops of grain net yield per acre in England, with annual data (thin line), and a long-term trend (thick line). After Campbell & Ó Gráda (2011). Plot d) shows Northern Hemisphere population growth in percent. After Zhang et al. (2011). Boxes at the bottom identify the periods considered to be the 14th and 17th century crisis by historians. Vertical bars (ACE, abrupt climate event) are periods of climate deterioration. Fig. 1.2 is after Vinós (2022).
Herschel’s detailed solar observations might have revealed the 11-yr solar cycle, except they took place during the Dalton Minimum. That discovery had to await Heinrich Schwabe who was looking for a hypothetical planet inside the orbit of Mercury, called Vulcan, proposed by many astronomers at the time. For 17 years (only one and half periods!) he made detailed solar observations trying to distinguish a transit of Vulcan among the sunspots. He published his solar observations every year, and in 1843 he reported:
“From my earlier observations, which I have reported every year in this journal, it appears that there is a certain periodicity in the appearance of sunspots and this theory seems more and more probable from the results of this year. … If one compares the number of groups with the number of days when no spots are visible, one will find that sunspots have a period of about 10 years, and that for five years of this period they appear so frequently that during that time there are very few or no days when no spots at all are visible”
(Schwabe 1843)
Schwabe’s idea attracted little attention until the inclusion of his sunspot data in Alexander von Humboldt’s 1851 monumental work Kosmos. Then four astronomers, including Rudolf Wolf, director of the Bern observatory, noticed that periodic changes in the small daily fluctuations in the geomagnetic field corresponded in period and epoch, with the sunspot cycle described by Schwabe. Rudolf Wolf then began a systematic study of solar variations giving rise to the sunspot record. Heinrich Schwabe, despite not finding Vulcan (it is in the 40 Eridani triple star system, according to Star Trek), was awarded the Gold Medal of the Royal Astronomical Society in 1857.
The discovery of the solar cycle triggered a frenzy to find 11-year periodicities in any weather record. In the 1860s only three articles were published about the sun-climate connection. The next decade they were more than a hundred (Hoyt & Schatten 1997), and in the following decades they continued to multiply. In 1958 the American Meteorological Society listed 1278 articles on solar-weather relationships in its bibliography. Most of the sun-climate studies between 1870 and 1920 agreed that there was a negative correlation between sunspots and temperatures in most locations where a good correlation could be found.
From this period the studies by Wladimir Köppen stand out. Köppen established a climate classification system still in use and made substantial contributions to several branches of science. He was one of the foremost climate scientists of his time and, with his son-in-law Alfred Wegener, lent crucial support to the Milankovitch theory. Köppen’s sun-climate studies were rigorous. His 1873 article about the eleven-year period of temperature was the most comprehensive of that time. He updated the article in 1914. He concluded that the sun does indeed cause a periodicity in the Earth’s surface temperature, not only in many locations but also on a hemispheric and global scale. At that time, the small changes in CO2 levels could not have been the cause of the climate changes detected by Köppen.
At the turn of the century the consensus was that there was no doubt that the 11 and 22-year solar cycles negatively correlated with surface temperature at most locations and even hemispherically and globally, showing a positive correlation with precipitation at low and high latitudes and a negative one at mid-latitudes. In 1903 Nordmann stated:
“The mean terrestrial temperature exhibits a period sensibly equal to that of the solar spots; the effect of spots is to diminish the mean terrestrial temperature, that is to say, the curve which represents the variations of this is parallel to the inverse curve of the frequency of solar spots.”
(Hoyt & Schatten 1997).
1.3 The solar constant and the subfield discredit
The amount of solar energy arriving to the Earth, or total solar irradiance (TSI), started to be measured with the invention of the pyrheliometer by Claude Poillet in 1837. The accuracy of the data during the 19th century was poor due to the unreliability of the early instruments and the lack of proper standardization in the early measurements. Despite these shortcomings, astrophysicists of the time noticed that variations in TSI are very small, giving birth to the concept of the solar constant. In 1878 Samuel Langley invented the bolometer and in 1890 he became director of the Smithsonian Astrophysical Observatory. With the help of Charles Abbot, who succeeded him in 1906, they set up a program to determine solar constant variations with stations located at mountain peaks in the US and Chile. Data from 1923 to 1954 showed small variations associated with the solar cycle of 0.02–0.25% and a controversial increase of 0.2% during the 31-year period. Charles Abbot was convinced of the sun-climate connection, and after the end of the program he wrote in the first issue of the now named Solar Energy Journal that: “As solar radiation and the weather appear to be affected by identical periods of variation, it is therefore likely that weather changes are produced by solar variation.” He then proceeded to compare solar forecasts for precipitation and temperature at St. Louis and Peoria with actual weather data from 1854 to 1939, as evidence of his thesis (Abbot 1957). Nevertheless, he acknowledged the difficulty of attributing significant weather changes to such small variations in the solar constant, recognizing that the general opinion was against his hypothesis.
The consensus of the time had changed from supporting the sun-climate connection at the beginning of the 20th century to rejecting it by mid-century. The change was because of a better determination of the solar constant, which at the time could still accommodate significant variability, but by something that happened around 1920. All those statistically significant correlations that the best scientists of the time, like Wladimir Köppen, had found in about seven decades of weather data (c. 1840–1910), started to fail around 1920, or even worse they inverted, something that nobody could explain. The situation became very confusing, some authors claiming positive correlation, others negative correlation, and others no correlation at all. Elaborate hypotheses were proposed, indicating a troubled paradigm, and the whole subfield fell into disrepute. By 1950 the study of sun-weather relationships was considered by many to be an undignified pursuit for a meteorologist (Hoyt & Schatten 1997), and this state was recognized by Abbot in his 1957 article.
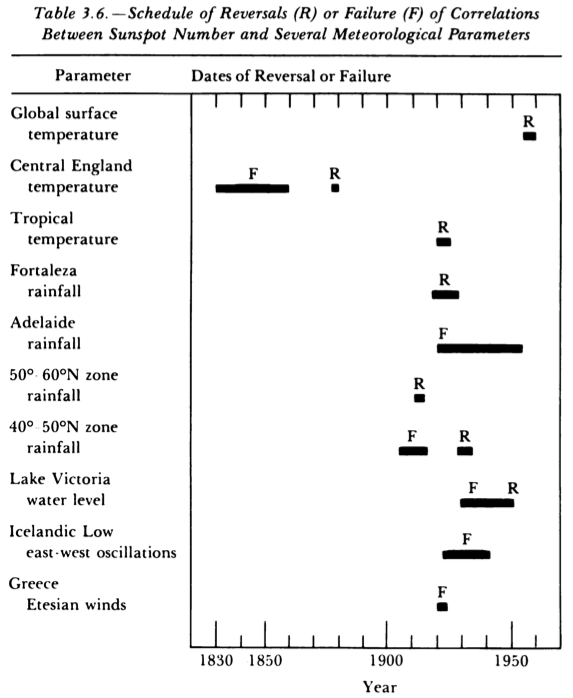
Fig. 1.3 shows the timing of the sign reversal in several sun-climate correlations clustered between 1920–30 (Fig. 1.3). The temperature correlation inverted, as well as many other meteorological variables, like precipitation, winds, the preferential location of the Icelandic low, and the strength of the Indian monsoon. Even though the sign reversals could not be explained, they still suggested a sun-climate relationship, just not one based on TSI changes, since the relationship between solar emissions and sunspot activity does not invert. This important conclusion escaped most climate researchers at the time, and it escapes many of them today. In the early 20th century, climate shifts were unknown, but it is known today that c. 1924 a regime change took place in the Pacific from a cool Pacific Decadal Oscillation to a warm one (Mantua & Hare 2002). This shift took place right after the 1923 solar minimum and resulted in global warming (the early 20th century warming), despite solar activity being below average until 1934.
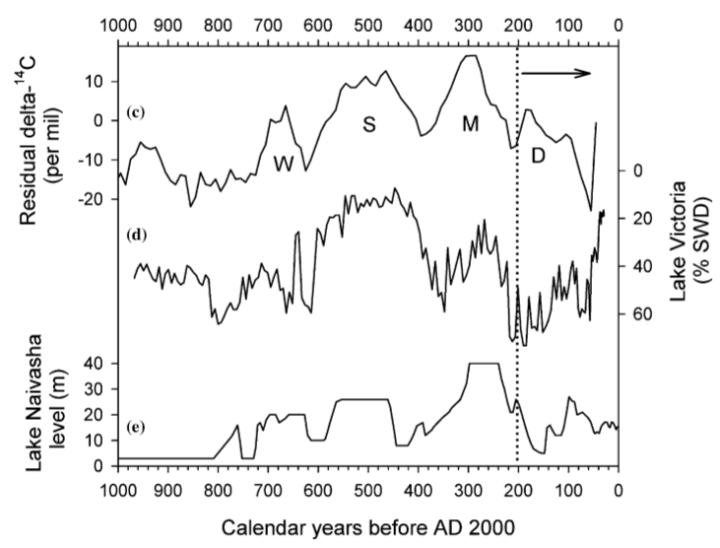
According to Hoyt and Schatten (1997) the sun-temperature correlations have changed sign several times during the past 400 years and have been negative between about 1600-1720 and 1800-1920, and positive between about 1720-1800 and 1920 and the present. The 1800 reversal is illustrated in figure 1.4.
1.4 Roger Bray, John Eddy and the 1970s revival
While the sun-climate subfield was falling into disrepute, the seeds for its renaissance were being planted. Andrew Douglass was an astronomer that had been fired by Percival Lowell in 1901 for his skepticism about the artificial nature of Martian canals. Through his entire career Douglass was convinced of the sun-climate effect, and in 1904 he noticed a correlation between tree-ring widths in Arizona, related to precipitation conditions, and sunspots. By pursuing this relationship, he developed the new subfield of dendrochronology over the following 40 years, the only precise method for dating ancient structures until the advent of radiocarbon dating. Douglass studied the annual rings of trees in relation to climate and solar activity and was the discoverer of the centennial solar cycle (which he named the triple-triple solar cycle). He did not find it in sunspot records, but in its climatic effect on sequoia ring-growth (Douglass 2019). It is the only instance of a solar cycle first identified in the paleoclimate record.
Willard Libby developed radiocarbon dating in the late 1940s. For the method to be accurate it was essential to know how the atmospheric 14C/12C ratio had changed over time. Scientists had to build a calibration curve (IntCal) from precisely dated tree rings by Douglass’ dendrochronological method, to transform radiocarbon ratios into calendar ages. Hans Suess in California and Minze Stuiver in Arizona were among those leading the effort. In 1961, Stuiver was the first to suggest that atmospheric 14C variations lasting a few centuries or less were due to solar modulation of cosmic ray 14C production in the upper atmosphere (Stuiver & Quay 1980). Suddenly the sun appeared to be more variable over long periods of time than recent solar constant measurements indicated.
This finding opened the door to using the recently reconstructed 14C changes to study solar variability and its relationship to climatic changes in the distant past. Starting in 1963, and based on his glaciological and botanical studies, Roger Bray proposed that there was a close relation between solar activity and climate during the past centuries and millennia. In 1968 he identified the solar and climate 2500-year cycle that has been recently named after him (Vinós 2016). This long solar cycle is the most important, in terms of climatic effect, during the Holocene. The most recent low in Bray’s solar cycle, during 1388–1834 (Bray 1968), coincides with the Little Ice Age (LIA) discovered by François Matthes in 1939. Roger Bray was the first to propose that the LIA had a solar cause. During the 1960s and 1970s Roger Bray published 14 articles in Nature and Science linking solar variability and volcanic activity to climate change, but since he was a botanist researching climate independently from New Zealand and removed from other sun-climate scientists, he was unjustly not credited for his findings. His cycle was given the absurd “Hallstatt” name by Paul Damon and Charles Sonnet (Damon & Sonnet 1991), despite their being aware of Bray’s work.
In 1974 Robert Currie published a study of 226 weather stations throughout the world, that in 1993 was updated using 1,200 U.S. stations. Using new statistical methods just developed, he found both a 10.5 solar and an 18.9 lunar signal in many of them but decided that local effects could mask the regional signal at some stations. Interestingly, he detected that stations east of the Rocky Mountains displayed a positive correlation between solar activity and temperature, whereas stations west of the Rocky Mountains displayed a negative one (Currie 1993), an effect not unlike the signal-reversal in correlation observed in the 1920s. In 1980 Currie detected an 11-yr sunspot cycle signal in Earth rotation. He was not the first to do so after the invention of the atomic clock, but since solar effects on Earth are so controversial (probably due to the lack of an accepted mechanism) the Sun-Earth rotation effect has been “discovered” independently multiple times, the last time in 2010, and it continues to be ignored.
However, the first viable mechanism for the sun-climate effect was suggested by Colin Hines in 1974. A year earlier Wilcox et al. (1973) discovered that the solar magnetic field sector structure affected the average area of low-pressure troughs during the winter in the Northern Hemisphere at an altitude of 300 mb (roughly 30,000 feet or 9,100 meters). Hines (1974) was skeptical of any sun-climate effect but suggested that planetary waves subjected to variable reflection in the upper atmosphere, may induce variable interference patterns in the lower atmosphere. These could constitute a possible candidate for the effect if it were real.
A widely circulated article by Joe King (1975) did much to popularize the renewed interest in sun-climate relationships by presenting a great variety of evidence and concluded that:
“the accumulated evidence is so compelling that it is no longer possible to deny the existence of strong connections between the weather and radiation changes.”
King, 1975
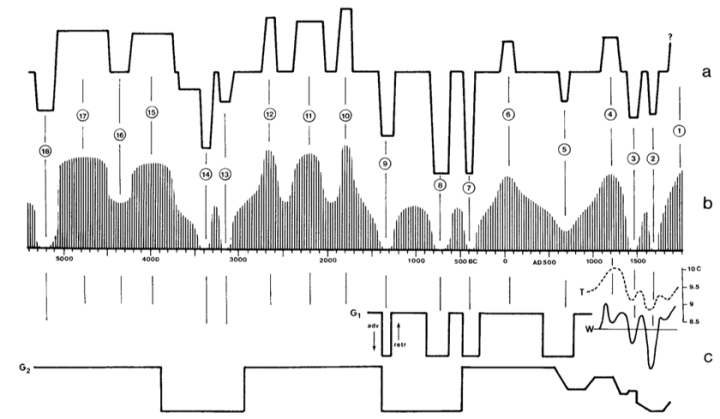
It prepared the scene for John Eddy’s landmark article in Science a year later. Eddy brought to light the forgotten finding by Gustav Spörer and Edward Maunder that during the 1645-1715 period the sun behaved in a very unusual way and displayed very few sunspots. Eddy, very interested in the history of astronomy, supported their finding with naked-eye sunspot observations, auroral observations, eclipse observations, and 14C data (Eddy 1976). The Science article on the Maunder Minimum became hugely popular. Eddy followed up with several articles on the sun-climate relationship over the past 7500 years (Fig. 1.5).
George Siscoe optimistically reviewed the 1970s golden decade of sun-climate research (Siscoe 1978), citing three major advances. Those of Wilcox and Eddy, and the studies linking drought in the North American Southwest to the 22-yr Hale solar magnetic cycle. But while the sun-climate subfield was again bursting with activity, advanced with well attended meetings, given its interdisciplinary and controversial nature, it was still criticized. Barrie Pittock published a critical look at 140 sun-climate articles (Pittock 1978) and concluded “that despite a massive literature on the subject, there is at present little or no convincing evidence of statistically significant or practically useful correlations between sunspot cycles and the weather or climate.”
1.5 1980s Global Warming and the second sun-climate demise
In the 1980s, the sun-climate renaissance of the 1960s-70s was drained of energy by improvements in solar constant measurements. Cavity radiometers were first equipped in the Earth Radiation Budget experiment onboard Nimbus 7 satellite in November 1978. The Active Cavity Radiometer Irradiance Monitor (ACRIM) experiment started with the Solar Maximum Mission in February 1980. For the first time solar constant values reached the precision of two decimal places of a percent. The decrease in the solar constant from the 1980 solar cycle maximum to the 1986 minimum was determined to be 0.15%, or 2 W/m2. But the yearly change had already been determined by 1982 to be of only 0.02%. The great majority of researchers believed that only changes in total energy could affect climate, to them a change of ± 0.07% could not produce significant effects. Those defending the idea that small solar changes could act on atmospheric instabilities that amplified their climatic effect were at odds to explain how they could do so in an inherently unstable atmosphere.
In 1980 Nastrom and Belmont appeared to have identified how the sun-climate effect worked. Using radiosonde data for 174 stations in the Northern Hemisphere for the period 1949-1973 they found that tropospheric winds displayed a clear solar signal. They found that wind speed and temperature were responding to the solar cycle, and the effect was maximal near the tropopause during winter (Nastrom & Belmont 1980). In 1983 the same authors declared their result statistically insignificant after more tests (Venne et al. 1983). Also in 1980 Minze Stuiver, the authority in radiocarbon dating that had initiated past solar activity reconstructions in 1961, published an influential article in Nature comparing the new detailed 14C variability reconstruction and several long climate records (Stuiver 1980). He concluded that low solar activity periods like the Maunder Minimum had taken place several times during the past 6,000 years and that a relationship between climatic series and the 14C derived record of solar activity for the past millennium could not be established.
Minze’s article demolished John Eddy’s work. Two years later Eddy certified the death of sun-climate studies as mainstream science:
“Spacecraft measurements have established that the total radiative output of the Sun varies at the 0.1–0.3% level. … Such changes can be expected to perturb the terrestrial surface temperature by a fraction of a degree centigrade and probable evidence of this solar-induced signal has been found. The effect, though important in terms of understanding the climate system, is too small to be significant in practical weather or climate predictions”
(Eddy et al. 1982)
As the old proverb says: “fool me once, shame on you, fool me twice, shame on me.” Sun-climate researchers had been burned twice, in the 1920s and 1980s; it should not happen again. The subfield fell into absolute disrepute. Nothing with the words “solar” and “climate” in the same phrase was to be taken seriously again. The timing was perfect for the CO2 hypothesis of climate change, as global warming started for the second time in the 20th century and this time it could be blamed solely on CO2 changes. It couldn’t be the sun and whoever suggested it faced ridicule and an insignificant career. It has reached a point where even clear solar effects on Earth’s rotation or on El Niño/Southern Oscillation are meticulously ignored.
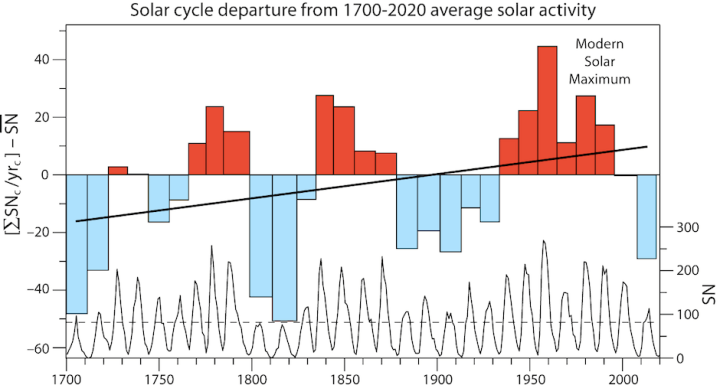
The length of each solar cycle must be taken into consideration when comparing solar activity. Top of Fig. 1.6, the sum of the sunspots for every year in the cycle is divided by the number of years in the cycle, and the 1700-2020 sunspot average is subtracted from the result. The result is displayed as a bar graph with bar width proportional to the duration of the cycle. Line is the linear regression trendline. The bottom of Fig. 1.6 is the yearly sunspot international number from WDC-SILSO. The 1934–2008 period is the 75-year period with highest solar activity in at least 700 years, as we know solar activity was very low during the LIA after c. 1270. This period is named the modern solar maximum. The close correspondence in time between the highest solar activity 75-year period and the highest global warming 75-year period (1925-2000) in 700 years is unlikely to be a coincidence and deserves a thorough investigation that is not taking place (From Vinós 2022).
The turnaround was complete for those who wished to continue their careers. Wilcox, Svalgaard, and Scherrer published in 1976 “On the reality of a sun-weather effect” (Wilcox et al. 1976). They were close to solving the problem. They were in the right part of the planet (the Northern Hemisphere extratropics), at the right location (the upper troposphere-lower stratosphere), at the right time of the year (during winter), looking at the right variable (pressure), and seeing a clear effect. That the sun-climate effect is stronger in Arctic latitudes during the winter is further confirmation of what could be deduced from the reversal of sun-weather correlations: The sun cannot affect Arctic winter climate through changes in TSI because there is no solar irradiation during the polar night, and in the Arctic, it doesn’t matter how small or large the TSI changes are for a sun that doesn’t shine. The existence of a different mechanism is required.
Colin Hines (1974) had already identified the sun-climate mechanism based on the Wilcox et al. results; it was the differential propagation and reflection of planetary waves due to changes in zonal wind speed. The same changes identified by Nastrom and Belmont and later discarded. But Wilcox et al. walked away. They forfeited their chance to find proof of a sun-climate effect in this 200-year-old climatological quest. That honor would go to a woman more interested in science than her career or reputation. Wilcox, et al. co-author Leif Svalgaard has dedicated his latest years to vigorously refuting any suggestion that solar variability may have contributed to modern global warming, and to tirelessly promoting a controversial change to the sunspot record that better supports his views.
1.6 Karin Labitzke and the unacclaimed first solid proof of a solar signal
In 1982 the National Research Council published a monograph on “Solar Variability, Weather, and Climate.” It reads like a death certificate of the subfield. It includes articles by James Holton and Barrie Pittock among others and was under the chairmanship of John Eddy. James Holton, one of the foremost experts in the atmosphere, analyzed the possible physical mechanisms for a sun-climate effect through a dynamic coupling between the stratosphere and the troposphere in a negative light (Holton 1982). When considering Hines’ (1974) mechanism, Holton conceded that changes in stratospheric flow related to solar variability might alter the reflection/absorption of planetary waves and through wave interference produce effects in the troposphere. To him, this mechanism provided a possible link between solar variability and tropospheric weather and climate, which could be significant despite the huge energy difference between the solar input and the climate response. However, he concluded that the mechanism was speculative.
Two years earlier Holton and Tan (1980) had published a seminal article showing that equatorial stratospheric winds, despite circling the Earth at high altitude above the equator, modulated global circulation. These winds are known as the Quasi-Biennial Oscillation (QBO) because they alternate between easterly and westerly direction with a quasi-periodicity of slightly over two years. The effect of the QBO on Northern Hemispheric circulation discovered by Holton and Tan was to alter the mean geopotential (pressure) at the pole during the winter via planetary waves. This finding should have raised all kind of questions about possible solar activity involvement, since it was clearly related to the Wilcox et al. findings and involved Colin Hines’ planetary wave mechanism, but at the time a solar explanation was (and still is) unacceptable to most academics. During winter, strong westerly winds circle the polar region trapping a cold-air low-pressure center, forming a strong polar vortex. The north polar vortex modulation by the QBO is so important that it received the “Holton-Tan effect” name. Interestingly, the north polar geopotential modulation by the QBO was only significant during the winter season when the mean zonal wind is westerly and vertically propagating planetary waves are present. Holton and Tan had to introduce the planetary waves condition because at certain times the correlation broke down.
Karin Labitzke (1987) noticed that the polar vortex–QBO correlation broke down sometimes during the westerly phase of the QBO, but only when solar activity was near its cyclical maximum. She decided to segregate the data on stratospheric polar temperatures according to QBO phase. The very low correlation between solar activity and polar temperatures, when all data are considered, becomes very high using the segregated data (Fig. 1.7). After 186 years Labitzke had solved the quest initiated by William Herschel in 1801. In a follow-up article with Harry van Loon (Labitzke & van Loon 1988) they extended the study on the solar effect on winter atmospheric pressure and temperature to the Northern Hemisphere troposphere. The main conclusion from this work is that the signal of the QBO in the extratropical stratosphere is strengthened in solar minima and weakened in solar maxima. That the QBO orientation flips the solar effect from one sign to its opposite is not unlike other correlation sign-reversals in the sun-climate effect, and a third indication that the effect cannot be caused just by changes in TSI.
In Peixoto and Oort’s (1992) indispensable Physics of Climate manual Labitzke and van Loon’s findings were properly appraised. After declaring it the most convincing statistical evidence of a solar-weather relationship found, they continue:
“Even at the earth’s surface, the correlations between solar activity and sea level pressure or surface temperature … are unusually high and appear to explain an important fraction of the total interannual variability in the winter circulation”
(Peixoto & Oort 1992)
However, Labitzke’s ending of the 186-year quest for a sun-climate effect, initiated by William Herschel in 1801, could not have come at a more inconvenient time. Global warming was already blamed on CO2 and the scientific dogma was completely against her finding, since all sun-climate studies had been discredited. James Holton said:
“Superficially, I can’t find anything wrong with it, but there is absolutely no physical basis, and that bothers me. These people have the highest correlation I’ve seen, but if I were a betting man, I would bet against it.”
(Kerr, 1987)
She had found a clear and indisputable effect of solar activity on climate. It could not be disputed, but it could be ignored. And it was going to be ignored as an oddity with little practical effect, and no place in modern climate understanding.
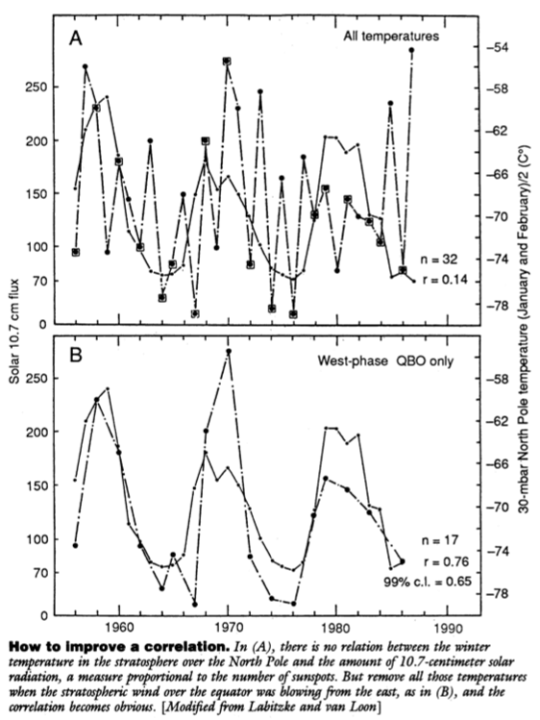
In Fig. 1.7, the following are plotted: A) Lack of correlation between winter North Pole stratosphere temperature and solar activity (10.7 cm solar flux) when data for all years are considered. B) shows a clear positive correlation when only QBO west phase years are considered. Not shown is the clear negative correlation when only QBO east phase years are considered (Fig. 1.7 is from Kerr 1987).
1.7 Aftermath
The scientific consensus about an important sun-climate effect went from being against, prior to 1850, to being in favor between 1860s–1920s, negative from the 1920s–1960s, positive again in the 1960s–1970s, and then negative since the 1980s. It only demonstrates that scientific consensus has no place in science. Scientist’s opinions are not science. Only evidence constitutes science. Even though evidence can be dismissed or ignored, it remains, waiting for the time when it will be properly appraised.
The fall in disgrace of the sun-climate subfield during the early 1980s discouraged further research into how solar variability affects climate. The strengthening of the politically supported CO2 hypothesis of climate change turned the subfield into a scientific dead zone. Only a handful of researchers decided to pay the steep reputational and career price of pursuing this research interest. The difficult sun-climate relationship research subject experienced scant progress between 1870 and 1980, considering the amount of research labor invested. Turning it into a disreputable field after 1980 has resulted in slower progress despite the rapid advances in climatology in the decades since.
Sun-climate researchers must accept not getting recognition for their findings, having more difficulties in publishing their results in good journals, not getting good students, and being lowly considered by their peers. Due to that, they have difficulties advancing their careers, and the rate of career failure among young scientists entering the subfield is high. The exception are sun-climate researchers that work under the premise that solar variability may have not significantly contributed to modern warming. Those are well-considered, highly cited, contribute to IPCC reports, and sometimes produce low solar variability inputs for climate models.
Despite these difficulties, as models attempt to reproduce real phenomena, and reanalysis is fed real climate data, the sun-climate effect keeps appearing, defying whack-a-mole attempts to keep it buried. In 1996 Joanna Haigh showed in a landmark article in Science that changes in atmospheric circulation, reproduced only weakly in models, had a clear solar origin (Haigh 1996). Tropical ozone changes appeared to be critical for the effect in the model. It soon became clear that the changes in TSI during the solar cycle did not involve enough energy to explain the observed climate effects. So, it was assumed that some sort of amplifying mechanism was responsible. Even though climate models did not include the stratosphere until recently, Haigh developed what is known as the “Top-down mechanism” for amplifying the solar effect on climate (Fig. 1.8).
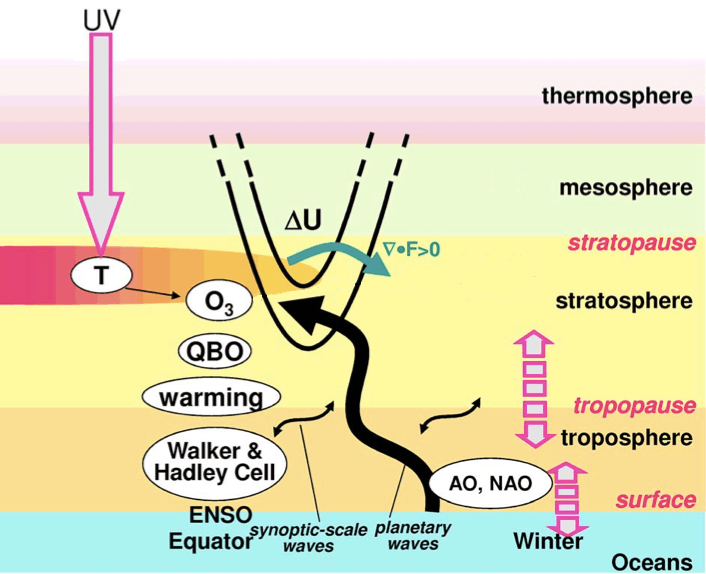
In Fig. 1.8 solar UV radiation acts on the ozone layer in the stratosphere increasing its temperature (T) and the amount of ozone (O3). The change in temperature alters the latitudinal temperature gradient, and through thermal wind balance affects the zonal-mean zonal winds (ΔU). The change in zonal winds alters the properties of the atmosphere for propagating planetary waves. The effect creates an anomalous divergence (>0) of the Eliassen-Palm flux (F) proportional to the eddy potential vorticity, changing the deposition of momentum and kinetic energy. The strength of the polar vortex (not shown) depends on those changes, driving changes in the Arctic Oscillation (AO), North Atlantic Oscillation (NAO), and the Hadley and Walker circulations. Thick interrupted arrows indicate coupling. The figure is after Gray et al. 2010.
The orthodox view of the sun-climate effect at present can be summed up in Judith Lean’s 2017 review. The 0.1% increase in total irradiance between solar minimum and maximum is associated with an increase of 0.1 °C in Earth’s global surface temperature. There are dynamic processes that alter the regional response both at the surface and in the atmosphere. The effect of a grand solar minimum, like the Maunder Minimum, is likely less than a few tenths of a °C of global cooling (Lean 2017). Over the following five parts in this series of articles we will explain the recently proposed Winter Gatekeeper hypothesis of sun-climate effect (Vinós 2022). It involves some very complex climate phenomena, which explains why it escaped discovery for 220 years. In the next part we will see that the orthodox IPCC sanctioned climate change view ignores the effects of solar variability on at least five very important climate-related phenomena that essentially refute it. It is hoped that the time has arrived for another reversal in the sun-climate consensus.
Note: This is the first of a six-part series on the effect of solar variability on climate change. Javier’s previous 13-part series on climate change was posted between 2016 and 2018 and can be read at judithcurry.com by introducing “Nature Unbound” in the search box. It generated over 4,000 comments and was the basis of his September 2022 book, Climate of the Past, Present and Future. A Scientific Debate, 2nd ed., where part of the material in this series is included.
The bibliography can be downloaded here.
A list of abbreviations used can be downloaded here.
This post was first published, in slightly modified form, on Climate Etc.
Javier, I’m pleased that you no longer require anonymity to publish your excellent climatological work, though it lie outside your biological speciality.
The scientific method rules all disciplines of natural philosophy.
A good review of a very contentious area.
I’m curious to see Leif’s comment. He can be a cranky old man sometimes. I don’t mind a well-reasoned argument that ‘sticks it to the man’.
It comes at a very appropriate moment. For their survival the political class must address the increase in energy costs which are due to their belief that CO2 is bad. This gives the politcos the opportunity to scrap their belief in the badness of CO2 and do a complete u-turn and blame it all on the scientists.
We can all dream, but the dems in the US are set to pass a new spending bill to subsidize unreliable energy and EV battery imports from China in the hundreds of billions of dollars.
At the same time China is sabre rattling? Crazy, unless you understand the Democrat party reliance on Chinese campaign donations going all the way back to Clinton and the Al Gore violations of 1996, just the tip of the iceberg in China/Democrat party collusion ongoing to today and the Big Guy and his family.
https://en.wikipedia.org/wiki/1996_United_States_campaign_finance_controversy
“ Wilcox et al. walked away”
The reason we “walked away” was simply that the effect went away as more and better atmospheric data accumulated over time. As Feynman remarked: if the data does not confirm your theory, your theory is wrong. So, again, sun-weather relations must be dismissed as so many times in the past.
Also, the revised sunspot number is not ‘controversial’.
There is no recent Grand Solar Maximum. There is a ‘Modern Solar Maximum’ in the 20th century as there were in the 18th and 19th century.
As Dewitte et al. 2022 remark::
“Recently, the Sunspot Index and Long-term Solar Observations (SILSO) Sunspot Number (SN) have been revised [20,21]. Following the latest insights, the Grand Modern Maximum does not exist, and so the 300 year increase in the TSI level from the Maunder Minimum to the Grand Modern Maximum should also be revisited. [my bold]Independently from the SN revision, from an analysis of the extended 2008–2009 solar minimum, ref. [18] came to the conclusion that the TSI increase from the Maunder Minimum to the present needs to be revised. In addition, the careful intercomparison of all available space radiometer TSI time series in [9] indicates no variation of the quiet sun TSI level over a 32 year period from 1984 to 2016 within a 95% uncertainty of ±0.17 W/m2 . The goal of this paper is to reconstruct the centennial TSI variation back to 1700 based on the available TSI space measurements and the revised SN, in agreement with the insights from [18]. This new centennial TSI reconstruction is a paradigm shift [22] compared to the long-held belief based on [12] that there was a significant increase in the TSI, and hence solar climate change forcing, from the Maunder Minimum to the present.”
[https://climate-science.press/wp-content/uploads/2022/06/00remotesensing-14-01072-v2.pdf]
And conclude:
“Since [12 Eddy], solar-climate research has been dominated by the idea that during the Maunder Minimum, the TSI was significantly lower than the current conditions, characterized by a Grand Modern Maximum [13] of solar activity, and that this lower TSI could be at least partially responsible for the lower temperatures during the so-called Little Ice Age (LIA) [48] from the 15th to the 19th century, where the temperatures in the Northern Hemisphere dropped by about 0.6 ◦C. For example, in [15], it is estimated that the TSI during the Maunder Minimum could be 3.3 W/m2 lower then its mean value from 1980 to 1986. The theory of the Grand Modern Maximum had to be abandoned after the revision of the sunspot number [20] and after the occurrence of the low solar cycle 24,”
“The main contribution of our study is that, in opposition to earlier studies based on [12], we do not find a significant increase in TSI and hence solar influence on climate change between the Maunder Minimum and the present.”
There you have it. The common assumption that solar influence on climate must act through changes in TSI when all the evidence shows that is not how it acts.
Unsupported assumptions result in unscientific conclusions. Feynman also warned of the cargo-cult science. You can build a cargo plane with sticks but it won’t fly. You can build a strawman TSI-based sun-climate effect and burn it. You won’t accomplish anything.
As it will be shown, solar UV changes affect winter atmospheric circulation, and the effect is cumulative. Sorry for the spoiler.
You missed your chance. But hey, you can still change your mind again about this, as you did in the late 70s. After all, you have been a consensus follower on this issue.
“…indicates no variation of the quiet sun TSI level over a 32 year period from 1984 to 2016 within a 95% uncertainty of ±0.17 W/m2″
Is this actually true?
But you’ll go with “no variation” rather than a closely correlated 50% increase in CO2? Good luck.
Closely correlated. Hmmmmmm.
Thanks, but luck has nothing to do in this case. We are talking science, not lottery.
What’s the r value on that so called correlation?
Lows in the solar wind speed correlate to negative NAO/AO conditions even at sunspot cycle maximum, like around 1969 and 1980. That is a sun-weather relationship, but cumulative UV is not.
As TSI and UV and all other solar stuff follow the sunspot number, if TSI [and all other solar stuff] has no long term trend then any solar effects on weather and climate will also have no long term trend. That is the point.
About me being a consensus follower you make assumptions with no base in fact. You have it backwards: consensus follows me instead [sometimes after some delay].
I have been in this field for half a century and all and any claimed sun-whatever relationships [including my own] have always faltered on the rocks of new data as time goes on.
“other solar stuff follow the sunspot number”
Drivel, look at the major lows in the solar wind at sunspot cycle maximums in 1969 and 1980.
“if TSI [and all other solar stuff] has no long term trend then any solar effects on weather and climate will also have no long term trend. That is the point.”
No that is not the point and it is false, as daily -weekly variations in the solar wind are always effecting the Northern Annular Mode.
Sure, the fashion-maker. You should be changing your tune about now then. The times they are a-changin’
Sunny is the new fashion. Gassy is going out.
The data has not improved and the correlations are getting worse [e.g. solar activity going down while temperatures are going up], so your new fashion looks like the emperor’s new clothes: “Ain’t nothing there”.
“solar activity going down while temperatures are going up”
Weaker solar wind states since 1995 have driven a warmer AMO (via negative NAO/AO) and which reduces low cloud cover. And that’s why the Arctic is normally warmer at least during each centennial solar minimum.
You could benefit from close study of https://svalgaard.leif.org/research/Climate-Change-My-View.pdf
before you make unjustified assumptions about my views on things.
I read it years ago. Very uncompromising. You have no idea why the climate is changing, just that it is not the sun. You didn’t even go as far as saying why you think the world is warming.
Your view doesn’t add anything. And the only thing you appear to be sure is the one where you are wrong.
There are many reasons for climate change acting at the same time [including a little bit due to changes in the sun’s radiative output] and I touch on all of them. Assuming, as you do, that there is only one thing [the sun and then the wrong aspect of the sun] shows your bias.
You just ignore everything which does not fit your narrative. That is a disservice to science and is the height of bias.
“The common assumption that solar influence on climate must act through changes in TSI when all the evidence shows that is not how it acts.”
All the evidence shows it is too how it acts. Let’s look at Javier’s faulty thinking.
“The sun cannot affect Arctic winter climate through changes in TSI because there is no solar irradiation during the polar night, and in the Arctic, it doesn’t matter how small or large the TSI changes are for a sun that doesn’t shine. The existence of a different mechanism is required.”
Higher TSI changed the climate during the Modern Maximum after 1935, as indicated by the integrated detrended SN and ERSSTv5, which affected polar ice.
Tropical step changes of ~1C occurred 9x in a row in sync with solar min/max, with odds of 1.9(10^11):1, in response to solar cycle TSI changes.
Arctic sea ice extent then significantly follows Nino3 (the tropics) by one year.
Javier doesn’t have a clue as to how TSI changes anything.
Bob,
I think you missed what Javier was saying:
Arctic winter climate
Of course, solar changes affect climate and weather, that is our point. But varying TSI does not directly influence the Arctic in the winter, the Sun is below the horizon for months. Varying TSI does affect meridional transport, which then affects the Arctic in winter is all he is saying.
Arctic winter climate
Involves sea ice as well, and arctic ocean temperature.
Varying TSI does affect meridional transport, which then affects the Arctic in winter is all he is saying.
“…all he is saying.” WTF?
Andy, I searched through this article and found he said nothing about meridional transport. Did you just make that up to make Javier look good? Did you tell a whopper Andy? I think so.
BTW, the correct terminology is ‘poleward transport’. I had a discussion about this with a NASA Goddard solar scientist a few months ago, and explained to him how TSI affects polar ice via this mechanism,which is a key part of my sun-climate analytical system.
He told me they don’t know what’s going, and urged me to publish.
So, Andy, why are you and Javier writing a book first instead of attempting to publish a science paper? To try to control the narrative with pejorative storytelling semantics instead of reasoned debate? Where is the abstract?
The fall in disgrace of the sun-climate subfield during the early 1980s discouraged further research into how solar variability affects climate. The strengthening of the politically supported CO2 hypothesis of climate change turned the subfield into a scientific dead zone. Only a handful of researchers decided to pay the steep reputational and career price of pursuing this research interest. The difficult sun-climate relationship research subject experienced scant progress between 1870 and 1980, considering the amount of research labor invested. Turning it into a disreputable field after 1980 has resulted in slower progress despite the rapid advances in climatology in the decades since. [my bold]
Those words were written by Javier to reframe things by stigmatizing and immortalizing the early incomplete findings of the modern instrumental era, from which the reality-inverted IPCC science originated, when insufficient early data and immature research prevented the fuller knowledge we have gained in the last decades; and to deter people now from learning the truth of TSI-driven climate change.
The field is definitely not a dead-zone, except for the IPCC etal and for people who want to be the center of attention, like the CO2 warmists, and self-promoting others with non-viable solar climate change theories.
The TSI field is the main field of sun-climate research, not just a subfield, and it is not in disrepute or disgrace now, only in some people’s minds, thanks to politics in and outside of science, and self-promoters.
Take it easy, Bob.
Andy is a co-author of the series of articles, and he is referring to what other articles will show. You are very aggressive when people disagree with you, yet disagreement is the normal state of things in science. Unlike me, Andy is a very nice person, so try to treat him with the same respect he treats you.
You have your hypothesis. That climate is controlled by TSI. Other people have other single cause hypotheses, like GHGs, solar wind, volcanic sulfate, the speed of rotation of the Earth, and so on. They all think they have the evidence to demonstrate them, like you. Obviously not two of them can be correct as these hypotheses (included yours) are mutually exclusive.
The reality is that climate is very complex, and its changes cannot be explained by a single factor. All I say is that one of those factors is solar activity, and I believe I can demonstrate it. But as there are other factors affecting climate, solar activity alone cannot explain all climate change and therefore the requests that it matches temperature changes are misguided.
We disagree and that is fine. The way Andy and I choose to publish the results of our studies is our decision alone. None of us is a climate scientist, and defending unorthodox views the academic path is very difficult. Time and the work of others will judge the value of our respective contributions, if any.
Logical deduction can demonstrate that the effects of solar wind variability dominate over the changes in irradiance. The obvious controls are the sunspot cycle maxima in 1969 and 1980 where TSI and UV are higher, but there were major lows in the solar wind. Referenced to NAO and AMO anomalies.
Leif haven’t you noticed Dewitte etal 2022 failed to incorporate Usoskin’s 2017 grand solar minimum definition in their paper, while they managed to cite 6 Usoskin papers prior to 2017?
The current 30y SN ave is 2x Usoskin’s GS Min definition, whereas Dewitte etal 2022 claimed we are currently in a GS Min. Because of this and a few other glaring errors, their paper deserves a serious rebuke.
I have no idea what you are talking about. “Grand Solar Minimum” ??
My own simple version is that solar energy, clouds. water vapor and greenhouse gases are all climate change variables Among those four variables (and others) solar energy seems least important to explain the past +1 degree C. of global warming.
While the low sunspot count during the Maunder Minimum period did coincide with cold decades, especially the 1690s, there has been no obvious solar energy – global average temperature correlation since then — not enough to account for even a 0.1 degree C. change in the global average temperature.
I also do not observe any 11 year average temperature cycle that coincides with the 11 year average sunspot cycle.
It is possible the global warming from 1975 to 2022 will never get a satisfactory explanation, along with the global cooling from 1940 to 1975, other than random variations of a complex system
Due diligence:
I personally enjoy global warming and want it to continue, based on 47 years of first hand experience with warming since 1975.
We have almost eight billion first hand witnesses with up to 47 years of experience with real global warming, and it seems people in authority could not care less about those witnesses. I can’t imagine that any people have suffered from warmer winter nights in the higher latitudes, and the greening of our planet. But many people do suffer from the irrational fear of the future
climate created by climate scaremongering. And all of us will suffer even more as Nut Zero spends a lot of our money to make our electric grids less reliable.
Richard,
We cover this in future posts.
Anything gets hotter…including the sun….all that happens is more water vapour is forced into the atmosphere at 7% per degree of sea surface temp….more clouds form in the atmosphere somewhere between the surface and the -58 C that is the Top of Troposphere….the planet’s albedo increases…and its Planck temperature goes up about half of what might be expected….to overly simplify….
Although interesting, your comment has little to do with the topic.
Hmmm…Sun-Climate effect is the topic of both….
Whenever I see sunspots I’m reminded of melanomas.
I’m reminded of cataracts. I tend not to look at the sun.
Jo Haigh got closest but then gave up.
Observations showed that the solar effect on ozone reverses above 45 km so we need to look at the mesosphere.
Air from the mesosphere descends into the stratosphere over the poles so that is where we must look.
Variations in the ozone content of that descending air affect tropopause height of the poles.
When the sun is less active it is pushed down for more jet stream meridionality and when the sun is more active it is pulled up for more zonality.
Meanwhile internal ocean cycles suppress or enhance the solar effect over periods longer than a single solar cycle so that the solar effect is disguised.
Best to just rely on jet stream behaviour.
Wavy jets more clouds less energy into the oceans for a cooling world with more La Ninas than El Ninos.
Zonal jets less clouds more energy into the oceans for a warming world with more El Ninos than La Ninas.
The current run of La Ninas is the key indicator at present and warming has stopped with net cooling since 2016.
Thanks Stephen,
We will have much more to say about ENSO and zonal wind speed and position in the remaining posts. This post is mainly about the history of research into a solar/climate connection.
An interesting collection of data on the topic of TSI versus weather/climate. When the variation in solar irradiation frequency interacts with atmospheric absorption spectra, the potential for solar irradiation influence on weather/climate gets more interesting. For example, see Yeo, et al, 2014 “Solar Cycle Variation in Solar Irradiance”, where the authors present data from satellite measurements versus 11-year solar cycles. Instead of TSI we might be better served by analyzing solar irradiance frequency variations, as they interact with atmospheric molecular absorption (which absorption is dominated by H2O). Alert: probably not a good idea to start reading the above article before your first morning cup of coffee, as I did. Just Saying.
The most obvious link through orbital mechanics is not even mentioned.
I suggest you look at month of the year trends for temperature. The trends vary significantly from month-to-month in complete contrast to what climate models predict. But the orbital changes also vary solar intensity from month-to-month. And the temperature response to sunlight is far from liniear. There are three break points, 30C, 26C and 4C.
Attached shows variation in ToA solar intensity at 51N over the past 40 years.
The CO2 hypothesis is destroyed by the observation that the Southern Ocean is cooling. And the Nino34 region has static trend.
Bingo! We agree.
The CO2 hypothesis is destroyed by that fact it totally fails to reproduce the early 20th c. warming.
It also fails to explain why arctic sea-ice volume minimum had been essentially flat since it was first measured by Cryosat2 in 2011. It’s actually slightly higher now. Where is the “run away melting” produced by global warming, polar amplification and albedo feedback ? Where is the “death spiral” ?

The CO2 hypothesis is also destroyed by repeat episodes of REVERSE CORRELATION between CO2 and temperature shown in the ice core reconstructions.
When temperatures repeatedly start RISING while CO2 is FALLING and near its LOW point, and temperatures start FALLING while CO2 is RISING and near its HIGH point, it should be clear to anyone pretending to be a “scientist” that CO2 is NOT the “driver” of temperature.
THe CO2 hypothesis is destroyed by the attachment. It is a specific heat table showing that thermodynamics says there is only one value for the energy required to raise the temperature of dry air at various levels. If IR had an effect on CO2 that caused warming there would need to be two columns. One for energy with IR and one for energy without IR.
Rick,
A plot similar to yours is in Post 3 and discussed therein, we also discuss TOA net radiation and its distribution in that post, which is only two weeks away.
Net radiation opens a can worms that is more difficult to decipher than just ToA Solar EMR based on orbital geometry. From previous comments on my note on OST response to Solar EMR, I gather Javier does not know how to calculate ToA Solar EMR from orbital changes.
I have found that temperature trends for different months of the year for northern hemisphere land temperature can range between 1.2C/century up to 4.5C/century. This is using GHCN, which is no doubt fiddled but it does highlight the changes in trend from month-to-month. All climate models have a trend of about 2.6C/century everywhere for every month of the year.
In any case I will look forward to what you have coming. Javier appears to have good understanding of solar EMR but is yet to get into actually calculating the regional and monthly variation based on orbit. It took me a few weeks to sort out the geometry to get the monthly solar EMR.
There are complexity in timing. The atmosphere takes about 25 days over ocean warm pools to respond to the surface temperature. You need to look at hemispheres separately and you will find that the southern hemisphere temperature is 180 degrees out of phase with the solar EMR. The NH is no quite 180m degrees out of phase. Land responds almost directly to solar EMR but it gets confusing when the land is affected by heat input from oceans. The amount of moisture on land varies and has a large impact on the temperature response. Places like the Sahara probably give the least confused response but I am yet to look at that in detail.
With Net EMR, you will find that globally land is always in deficit. You have to realise that land deficit can only be achieved by heat transfer from oceans; mostly through latent heat as evidenced by net ocean evaporation or land runoff to ocean. When the land heats up, the oceans also heat up because there is less latent heat transfer to land – evaporation is reduced. The maximum temperature of oceans and land both occur around July. That is when the net heat uptake of oceans is lowest; meaning less heat transfer to land. TPW will always be at its maximum in December and January because that is when the oceans get the most sunlight irrespective of the precession cycle.
I agree Rick that orbital mechanics will ultimately provide the most fruitful insights into climate trends.
The Sun sends us other things than just photons at various energies. Every so often it flares and blasts out CME’s along with the constant solar wind. When they/it hits the Earth things happen and it isn’t inconsequential. Weather systems can intensify and certainly the ionosphere changes, sometimes dramatically. And it can also even effect human health.
I have a real issue with the TSI crowd thinking it is the only thing that impacts the Earth’s weather/temperature. It obviously isn’t.
And the constant solar wind is not constant but highly variable.
And one magnetic field (Earth’s) traveling through another varying magnetic field (the Sun’s) must produce a varying energy transfer of some kind.
How do the climate consensus models account for these two variables?
Javier Vinos’ has TSI blindness, seemingly incurable at this point.
“It soon became clear that the changes in TSI during the solar cycle did not involve enough energy to explain the observed climate effects.”
The ocean does very clearly respond to TSI, which we couldn’t have known about in detail in the 1980-2000 period. The problem then was insufficient climate data to support the TSI effect, and inadequate TSI measurements, so it is no surprise they couldn’t find the signal.
That has all changed, allowing for the discovery and modelling of the TSI effect, which I did.
Detrended SORCE TSI during SC24 correlated well with mean HadSST3, enabling correct climate predictions, Fig. 13.
30y HadSST3 (climate proxy) correlates well with 109y SN @ur momisugly r=.95:
Your graphs are awful to read Bob. Could you produce proper graphs instead of Powerpoint slides ?
Integrated solar makes sense but I can’t work out from this scribble what you are doing to assess it.
“109y Sunspot Numner” ” 109ya SN” . So which is it ? Does ya mean 109y average? aka running mean ?
How about you plot the lagged graph so we can see how well they actually line up?
I did a similar analysis where I applied convolution with an exponential relaxtion function ( if a pulse of energy hits the oceans it will cause increased heat loss and it drifts back to equilbrium , energy deficiency will cause slower cooling ). With a time constant of about 5y I got a fairly good match.
https://climategrog.wordpress.com/ssn-exp60mo_hadsst3/
You don’t say what your TSI , dTSI d2TSI formular is or how you justify it physically. That opens you up to dangers of arbitrary fitting and von Neumann’s elephant.
A running mean is the crudest of convolutions with a rectangular weighting window. If you use exponentially decaying values you can have a physically meaningful processing which gets a similar result. 😉
The relaxation also introduces a lag, I did not add any lag in that plot.
Greg, those images are from Excel, not Powerpoint, as though it matters. I am working towards using other tools like python to generate plots.
You are nitpicking over “y” and “ya”. I dropped the “a” out of the title to save space, and they mean the same thing, the 109 year running average, as you suspected.
How about you plot the lagged graph so we can see how well they actually line up?
The 109y SN and 30y SST3 are plotted together in the top panel of the last image, where the lag is evident; the cross-correlation plot is included to determine the 11y lag. Or did you mean the second panel where HadSST3 was timeshifted by 11 years? If so the scatterplot doesn’t look much different before time-shifting.
I did a similar analysis…
I understand your method. I think the exp fxn isn’t necessarily necessary.
You don’t say what your TSI , dTSI d2TSI formular is or how you justify it physically.
Valid point. Maybe I shouldn’t have it there without justification, however this graphic was from an equally jam-packed AGU poster I finished at the very last minute in 2018.
The direct TSI effect involves my decadal sun-ocean warming threshold, which was determined and tested first as described in my 2018 AGU poster. The major accumulation of absorbed solar energy in the ocean proceeds when TSI>=threshold, which for SORCE TSI v17 was 1361.25W/m^2 (95SN equiv.). This was modeled in Fig13 e-g by the detrended sum of TSI>=1361.25.
As indicated earlier in my comments today the TSI effect begins in the tropics, which are the most sensitive to direct TSI changes (a subject I covered this year at the sun-climate symposium and the AGU Hydrology meetings), where the yearly TSI changes have a big effect (dTSI). The largest positive annual changes in TSI (dTSI) typically occur in the first years of a solar cycle; d2TSI then follows dTSI.
The 97/98 ENSO also followed the solar cycle onset impulse (TSI+dTSI).
How does that work ?!
There is not even a clear flip, it just drifts in and out of phase. That is pretty clear PROOF that it is not related and that there something else with a period approximately 10y but significantly different which is driving it.
Try looking at the peaks in SST, they nearer 9y than 10 or 11 of the variable solar “cycle”.
A negative correlation is a correlation nevertheless. The effect of the solar cycle on polar stratosphere temperature flips when the QBO flips. It goes from showing the lowest temperatures at the solar minimum during QBOw years to showing the highest temperatures at the solar minimum during QBOe years.
It just doesn’t work the way you think it should work.
SSTs at many regions show a strong response to the half nodal tidal period of 9 years. AMO is a good example. It shows 9 years bumps that have been studied in an article by the Richard Muller of BEST and Judith Curry.
Muller, R.A., Curry, J., Groom, D., Jacobsen, R., Perlmutter, S., Rohde, R., Rosenfeld, A., Wickham, C. and Wurtele, J., 2013. Decadal variations in the global atmospheric land temperatures. Journal of Geophysical Research: Atmospheres, 118 (11), pp.5280-5286.
Yep, agree that 9 years is an event using wavelet analysis that shows changes over time. The event is not quite stationary, but close.
https://andymaypetrophysicist.com/2018/12/16/modern-climate-wavelet-patterns/
It is noted that the short term ( decadal ) variability does not correlate with the solar cycles. Avoiding the large, speculative adjustments made to hadSST3 just after WWII and taking the last six peaks on the graph to estimate the period:
( 1996.46 – 1952.28 ) / 5.0 = 8.836 years
This is strongly suggestive of a the lunar perigee cycle of 8.85 years, caused by the precession of the line of apsides, and accounts for the often noted phase drift when decadal variability is incorrectly attributed to variations in the solar cycle.
https://climategrog.wordpress.com/ssn-exp60mo_hadsst3/
From the article: “The Active Cavity Radiometer Irradiance Monitor (ACRIM) experiment started with the Solar Maximum Mission in February 1980.”
I remember writing a letter to Astronomy magazine (which was published) promoting the idea that NASA spend a little money and keep Solar Max in orbit a little longer so its data could be correlated with the newer instruments that were going to be put in orbit.
Alas, NASA allowed Solar Max to fall out of orbit. It seemed like a big loss at the time to me.
I love this article, btw. I look forward to the rest of the series. I think you are on to something.
I’m skeptical about both these points. The idea that someone could link rarely observed sunspots to rainfall in any meaningful way at that time is absurd. Theophrastus is describing many things that are claimed to be a sign of rain. The passage in question says
https://penelope.uchicago.edu/Thayer/E/Roman/Texts/Theophrastus/De_signis*.html
There are many more signs of rainfall, some plausible, others seem less so.
I also have doubts that this is actually describing a sunspot. The word translated as “mark” here is the same as “sign”, used throughout the writing, and I suspect could mean anything. Later he talks about black and red spots, both on the sun and the moon.
So if these are meant to be sunspots, I’m wondering how they can also appear on the moon.
Regarding solar irradiance measurements:
Pyrheliometers were invented and developed in mid-1800s, but these thermophile instruments could only measure ground-level irradiance. There was no practical way to calibrated them to standard units (SI didn’t exist). Today they are calibrated against cavity radiometers (ACRs).
The ~1360 W/m^2 solar constant at the top of the atmosphere is actually just an average, the value varies by 10-12% over the course of a year due to the Earth-Sun distance of the Earth’s orbit. This variation is more than an order of magnitude greater than the small changes caused by solar cycles.
And water responds differently to solar EMR than land. And there is a net energy exchange from atmosphere over water to land, mostly via latent heat.
I am hopeful the latter articles will get into this critical insight.
Earlier today, I read an article about the sea floor volcano that recently erupted near New Zealand. The article claimed that so much water vapor was injected into the atmosphere because of that eruption, there will be a measurable decline of ozone, which will cause measurable heating in the atmosphere.
Since vast parts of the southern oceans are not under scientific observation, I wonder if undersea volcanic events are contributing to global warming without our knowledge, by heating the ocean water, or by heating the atmosphere with water vapor?
The Southern Ocean surface is cooling. The Equatorial ocean surface water has steady temperature. The northern oceans surfaces are warming. No climate model predicts these trends.
What about the Nile River levels’ correlation with aurorae per Joan Feynman et al? They are both long and reliable series.
I follow this discussion avidly but with poor understanding. It’s fascinating though foggy.
Intuitively I believe both Lief and Javier, but it has always been a reconciliation rejected upon reconsideration.
=======
Javier and Andy,
Thank you for the comprehensive historical review of solar-climate studies. This is an interesting topic for me and I’m looking forward to reading the rest of the series.
“In Fig. 1.8 solar UV radiation acts on the ozone layer in the stratosphere increasing its temperature (T) and the amount of ozone (O3).”
I just read an article (see American Institute of Physics, July 5, 2022) where an “all-season ozone hole in the lower stratosphere over the tropics” agrees well with a model of cosmic ray driven electron (CRE) reactions and get this, “strongly indicate the identical physical mechanism working for both Antarctic and tropical ozone holes.” I always suspected that the seasonal Antarctic ozone hole had a natural physical mechanism. Since 1987 the ozone hole has not cooperated well with the Montreal Protocol. NASA has recently made it more difficult to find the observational by-year maps. Seems to be a trend in data hiding by the so called experts.
Cosmic rays increase during solar minimum and there may be a modulated solar signal in the tropical ozone data (UV: higher O3 during solar max, CR: lower O3 during solar minimum).
In addition, will Dr. Kharkova’s double dynamo solar model be included in subsequent updates? I found the methods and conclusions in her 2015 paper to be ground breaking. Two dynamos moving in and out of phase, 30 year cycles? Of course my cow-orkers at NOAA were not impressed.
It’s the Sun wot done it
Looking at the first Figure or Figure 1.6, it is clear that anybody who tries to draw a straight line through cyclical data is lying. You have to draw the cyclical curve and see what the peaks and valleys are doing, DUH. And, of course, the trends are dependent on when the data starts and ends, so not has to keep an open mind and NOT LET THE TREND RULE.