By Charles Blaisdell PhD ChE
The earth’s cloud cover has long been an important puzzle in climate change. Cloud cover has many types and varies significantly from year to year. Ground records of global cloud cover over 40 years have shown a 0.41%/decade (8) decrease in cloud cover. (A 37-year European only study (16) found a 1.4%/decade decrease). In the last 20 years, Dübal and Vahrenholt CERES satellite has data (5) that confirmed the ground observations of cloud cover decrease and a correlation with earth’s net incoming energy flux, albedo, and earth’s temperature rise. Albedo is derived from the Latin word for white, a high albedo, 1.0, is totally reflective of sun light and a low albedo, 0.0, is totally absorbent, with albedo the lower the hotter. These few pieces of data beg some questions. When did cloud cover start to decrease? Is it cyclic? How much of the of the observed global warming, GW, can be attributed to cloud cover reduction? What is causing it? Will the decrease stop? And, why should I care? Let’s start with why should I care, every 1% reduction in cloud cover could account for 1.6 W/m^2 (about 0.8’C) increase in earth’s net incoming energy flux – a significant part of all the observed GW. If this decrease started a 100 years ago and the current decrease is 0.4%/decade the total decrease over that time could be 2% or 3.2 W/m^2 (estimated 1.6’C GW) – more than the observed 2.2 W/m^2 (1.1’C GW). Sumerville and Gautier (19) in 1995 summarized that if the cloudiness of the earth decrease it would have a much greater effect on GW than doubling the CO2. In 1995 no data existed that suggested the cloud cover or relative humidity was changing over time. That is no longer true.
The first suspect in what is causing the reduction in clouds cover is green house gases, GHGs. The Dübal and Vahrenholt CERES study (5) shows a strong correlation of sun’s incoming net short wave, SW, flux (albedo) and cloud cover and little correlation to reduction of out going long wave, LW, flux and no reduction of LW top of the atmosphere, TOA, LW flux (the TOA LW flux increased). The IPCC’s theory on GHG caused GW is that: in the upper atmosphere GHGs absorb LW radiation and reflect some of the heat back to earth, like a blanket, in a process called radiative forcing, RF. The RF theory does not need a change in incoming SW radiation and RF would result in a decrease in TOA LW radiation. The IPCC’s RF theory has it’s roots in the assumption that the earths albedo does not change, from the beginning of the IPCC there was no data that said that was not true. Within the last 20 years Dübal and Vahrenholt (5), Loeb et al shows (18), and Goode et al (17) have all shown the albedo does change and it is correlated to global temperature. These studies do not match the IPCC’s RF theory – no or little GHG GW is going on in the 20 years of CERES data. Mapping of cloud cover in Loeb et al shows (18), and Figure 5, location based cloud cover changes inconsistent with uniform distribution of GHGs. Another theory is needed.
The basics of cloud formation and disappearance is temperature and relative humidity, RH (not specific humidity, SH) (13), (14), and (15). Clouds form with combinations of lowering temperature and higher RH approaching the dew point; and disappear with combinations of higher temperatures and lower RH moving away from the dew point. Cold air meeting warm humid air is the most common way clouds are formed. Another example of cloud formation is air rising over a mountain range where the pressure decrease causes the temperature to decrease and RH increasing toward the dew point. Clouds can’t form or are dissipated when air moves over hot low RH deserts. In a rain forests the many leaves on the trees make hot most air which rises to where the pressure reduces the temperature to the dew point. All these examples are natural occurring weather events. Has man or nature made any change in the earth that would cause the temperature to increase and the RH to decrease that could affect cloud formation? More desert would do the job – maybe drought in Africa. Forest fires create unvegetated black land that would produce hot low RH air; but at a low percentage of the land mass of the earth (about 0.07%). To be a significant impact on cloud formation a new ( over the last 100-150 years) larger area producing hot low RH air is needed.
Since 1700-1880 man has made some small changes in land use albedo but a large change in the land area. Most of these albedo changes came along with an unintentional decrease in moisture availability due to reduced vegetation, buildings, pavement, or exposed land. Most notable are Urban Heat Islands, UHIs, increasing to about 3% of the earth’s land mass for all cities. Go to any city at (1), see Figure 1, and you can find the daytime data for temperature vs RH, in the morning the RH is high and as the day progress the temperature rises and the RH drops sometimes to 40% RH or lower, this is a normal psychrometric thermodynamic process, see (10), for an interactive psychometric chart (and Figure 2 for a picture of a psychrometric chart, these charts are used to solve the complicated thermodynamics of air/water mixtures). These cities can have a daily temperature rise of up to 8’C higher than their rural counterpart. A large part of this temperature rise is due to the sensible heat psychometric rise (no water added just heat) in temperature while the RH drops, shown as “theory” in Figure 2. Most UHIs follow the “theory” slope indicating no or little water is added to the air in a UHI. The heat driving this temperature rise is the heat from the sun and the albedo of the UHI. Most UHIs have low albedos (about 0.05) vs the virgin land they replaced (about 0.15). While this albedo difference (0.10) has a low significance in GW (about 0.16 W/m^2) the UHI’s albedo drives the production of low RH hot air. The virgin land produced cooler higher RH air. This is a big change from cloud cover point of view.
There is one more source of low RH hot air. Globally the change since 1880 from virgin land to crop/pasture was about 6% of the earths land mass with a slightly higher (cooler) change in albedo (3); but, with unexpected lower moisture and hotter air than the virgin land. The most notable of these changes was the deforestation of the Amazonian rain forest to make crop and pasture land (4). Costa et al (4) showed that despite an increase in albedo from rain forest to crop/pasture the temperature increase, the RH deceased, the cloud cover decreased, and the rain decreased. This is a classic example of psychometric temperature and RH behavior. Combining the UHI and crop/pasture land changes we get 9% of the earth’s land mass producing more hot low RH air than 1700-1880.
With two source of hot low RH air where does it go and what does it have to do with clouds? To show examples of UHI and crop/pasture land changes that change RH, temperature, dew point and cloud ceiling we will use the data in Table 1 for 5 cases, data from (10). To keep the cases comparable, all cases start with the same conditions, Case 1. A base Case 2, simulation of a rain forest, heat (sun) input of 8.0 kJ/kg(da) difference (end-start), typical of average UHIs. Water addition of 2g/kg(da) is a typical rain forest SH increase. Case 3 show what happens with no water added from evaporation or plant transpiration in Amazonia (like a UHI with rain forest albedo in Amazonia). Case 4 simulates a UHI with lower albedo (more heat) and no water from evaporation or plant transpiration, typical of most big cities. Case 5 simulated cropland with higher albedo (less heat) and no water addition typical of what happened in Amazonia.
Table 1, Psychrometric Chart Cases to Simulate Range of CRGW Cases.
| T.Dry.Bulb | Spec, Humidity SH | Rel.Humid RH | T.Dew | enthalpy difference (albedo) | cloud celling | ||
| simulation | °C | g/kg(d.a) | % | °C | kJ/kg(d.a) | m | |
| Case 1 | start of day condition for all cases | 25.0 | 16.1 | 80.3 | 21.4 | na | na |
| calculated end of day conditions | |||||||
| Case 2 | Rain Forest (water needed to simulate trees and wet conditions) | 27.9 | 18.1 | 75.5 | 23.2 | 8.0 | 561 |
| Case 3 | Base Case no water (sensiable heat rise only) UHI with same albedo as case 2 | 32.6 | 16.1 | 52.1 | 21.4 | 8.0 | 1318 |
| Case 4 | UHI with lower albedo | 34.4 | 16.1 | 46.8 | 21.4 | 9.7 | 1543 |
| Case 5 | crop/pasture land with higher albedo | 31.3 | 16.1 | 55.8 | 21.4 | 6.4 | 1171 |
variable changed: bold
input variable: green
calculated results: blue
The air above the UHI or crop/pasture land is hot and dryer and it rises all day long, creating a plume of rising hot low humidity air. That plume of air moves with the prevailing winds usually to the east in a circling pattern due to the Coriolis effect. The picture from (6), Figure 4, shows the extent of the UHI plume from Chicago, Il. This is a computer model tuned with real data and calculates the extent of the plume to be 2 to 4 time the area of the UHI. The model also predicts the shape of the plume, rising to where low clouds could be, and bypassing mixing with the lower atmosphere like a hot air balloon. Using 3 times as the average extent of the plume we now get 27% of the land mass (7.8% of the earth) possibly being affected by plumes like the one in Figure 4, with properties between Case 4 and 5 in Table 1. Most likely only a small part of this hot low RH air prevents or destroys cloud cover; but, a small part is all that is needed. Windy or stormy days would destroy this plume and greatly reduce its cloud prevention potential.
Burch (11) has a correlation used by airplane pilots to predict cloud ceiling.
Cloud ceiling (m) = (ground temp.’C – ground dew point %)*119
This correlation is added to Table 1 cases to show that the man-made changes to land can make significant change in cloud ceiling. This is a correlation using real ground data and cloud ceiling observations and suggest that the hot/dry air from case 3, 4 and 5 in Table 1 do rise to high altitudes as predicted in the (6) model, Figure 4.
Cloud ceiling increase is not cloud cover decrease and is not specific to UHIs or cropland; but it should be related to cloud prevention. It has long been recognized that cloud cover and RH are positively related – increased RH is correlated to increased cloud cover (vis/vis), (13), (14), and (15). Since there are many types of clouds and elevations, predicting cloud cover probably requires multiple variables to model. Attempts at Global Circulation Models, GCM for cloud effect have been going on for a long time, and 1995 summary of GCMs for the IPCC is contained in Sumerville and Gautier (19), where the difficulty of modeling clouds is summarized. Currently no GCM has made a good model of cloud cover; but all model attempts agree that RH is the key variable, lower RH = less clouds especially low-level clouds. Walcek at page 23 and page 24 in Sumerville and Gautier (19), (page 23), shows a graph of many sources of ground observation on cloud cover vs RH, the graph show a wide range of data with an exponential decline. This observation by Walcek (19) is summarized in Figure 1. When the plume of hot low RH air in Figure 4 is 80%RH – 60%RH it has less cloud formation ability (7) and (Figure 1); and, below 60% RH very few clouds form. Ground observation data (8) shows a 0.41%/decade decrease in clouds over 40 years. Figure 9 in (5) shows about 0.57%/decade decrease. European 37 years of data (16) shows 1.4%/decade.
UHI plumes can also affect approaching thunder storms (20), the hot rising air is displaced by lower cooler air associated with the thunder storm and moves the storm toward the UHI over the UHI the storm can mix with the hot air and break into smaller cells, but the storm reforms after passing the UHI. UHIs and storms are a studied variable in the IPCC reports, but not given any significance. The low RH hot air from UHI or cropland in non storm or cloudy conditions is not studied in the IPCC reports.
Global maps of study variables in Loeb et al (18) show that the changes in heat flux (W/m^2) are not evenly distributed for all variables. Cloud cover and humidity stand out (18) as localized changes over the 20 years of study. The cloud cover change in heat flux is most noted downwind of UHI areas and the humidity increase in heat flux is located in the converted Amazonia crop land. One other noted area of cloud change is the dark change in the Pacific Ocean which is the known Pacific Decadal Oscillation (PDO) temperature oscillation. The PDO is an oscillation not an increase with each oscillation and shows the good sensitivity of the analysis of the CERES data.
This coming and going of clouds is a normal event in the earths weather. A 0.4%/decade cloud change or 1.5 more days of clear sky per decade in enough to account for the albedo change in Dübal and Vahrenholt , (5), CERES data.
We now have a new theory: cloud reduction global warming, CRGW: Man’s changes to land use causes the production of low relative humidity hot air rising to where clouds could be prevented (or destroyed) thus reducing the albedo of the earth
In other words: man’s growing changes to land use (rain forest to farm land, and city area expansion) have reduced the cloud producing moisture that used to naturally rise from the virgin land.
Looking for data signatures of CRGW: temperature rising and RH decreasing. See Figure 3, (2), temperature anomalies, SH, and RH all plotted together vs time, we see they are all correlated (Temp and SH positively, and Temp and RH negatively). If CRGW were not occurring on a global basis the SH would be increasing to be in equilibrium with the temperature and the RH would be flat, GRGW theory causes temperature and RH to diverge.
An 1870 to 2015 (145 years) record of RH in Moscow (12) show a steady decrease in RH over time at 0.58%RH/decade, Moscow may not be representative of all the earth’s UHI’s but it shows that the CRGW theory has been occurring for a long time. The decrease in RH and constant SH over time is the signature of a change in a UHI heating without adding water vapor to the heated area.
In the Dübal and Vahrenholt , (5), CERES study the earth’s energy imbalance, EEI, is missing about 0.77W/m^2 of energy. This energy most likely went into the ocean to be released latter (over about 80 years). If the CRGW theory is correct man’s population will increase as well as the land’s producing low RH hot air which leads to cloud reduction. Adding the energy stored in the ocean to new cloud cover reductions the CRGW theory can easily get to the temperature rise predictions of IPCC’s RF theory without GHGs.
The reduce cloud cover exposes more land and ocean to the sun. The effect on GW can now be calculated; or should Anthropical Global Warming, AGW be used since CRGW is man made. The targets of the exposed land and ocean are located in the middle 75% of the earth where the cloud cover is about 50% vs about 60% for the whole earth, (also assuming albedo of clouds is 50%). The sun’s flux to this exposed area is the cloud free flux of 342 W/m^2 (1367/4). Dübal and Vahrenholt (5) suggest this energy is split 85% over ocean (0.05 albedo) and remainder over land (0.15 albedo). Using Eastman’s et al (8)’s cloud cover (0.41%/decade) for 2 decades of CERES data we get and albedo flux change of 1.3W/m^2, the same as observed by Dübal and Vahrenholt (5), see table 2. The CRGW theory is plausible. Expanding these assumptions in the CRGW theory to 2.0% cloud cover reduction over 100years will give 3.2W/m^2. More than the IPCC’s estimated 2.2 W/m^2 (1.1’C GW) albedo change since 1880. Some of the excess energy will be stored in the ocean for later release.

Table 2

Figure 1 from (1) data

Figure 2 (10) example

Figure 3 from (2)

Figure 4 from (6)

Figure 5 from (18) “Attribution of Clouds and the Earth’s Radiant Energy System net top-of-atmosphere flux trends for 2002/09–2020/03. Shown are trends due to changes in (a) clouds, (b) surface, (c) temperature, (d) combined contributions from trace gases and solar irradiance (labeled as “Other”), (e) water vapor, and (f) aerosols. Positive trends correspond to heat gain and negative to loss. Stippled areas fall outside the 5%–95% confidence interval. Numbers in parentheses correspond to global trends and 5%–95% confidence intervals in W m−2 decade−1.”
Bibliography
- “Timeanddate” web link: timeanddate.com
- “Trends in continental temperature and humidity directly linked to ocean warming” by Michael P. Byrne and Paul A. O’Gorman web link: Trends in continental temperature and humidity directly linked to ocean warming | PNAS
- “Global albedo change and radiative cooling from anthropogenic land cover change, 1700 to 2005 based on MODIS, land use harmonization, radiative kernels, and reanalysis” by Bardan Ghimire,Christopher A. Williams,Jeffrey Masek,Feng Gao,Zhuosen Wang,Crystal Schaaf,Tao Web link: Global albedo change and radiative cooling from anthropogenic land cover change, 1700 to 2005 based on MODIS, land use harmonization, radiative kernels, and reanalysis – Ghimire – 2014 – Geophysical Research Letters – Wiley Online Library
- Climate change in Amazonia caused by soybean cropland expansion, as compared to caused by pastureland expansion by: Marcos H. Costa,Silvia N. M. Yanagi,Paulo J. O. P. Souza,Aristides Ribeiro,Edson J. P. Rocha First published: 10 April 2007 https://doi.org/10.1029/2007GL029271 Web link: agupubs.onlinelibrary.wiley.com/doi/full/10.1029/2007GL02927
- “Radiative Energy Flux Variation from 2001–2020” by Hans-Rolf Dübal 1,* and Fritz Vahrenholt 2ORCID web link: Atmosphere | Free Full-Text | Radiative Energy Flux Variation from 2001–2020 | HTML (mdpi.com)
- “Downwind footprint of an urban heat island on air and lake temperatures” by Ann Cosgrove & Max Berkelhammer web link Downwind footprint of an urban heat island on air and lake temperatures | npj Climate and Atmospheric Science (nature.com)
- Cloud Cover and Its Relationship to Relative Humidity during a Springtime Midlatitude Cyclone by Chris J. Walcek1 web link: Cloud Cover and Its Relationship to Relative Humidity during a Springtime Midlatitude Cyclone in: Monthly Weather Review Volume 122 Issue 6 (1994) (ametsoc.org)
- “Climatic Atlas of Clouds Over Land and Ocean” by Ryan Eastman, Stephen G. Warren, and Carole J. Hahn web link: Climatic Atlas of Clouds Over Land and Ocean (uw.edu)
- “Temporal–Spatial Patterns of Relative Humidity and the Urban Dryness Island Effect in Beijing City” by Ping Yang, Guoyu Ren, and Wei Hou web link: Temporal–Spatial Patterns of Relative Humidity and the Urban Dryness Island Effect in Beijing City in: Journal of Applied Meteorology and Climatology Volume 56 Issue 8 (2017) (ametsoc.org)
- “Free Online Interactive Psychrometric Chart” by Free Online Interactive Psychrometric Chart web link: Free Online Interactive Psychrometric Chart (flycarpet.net)
- “Relative Humidity and Dew Point as a Function of Altitude — A Way to Estimate Cloud Ceilings” by David Burch Navigation Blog web link: David Burch Navigation Blog: Relative Humidity and Dew Point as a Function of Altitude — A Way to Estimate Cloud Ceilings
- “Urban Heat Island and Urban Dry Island in Moscow and Their Centennial Changes” by Mikhail A. Lokoshchenko web link; Urban Heat Island and Urban Dry Island in Moscow and Their Centennial Changes in: Journal of Applied Meteorology and Climatology Volume 56 Issue 10 (2017) (ametsoc.org)
- “Cloud Cover and Its Relationship to Relative Humidity during a Springtime Midlatitude Cyclone” by Chris J. Walcek1 web link Cloud Cover and Its Relationship to Relative Humidity during a Springtime Midlatitude Cyclone in: Monthly Weather Review Volume 122 Issue 6 (1994) (ametsoc.org)
- “Clouds and relative humidity in climate models; or what really regulates cloud cover?” by Walcek, C. web link Clouds and relative humidity in climate models; or what really regulates cloud cover? (Technical Report) | OSTI.GOV
- “The Relationship between Cloud Cover to Temperature and Humidity” by Llyn L. Escarcha And Ashanti F. Pangue web link 5c1db298-1dd3-4fb1-8e40-daa3464dbcaa (globe.gov)
- “Clouds and sunshine duration” by Climate Change Service web link Clouds and sunshine duration | Copernicus
- “Earth’s Albedo 1998–2017 as Measured From Earthshine” by P. R. Goode,E. Pallé,A. Shoumko,S. Shoumko,P. Montañes-Rodriguez,S. E. Koonin First published: 29 August 2021 https://doi.org/10.1029/2021GL094888 web link: Earth’s Albedo 1998–2017 as Measured From Earthshine – Goode – 2021 – Geophysical Research Letters – Wiley Online Library
- “Satellite and Ocean Data Reveal Marked Increase in Earth’s Heating Rate” by Norman G. Loeb,Gregory C. Johnson,Tyler J. Thorsen,John M. Lyman,Fred G. Rose,Seiji Kato web link Satellite and Ocean Data Reveal Marked Increase in Earth’s Heating Rate – Loeb – 2021 – Geophysical Research Letters – Wiley Online Library
- “Elements of Change, Climate-Radiation Feedbacks: Current state of the science. “ by Richard C. J. Sumerville et al web link https://www.osti.gov/servlets/purl/232611/ Page 23 and 24 for Chris Walcek paper
- “Urban-induced thunderstorm modification in the Southeast United States” by Walker S. Ashley & Mace L. Bentley & J. Anthony Stallins web link Ashley et al. 2012 CC.pdf (niu.edu)
Lots to unpack here, but the first read is WOW! Common sense analysis, fits with my experience in large cities with uncontrolled construction. Buildings built 50 years ago no longer have the cooling capacity to accommodate the increased summer temperatures. And the local democratic governments now claim existing bldgs can’t increase their cooling capacity to handle the changes due to increased CO2 emissions. They limit the OSA design temps to ASHRAE tables. One city’s design temp is 83 for summer, when it experienced 108 last summer. (Summer temps are ~5 degrees higher on average due to UHI.) Bldg management only has 2 options: tell the tenants to stay home because they can’t meet the lease requirements for thermal comfort, or close the HVAC outside air dampers to reduce the cooling load. The latter results in a situation with substandard Indoor Air Quality (IAQ).
Has any city ever limited construction growth due to UHI and its negative impact on the existing buildings?
I realize I went a little astray here, but the climate screamers drive me crazy.
so climate change is clearly impacting urban areas and use of offices…
Or is clearly impacting your brain.
We just had a blizzard in North Dakota…in April. Unprecedented? Nope, but this has been a long winter. I want your global warming Griff. Bring it.
If I had known that it was going to get down to 13F yesterday at my house in Colorado, I would not have turned on my sprinkler system last week when it had appeared that spring was arriving.
Record cold lows for the date (going back to the late 1800’s) were set. Of course this is just weather, which doesn’t fit the narrative.
Fortunately, it appears that I only need to repair a solder weld of one joint at the vacuum pressure breaker.
That sux. Sorry dude.
No worries. Lesson learned and the fresh mountain powder made up for it.
https://www.allaboutenergy.net/216-environment/man-made-global-warming-organizations-discussing-all-positions/europe/2764-reasons-for-increase-in-global-mean-temperature-and-climate-change
5″ of wet snow here in the US central Appalachians. One of the latest significant snows here since records began (1928 was the latest significant snow — late April).
Try reading the article.
It explains things quite well.
Not really. I experience a 10 to 20 degree temp fluctuation everyday.
Why should I care about a relatively small 2 or 3 F change?
And over the seasons that range is 50 to 70 degrees.
Humans adapt. Plants and animals adapt. Even land and waters adapt.
Only stupid humans who think it is their right to live in an area that has become dangerous by stealing Other People’s Money through taxation are not adapting.
Mother Nature will take care of those humans through the process of elimination.
I see the griffter is at it again – all bark, no bite.
More like all hat and boots.
and the BS is INSIDE the boots, not on the outside.
All mouth no brain
Oh noes! It’s worse than we thought! We’re all gonna die!!!
UHI begets GW
No, urban areas are impacting climate. As usual, you have it totally backwards.
Brits would be amazed by all the asphalt parking lots in American cities. Until they go up high in a building there, they just can’t comprehend it.
The clouds have all moved to Ohio. The death metal skies make me want to off myself.
Pittsburgh, Cleveland, Seattle and Erie (PA) are the cloudiest cities in the US, in that order.
No Griff, urban areas affect the local micro-climate is the proper description.
It’s not the air that heats the surface … it is the surface that heats the air. The fallacy of the warmunists is the opposite – that the sun heats the air more due to the composition of the air mass (i.e. a miniscule change in the miniscule fraction of the air that is carbon dioxide) … whereas clearly is the surface of the earth – its oceans, lands, vegetation, and man-made infrastructure – that heats the atmosphere.
All because of specific heat, and not albedo. This is Engineering 201 stuff that evidently far surpasses the comprehension of any warmunists, PhDs and computer models notwithstanding.
Dune – specifically it is the reduction in equatorial cloud mass, predominantly near the equator ensures the ocean surface absorbs more solar energy (+400TWS), producing a warming effect, which inturn is transported poleward and dissipated into the atmosphere.
thanks for keeping it light! LOL
Urban areas are clearly impacting climate, and that alone can be shown to cause all the warming we’ve seen, regardless of CO2 emissions . Makes sense.
NO. The degradation of the weather system which promoted the expansion of the Sahara Desert over the last century, ensured a corresponding reduction in the equatorial cloud mass, resulting in the increase in the planet’s solar budget (+400TW). See here [https://www.allaboutenergy.net/216-environment/man-made-global-warming-organizations-discussing-all-positions/europe/2764-reasons-for-increase-in-global-mean-temperature-and-climate-change]
Typical idiotic falsehood by giffie.
Brad’s comment never mentions climate change.
Brad definitively includes “Summer temps are ~5 degrees higher on average due to UHI.”, which is not climate change.
Climate change impacts all areas. Climate changes and no parts of Earth escape. People use offices, homes, and a large variety of other structures to protect themselves from climate change. What is the relevance of this observation? – zero. No one is suggesting climate doesn’t change, but that seems to be the only point you wish to debate.
Griff is clearly a Masochist and comes here because he/she/it likes abuse. Let’s stop giving it out so freely.
Move on, Griff, No More Love for You! Tough or otherwise.
The author is actually wrong to claim that reduced albedo is responsible for the urban heat island effect. The actual cause of UHI is the reduced specific heat capacity of most materials used in construction as compared to natural surface materials, including water and green vegetation. I detail the numbers elsewhere in my comments in this thread. Same reason that deserts and exposed rock get much hotter in daytime, and get much colder at night, as compared to heavily vegetated areas.
Is there any effect of imported energy to cities? All the giga Watts imported via electricity and gas must go somewhere. And that energy is much more than one or two Watts per square meter.
My thoughts exactly………..
And mine too. Any MSA (Metropolitain Stastical Area) over a million population will have hundreds of thousands of cars on the road at rush hour. Two thirds of the fuel burned by these vehicles goes into the air as heat Then there is the heat pumped out of buildings as from air conditioning. Imported energy is an important source.
see here: https://www.allaboutenergy.net/216-environment/man-made-global-warming-organizations-discussing-all-positions/europe/2764-reasons-for-increase-in-global-mean-temperature-and-climate-change
There is certainly an effect of energy use, primarily from space heating, though the heat generated by power plants these days isn’t what it used to be as the plants are typically located in rural areas not cities.
By far the controlling process that results in urban heat island effect is as I described – the replacement of relatively high specific heat content natural vegetation with low specific heat content construction materials in densely developed urban and suburban areas.
It doesn’t take a scientist to figure it out – just go stand out in an asphalt parking lot or on a wide city avenue on a hot sunshiny day, and you can literally feel the high temperature as compared to standing on a grassy lawn.
You not totally wrong but water vapor contains latent (unmeasurable) heat. Lack of H2O is why deserts heat and cool quickly.
Lack of rainfall results in little to no vegetation, and that is what results in the low specific heat capacity of desert surfaces. And that is precisely why deserts heat and cool quickly, and heavily vegetated surfaces, and around large water bodies, do not.
You’re confusing cause and effect. Dry air contains very little moisture that can be vaporized to begin with. So latent heat of vaporization is not responsible for the wild diurnal temperature swings .. rather, the dry air causes little to no vegetation to grow, and the resulting surface (bare soil, or rocks) has a far lower specific heat content than a vegetated surface.
Dry air results when an air mass either initiates inland, making it a “continental air mass”, or when it initiates from a formerly maritime air mass that gives up much of its moisture due to adiabatic cooling as the air mass moves over elevated terrain (mountains). Dry air can exist in areas that aren’t necessarily deserts, even if such areas are drier than in coastal areas (i.e, the Great Plains are drier than the Pacific Coast, but are not deserts as we think of them in places like Nevada, Arizona, and New Mexico, which are dry because of adiabatic cooling, and thus have little to no vegetation). The Great Plains do not experience the same degree of diurnal temperature variations as experienced in the deserts of the American southwest, despite having relatively dry air, because they are still largely covered with vegetation – mainly native grasses, or crops like wheat and corn, with a relatively high specific heat content.
It’s all relative, on a continuous scale, not an on off switch.
Deserts are dry because they are located in areas where Hadley cells return very dry air from the upper troposphere to the surface. They cool rapidly at night partly because of the lack of water vapor, which is a greenhouse gas, and partly due to the low specific heat of sand.
You mean the Hadley cells that are 100% visible in textbooks but 2% in satellite pics if you have a good imagination….
https://epic.gsfc.nasa.gov/
Concurrently: the duopoly of a corresponding paucity of cloud cover ensures excessive drying out of the surface, with the lack of vegetation preventing the soil to act as an underground reservoir for what rain might have fallen. Addressing this latter aspect has proven a massive boon to agricultural projects in areas which had seemed to be previously untenable.
I thought the author claimed the opposite. That UHI is responsible for less cloud, which reduces the albedo, which warms the earth.
A small reducing in cloud cover can have a much bigger effect on warming than UHI.
No argument. The CRGW theory is looking at the air coming from the surface no matter what its albedo or its heat capacity is. The emphasis is hot low RH air and its cloud prevention capabilities.
My reading of the study is, land use change including deforestation to farm land, growth of cities, affects relative humidity over time. From the POV of a city the UHI can have a significant impact on cloud formation, by creating a heat plume. Likewise, deforestation reduces moisture expiration, leading to less cloud. In both cases, the reduction in clouds reduces albedo, thus allowing more sunlight energy to reach ground amd ocean. albedo reduction results from increased UHI.
That would have to include RHI – rural heat island effect too. Remember some studies by Pielke Snr et al?
Excellent point Duane…
Thanks for reading the post. The emphasis of CRGW is the combo of hot air and low RH that UHI’s have today, and the virgin land had the opposite cooler air and higher RH. The virgin land’s air promoted clouds the new UHI air does not promote clouds. The missing water in the UHIs is from pavement, roof tops, and few trees. The virgin land had lots of trees (or other vegetation) for transpiration of water and the rain soaked into the ground
See here.
Clouds associated with deep convection are the most significant from surface energy reduction perspective. These clouds limit ocean surface temperature to 30C over an annual average.
Deep convection will always respond to ocean surface temperature to limit heat input. No atmospheric changes short of gross increase in atmosphere mass will alter the surface temperature limit of 30C in open ocean water.
Desertification of tropical lands is a potential risk. Australia experienced interesting conditions this year when atmospheric moisture often exceeded the 45mm precipitable water needed for cyclic deep convection. It made most of Australia a convergence zone and sucked in massive amounts of mid-level moisture. It has probably caused a measurable reduction in ocean height as occurred in 2011.
https://earth.nullschool.net/#2022/01/18/2000Z/wind/surface/level/overlay=total_precipitable_water/orthographic=-228.78,-21.97,1112/loc=135.892,-22.623
Inland Australia is more typically a divergent zone and consequently very dry; unable to support deep convection. Same day of the year but in 2021:
https://earth.nullschool.net/#2021/01/18/2000Z/wind/surface/level/overlay=total_precipitable_water/orthographic=-228.78,-21.97,1112/loc=135.892,-22.623
It is crucial that tropical land area like the Amazon retain atmospheric moisture. Deep convection requires at least 45mm of precipitable water and deep convection over land will pull mid level moisture from adjacent oceans. So it becomes a virtuous cycle. Or, in reverse, leads to desertification.
Good comments, but the NASA report saying the earth has undergone 10% “greening” during their satellite measuring history, argues against desertification. I’m wondering about how much of the Amazon Basin has been destroyed (converted?), because when you fly over it you don’t see any disturbance for a half-hour at a time (at 500 mph that is 250 miles without disturbance). When you look at Google Earth ™ you can find very large areas that appear to be undisturbed. Good to get data and comments into play in the search for Reality.
As I see it, there are 4 possible causes of greening:
Plants love warmth, water, CO2 and sun. Some combination of all 4 is likely. Much of the greening is in previously arid regions – or maybe – that’s where most of it is noticed? In arid regions the crucial factors will be more CO2 and precipitation. Sub-Sahara, for example, already has all the sun and warmth it needs.
Mark, I’ll go along with all 4 points. However, the “greening” reported by NASA is due to the green chlorophyll having a reflectance peak in the near InfraRed, so the satellite sensors see it anywhere.
Greening is good but is not sufficient to ensure atmospheric moisture will reach the 45mm water column needed to support cyclic deep convection.
Increasing atmospheric CO2 allows plants to survive with less water. So the greening is likely just the result of more CO2. CO2 change over the past 70 years, in terms of plant survival, is already significant.
Australian inland atmospheric conditions changed this year as it appears to do whenever there is a prolonged La Nina. All major flood events in Australia align with double dip La Ninas where the Nino34 temperature anomaly has been negative for more than a year.
I have not looked at atmospheric water variation from year-to-year over the Amazon forrest but it is something to analyse.
A lot of that greening has taken place where the arctic ice has been reduced. Also the term greening, specifically in the Sub Saharan context applies to the latidunal re-assortment of the flora due to the shortening of the July October rainy season. This involved the die-off of many plant species due to the reduced length of the rainy season, with those same species of plants having to re-establish themselves further south – this coinciding with the ‘satellite era’, which does not take into account the massive and sudden degradation of the AEW weather system [see chart] which started in 1964. Thus, what had been arboreal forest from 10’N to 15’N, had been significantly denuded with the observed reduction in the AEW rains, then (concurrent with the introduction of satellite imaging), the previously denuded landscape had been re-covered with savannah and chaparral with more primitive and shorter lived grasses.
Check this out. The Sub Sahara region and it’s associated African Easterly Wave (AEW) cloud cover/rain source had reduced in frequency from about 100 to 60 per year (judging by the associated historic reduction in River flow). This impacts right around the equator, with a measurable increase in SSTs in the regions from which the AEW cloud has gone missing. This SST dynamic is comparable to published GW data. See here: https://www.allaboutenergy.net/216-environment/man-made-global-warming-organizations-discussing-all-positions/europe/2764-reasons-for-increase-in-global-mean-temperature-and-climate-change
It might work like this 1) Cloud cover generally increases with RH. If there is a random temperature increase, RH over water will increase with temperature, while RH over land will decrease as described in Biblio item #2 2) Decreased RH over land results in less cloud over land. Thus higher temp increase over land….due to increased sunlight. 3) As the higher land temp becomes absorbed by the rest of the planet, sea surface temp will rise, making more cloud. 4) More ocean clouds reflect more sunlight to outer space 5) Planet cools again. Time constant…decades to swing SST, temp swing a couple of degrees….Just hypothesizing….
<- how is that assumption testable? Clouds form in the upper troposphere. Perhaps if, instead, you wrote
“1. Cloud cover generally increases with RH in the upper to mid-troposphere“.
Oh wait a minute, warmists tell me more CO2 leads to higher RH in the upper to mid-troposphere. But if that leads to more clouds, then we get more cooling!!
Mark, it is a general observation….no test required
One of dozens of papers, see fig. 1
https://www.nature.com/articles/s41598-019-52437-6
The global air pressure has been decreasing for decades (HadSPL2 dataset – discontinued from 2003). The supposed increase in RH was an false assumption to comply with the failed emissions theory. yet by the climate franchise credo, when the data diverges from the theory, then the data must be wrong.
Very close. Yet recycling from land (evaporation and transpiration) are VERY significantly reduced due to river management and drainage systems (+73,000 dams over 30m high). This reduced land recycling being the initiator of the reduced cloud cover (concurrent with reduced organic CCNs) which reduced cloud cover over the oceans. Yet surface solar radiation over land is 100 times more a factor than in deep water, where the short wave radiation penetrates into the depths. Ocean insolation is less of an evaporative feature than land evaporation. This observed USA sized increasing (HadISST1) SST anomaly off the African west coast, caused by increased insolation (due to reduced AEW marine stratocumulus cloud cover) does not produce an increase in cloud/moisture imported to the Caribbean and continental USA – i.e. rain and moisture which previously would have rained in your southern states, that was then recycled NW towards the western seaboard.
Many thanks, Charles Blaisdell, for posting this. Many very useful links, too. BTW, I don’t buy the land-use theory – I am quite sure that climate is driven by the ocean far more than by the land. But there’s lots to analyse here.
Why does there have to be one dominant factor that controls climate(s) behaviors?
The way I see it, every climate has a constantly simmering stew of phenonema that in combination at different times will dictate what weathers will occur.
IMO, the “Search For The Holy Grail” of climate control is a human folly of epic proportions.
It is an orchestra all combining into one whole. Different instruments loud/soft at different times. Different instruments with different rhythms at varying times. Constantly changing and then repeating!
This is the Holy Grail. Tho there are local and regional cause and effects, this research shows why the Global Signal has changed. https://www.allaboutenergy.net/216-environment/man-made-global-warming-organizations-discussing-all-positions/europe/2764-reasons-for-increase-in-global-mean-temperature-and-climate-change
Climate is driven largely by the interaction of air masses that move across oceans and land surfaces, again, due to the massive difference in specific heat of liquid water compared to that of any kind of land surface, regardless of whether it is developed or entirely natural, and heavily vegetated or not.
Any one who is knowledgeable of weather processes knows this. That is why meteorologists speak of climates that are predominately maritime (thus more humid, and much smaller temperature cycles, both seasonal and diurnal) or continental (drier, and far larger temperature cycles, both seasonal and diurnal).
That is why, for instance, winters are far more brutally cold in Montana than in coastal Washington – even though they are at the same latitude and have the same predominantly western winds. Coastal Washington has a predominantly maritime climate, wetter and less extreme temperatures, while Montana has a predominantly continental climate, drier and far more temperature extremes.
The CRGW theory is a very small interruption to your natural cycle. It throws in a random curve ball of hot low RH air.
The land use changes are creating cloud cover changes that mainly effect the oceans, see (5) and the GW calculation table at the end of the post, 85% to the oceans. You are right about the oceans. CRGW theory is about how the GW gets there. I know I have not addressed the long time constant of ocean response.
Send me an email address and I can post all the info you need to colour inside the lines. CM
It is not a theory! Large scale river management had altered one of the precursors to the massive African Easterly Wave weather system, which has subsequently reduced the equatorial cloud cover, resulting in a corresponding increase in ocean insolation and SST increase. It is all here: https://www.allaboutenergy.net/216-environment/man-made-global-warming-organizations-discussing-all-positions/europe/2764-reasons-for-increase-in-global-mean-temperature-and-climate-change
Concerning the new CRGW theory, the land mass in the Northern Hemisphere relative to the Southern Hemisphere is 68% to 32%.
The latest IPCC figures (HadCRU5)show the warming of the Northern Hemisphere is 0.28C per decade while the warming in the Southern Hemisphere is 0.11C per decade.
So it appears that the change in land usage predicated in the new theory is consistent at a basic level with the respective hemispheric warmings.
Which still leaves the conundrum for the CAGW theory, if CO2 is a well mixed gas throughout the atmosphere of the planet, why is the Northern Hemisphere warming at a rate two and one half times that of the Southern Hemisphere?
Or is there something else which has been overlooked,such as the new theory.
Andy May addresses this in his latest book and suggests the HadCRU5 gauge of Northern Hemisphere warming might be flawed or some other forces are at play.
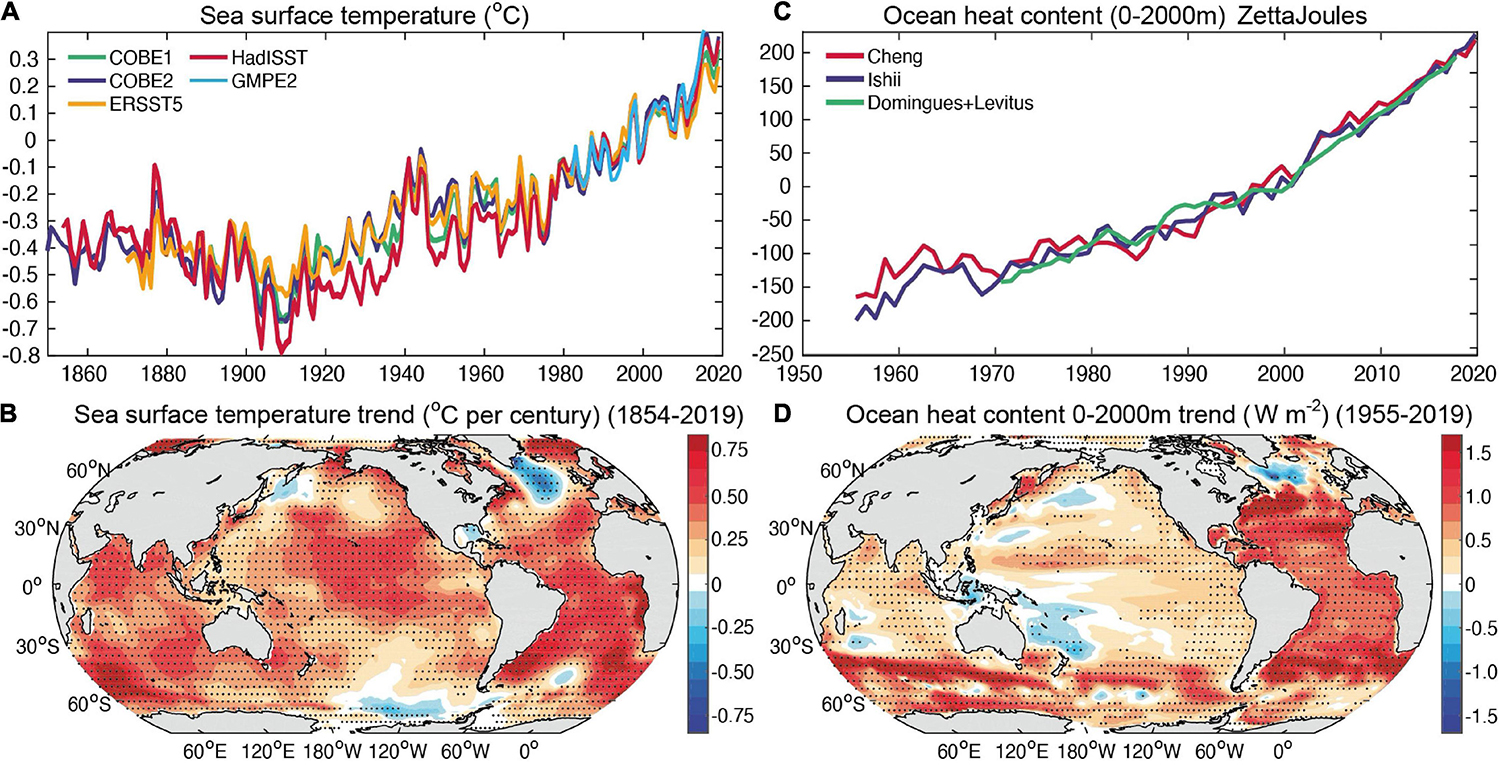
Deep ocean heating and ocean surface heating are predominantly occurring in the Atlantic Ocean:
This is consistent with the land masses around the Atlantic warming more than other land masses due to changes in land use.
Warmer, drier land means less latent heat transfer from ocean atmosphere to land atmosphere and consequential reduction in freshwater runoff:
https://wwf.panda.org/wwf_news/?344895/A-new-study-reveals-the-Amazon-is-losing-surface-water
Do you expect the Atlantic SST to turn over in the near future?
I expected the South Atlantic to be cooling now because the Southern Hemisphere solar intensity is in slow decline as perihelion occurs ever later than the austral summer solstice. That has been the case for 500 years. Only small changes so far The Pacific is indicative of what I expected.
However ocean surface and deep ocean also warm up when the adjacent land warms up causing less latent heat transfer through evaporation from oceans that ends up as precipitation on land.
No. See the above chart: ‘Summer Sea against Global Warming Indices’. The equatorial oceans have recalibrated their solar energy absorption budget, due to the significant reduction in cloud cover. There is nothing in the foreseeable future which will alter that heating vector. Even if the summer sea signal flattens, there will still be a net (though reduced) increase in global mean temperature.
This Levitus et al (2012) provides a better impression of OHT.
“Hemisphere warming might be flawed or some other forces are at play.”
Systems have been developed (in some places) to deal with data that does not conform to the ‘preferred climate wisdom’
It is called….adjustment..
What is the margin of error for all these measurements? Most are fractions so a one degree of error could flip the direction of the change.
“Andy May addresses this in his latest book and suggests the HadCRU5 gauge of Northern Hemisphere warming might be flawed or some other forces are at play.”
Or both. 🙂
I have not looked at SH vs NH land mass in the CRGW theory. Your observation makes sense in that with larger land mass should have a higher probably of a UHI or forest to crop land change. On the other hand, a smaller land mass could have a very large area of virgin land change that rivals the larger land mass CRGW’s impact. The data in (5) did look at that.
The observed increase in ocean SST (due to increased insolation resulting from reduced AEW cloud cover) is seen to be predominantly just north of the equator [chart showing 1’N to 30’N, westwards from west Africa]. Thus predominantly affected by the northern hemisphere OHT.
Wavy jet stream tracks, more clouds.
Zonal jet stream tracks, less clouds.
Lots of other factors, as described above create local or regional variations but globally what matters is jet stream behaviour.
Note that clouds are a consequence of air mass uplift such that moist air rises until its temperature drops below the dew point.
For every location of uplift there is descent elsewhere and in those other places air descends, warming in the process and dissipating clouds as the temperature rises above the dew point.
Thus in global terms all the variations described above net out to zero.
The only way to change global cloud cover overall is to increase or decrease lateral movement of air masses which is achieved on the large scale by changes in jet stream behaviour.
The situation over tropical oceans is quite different to this picture. It is an explosive process rather than a gentle uplift until the dew point is reached.
The conditions of the upper atmosphere change throughout the deep convective cycle. The persistence of high altitude ice controls the surface sunlight to achieve a surface energy balance when the water surface is at 30C.
Water bursts upwards during cloudburst at tremendous velocity in the convecting zone and adjacent air is entrained into the rising column. The rising air is explosive and concentrated. The falling air occurs over a much larger area and descends slowly by comparison with the the rising column.
Deep convection is a completely different beast to common air convection below the level of free convection. The convective potential inevitably rises until the energy is released by cloudburst; pumping masses of water high into the atmosphere – up to 14,000m. Most comes down almost immediately as rain but the cumulonimbus cloud gives way to persistent cirrus cloud that continues to reflect sunlight.
Convective potential that drives deep convection dominates the tropical oceans:
https://earth.nullschool.net/#current/wind/surface/level/overlay=cape/orthographic=-247.97,18.73,356/loc=88.502,18.574
A CAPE of 3208J/kg (highlighted off India)) will produce an updraft of 290kph; enough for baseball size hailstones. Also notice the cyclone to the east of Japan is being spun up by CAPE; essential energy sorce for the formation of cyclones.
Interesting comments.
A sweet little exercise in minutiae in an attempt to create clarity and completeness.
Otherwise and in a nutshell = what I’ve been raving about on here since my first few comments.
Trouble is that the ‘completeness’ makes it damn near impenetrable and with far too many points for anybody who wants, to attack it.
Primarily of course and not least, lets dump the political correctness in favour of real thermodynamics:
viz: The atmosphere does not, can not, ‘radiatively force’ the surface
All we really needed was a few figures we could play with and check and some observations we might make to back them up.
Such as:
The Albedo of ‘green things’ is about 0.4 to 0.45 (seemingly crazy, plants are ‘dark coloured things’ so why the same Albedo as 3 year old snow/ice?
The Albedo of a freshly ploughed field is about 0.10 while still damp, rising to 0.15 when it dries out
That last little point being crucial = ‘when it dries out’
Not only have water-transpiring plants gone, but so has the water near the surface. Also what vanishes, to blow away in whatever breeze there might be, are the soil bacteria that retained that water.
Hence no clouds to leave a bright sun (especially late spring early summer when the sun is strongest) blazing down on dark coloured soil with lowered heat capacity.
That things haven’t warmed up more than they have is the true wonder of all this.
It gets worse because the farmers then come along and till that land (they are still doing tillage even if they imagine they are doing something called ‘No Till’ and that raises epic clouds of (visible) dust but also raises invisible clouds of dead and fractured bacteria. One billion of those bacterial fragments fall back to earth on every square metre every day.
In the sky these have 2 effects:
Just like the CCCP did by throwing cement out of military transports in the days/hours prior to their May Day parade. The fine particulate, hugely hygroscopic, cement seeded any approaching clouds and assured a bright blue sky sunny day on May 1st for their parade – amazing for somewhere as geographically placed as Red Square Moscow is and at that time of year. Every single time.
And no-one noticed, they really did think that God Was Smiling on the communists.
We wanna be careful, dumbness might soon become part of our genetic make-up.
(Sorry, I didn’t quite catch that from the back – can you repeat?)
Very similar dust is created not only by farmers, tilling or no-tilling, but especially by road transport
The clouds haven’t got a chance with that kind of onslaught.
And we know they’ve gone because sea-level is creeping up. In some places more than others = another aspect of tillage.
And again. let’s dump the fake niceness. The GHGE can not radiatively force the water any more than it can the land – only the sun can warm the ocean
## What is a real delight and wonder in this is when NASA come along with their OCO Sputnik and tell us that it cannot see the well mixed CO2 ‘because of all the clouds’
Even more bizarre was that when OCO was first launched, 6 or 7 years ago, it could see clearly down to the ground wherever it went
Perhaps The Clean Air Act had some contribution given the reduction of particulates?
Global Brightening following Global Dimming?
So you are saying that humans are getting dumber.
I agree with that. I have said for decades that the IQ of the earth is fixed. The population is growing. You do the math if you still can.
bluecat, I have maintained that the collective IQ of a group is the average IQ divided by the number of people in the group. Use that formula for Congress I think it will prove correct.
Remember this chart first published years ago.
http://www.climate4you.com/images/CloudCover_and_MSU%20UAH%20GlobalMonthlyTempSince1979%20With37monthRunningAverage%20With201505Reference.gif
Aligns almost perfectly with the AMO. The secondary cloud reduction will not show up because it is cloud thinning and happened in 2014 with the PDO phase change.
Great chart. Wish I had it when I wrote the paper. About a 2% drop in 40 years. More than enough to account for all the GW in those 40 years, about ‘5C. The excess into the oceans?
Great chart. Wish I had it when I wrote the paper. About a 2% drop in cloud cover in 40 years. More than enough to account for all the GW in the 40 years, +5’C. Excess into the oceans? For 40 years CRGW worked.
Great summary of reduction of RH, and the implications for cloud cover.
I also think that it is a cyclic nature in this. Martin Wild and others found a great change about 1983, with a transition from global dimming to global brightening. It was also a global warming from about 1915 to 1950, that perhaps can be explained with global brightening.
When I look at the CERES data the change of cloud cover seems to be responsible for about 2/3 of the warming, and water vapor and GHGs for about 1/3. I have discussed this at Science of Doom.
https://scienceofdoom.com/2017/12/24/clouds-and-water-vapor-part-eleven-ceppi-et-al-zelinka-et-al/#comment-169412
Years ago I remember discussing with my baker the large extractor fans on the roof of his bakery. These looked like enormous mushrooms. These were not electrically driven but simply by natural air flow. He told me that they worked surprisingly well. Why is it that people do not appreciate and use simple, cost effective solutions but go for costly high tech solutions? This applies especially when it comes to the enormous and prohibitive cost of trying to engineer climate (or better the various climates) and not focus on simper and much, much cheaper ways to adapt and even benefit from climate changes?
You mean like opening a window?
Oh wait, if there are windows, they no longer open.
WOOHOO! Periodically redirect some of the July October flow from the Atbara and Gash rivers in the Kassala region of northern Sudan, into very large shallow (250mm) evaporation lakes. The subsequent moisture being channelled along route 3a in the attachment [Viste and Sorteberg: 2013] under the influence of the Northern Hadley cell, to rise on the Ethiopian Highlands to incept the easterly monsoon. The subsequent ‘kiremt’ rainfall event then pushed westwards by the trades, becoming organised into African Easterly Waves, which ends up producing USA sized marine stratocumulus solar reflective cloudscapes over predominantly the north equatorial Atlantic. This will reduce the planets heat budget sufficient to stabilise or reverse the GW effect. Cheap and easily controllable. CM
I would like to give some quick comments on the concept of “radiative
forcing” which (I guess) this author is suggesting could decrease
Earth’s cloud cover (or maybe increase it, having the counterintuitive
effect of cooling the Earth!). Greenhouse gas warming advocates
make the preposterous claim that “greenhouse gases” absorb
heat high above the Earth and then “reflect” it back to the surface,
thereby warming the Earth. It’s called “radiative forcing”. But, in
fact, electromagnetic absorption / emission by a gas has absolutely
nothing to do with the concept of electromagnetic reflection. No gas,
greenhouse or not, reflects ANY wavelength of light under any
circumstances, though greenhouse gases certainly absorb, I presume by
definition, the longer wavelengths of infrared light. But absorption is
NOT reflection! While gases can absorb or emit electromagnetic energy,
they can NEVER scatter or reflect it (liquid or solid suspended
particles can, but what does that have to do with greenhouse gases?).
It is true that after far infrared light energy is absorbed by
greenhouse gases, it can then be reemitted (though, usually, at moderate
pressures, not at the same frequency it was absorbed) — this is what a
gas can do. This reemission is isotropic. A portion of this reemission
is lost to space when it goes in an upward direction, and, depending on
its altitude above the surface of the Earth, MAYBE some of that
reemission going in a downward direction (IF it can make it to the
surface) can contribute to surface warming. But a far greater
proportion of this absorbed heat isn’t radiated at all — rather it
convects away, ultimately into outer space. And virtually ALL of the
heat present above 20,000 feet in the atmosphere, whatever its origin,
reemitted or not, going downwards or not, NEVER makes it back down to
the surface of the Earth, so that that heat has absolutely no warming
effect on our weather down here on Earth’s surface whatsoever. Nor does
it have any major effect on cloud cover because almost all reflecting /
scattering cloud cover on the whole of the Earth is below that altitude!
The “problem” of global (surface) warming and (maybe) albedo reduction
from greenhouse gases is, in fact, non-existent.
I would also like to comment on the concept of “earth’s net incoming
energy flux”, bandied about by climate scientists all day long. This
number represents a subtraction of 2 variables, both of which are extremely
complex and difficult to measure, both of which have significance only at
wildly different altitudes above the surface of the Earth, and neither of which
are significantly related to the other in many other respects. It would
behoove climate “scientists” to focus, instead, on mechanisms whereby
heat incident on the surface of the Earth “stuck” there for a
considerable length of time, as opposed to quickly leaking back out into
outer space from whence it came, however the balance is somehow struck
between those two flows of heat.
David Solan
You need more accuracy when you describe “surface”. The “surface” is a boundary point where the solid earth meets the atmosphere. Downward radiation can not warm the solid earth beyond what the sun does. It is the hot body and will continue to radiate at the hot temperature regardless of what energy is absorbed from cooler GHG’s. The extra absorbed energy only prolongs the length of time that the solid earth will continue to radiate at the same temperature. In other words, it reduces the gradient of heat loss, it doesn’t increase the gradient by increasing the temperature of the solid earth beyond what the sun can do. This is exactly what insulation does.
The downward radiation, however, can increase the gradient of heating in the lower atmosphere. If a CO2 molecule has just lost any absorbed radiation, either by collision or reradiation it can absorb downward radiation and conduct the energy to N2/O2. That is additional energy to the lower atmosphere. Now one may question the altitude at which this occurs since CO2 close to the solid earth is probably saturated by IR from the solid earth.
I do agree that the radiation is isotropic, i.e. an expanding sphere of EM energy. Most folks don’t understand that this means the energy at any point on that expanding sphere is reduced as you travel away from the point source. Scientists use steradians to counteract this so that similar “w/m^2” are used in calculations. In other words, similar proportions of expanding areas of the sphere are looked at. CO2 molecules don’t “see” steradians, an individual molecule only sees a point on that expanding EM wave. Thus the amount of energy it sees from a source on the solid earth is reduced the further you rise in the atmosphere.
David-
“No gas, greenhouse or not, reflects ANY wavelength of light under any
circumstances…”
Why do you think the sky is blue? Ans: Because Nitrogen, at 70% of the atmosphere, scatters primarily blue light.
Google: “Mie theory or Mie scattering”
Clean air acts, less sulphates, particulates, especially in the US and Europe. Ever heard of the smogs in London from coal fires?
Less cloud = warmer. Is GW really just a result of clean air? Looks like it.
Definitely sulfur dioxide emission from combustion of hydrocarbon fuels have been trending down considerably from the 1970’s (coal first, then gasoline, diesel, jet fuel and now marine fuel oil). The reduction of sulfur in jet is significant since emissions occur at high altitude.
These models are working with a very limited data set. This article mentions three sources: Ground records of global cloud cover over 40 years, a 37-year European only study and 20 years of satellite data. I would venture to suggest this area of science is in its infancy and we need to exercise great caution before drawing all sorts of climate conclusions.
All one needs is a black swan moment. It was once believed that black swans did not exist but now know there are a surprising number. This should be a cautionary story for all climate alarmists.
I would also add, what is the size if uncertainty in the cloud cover measurements? Are they small enough to draw any conclusions at all?
I agree, This post does base most of its conclusions on 20 to 40 years of data. The back of the envelope calculations for those 20 to 40 years says that reduced cloud cover can account for all the GW in that 20-40 years. The only longer term evidence was the Moscow chart that showed low RH behavior in a UHI for over 100 years. Could CRGW be the black swan?
And don’t forget the great experiment of grounding all the jets during the three days around September 11, 2001:
Regional Variations in U.S. Diurnal Temperature Range for the 11–14 September 2001 Aircraft Groundings: Evidence of Jet Contrail Influence on Climate
https://journals.ametsoc.org/view/journals/clim/17/5/1520-0442_2004_017_1123_rviudt_2.0.co_2.xml
We already have some experimental data…
Just got to your good comment. The sulfur content of jet fuel has been declining since about the 1990’s. Thus, aerosols formed from this are being reduced also.
“Where have all the Clouds gone and why care?”
They spend a lot of their time over Southern England.
I care because I like the Sun
Absolutely!
I was wondering yesterday why they all line up in rows of same sized clouds…
Frontier of cold airmasses…
‘The line-storm clouds’?
So you could shout at them Griff.
Griff,
That phenomenon is understood by the vast majority of atmospheric scientists as being a result of the increased blocking surface tension, which is in turn the result of a carbon dioxide spike and dispersal mechanism as associated with the human impacted diurnal energy releases, and, of course cow farts.
If you think the clouds spend a lot time in Southern England trying moving up north
In the north, we don’t tan, we just rust on the outside
My father was a Yorkshireman and I recall going there many times as a child. They’re a breed apart!
On my first trip to Jolly Ol’, I saw a several story building disappear
into the fog in under 45 minutes in the middle of the afternoon.
When I got back to W TX, I deliberately walked several blocks to get
groceries as there was this big yellow object in the sky that I hadn’t
seen in a while!
That were nowt lad,
I had to get up in the morning at ten o’clock at night, half an hour before I went to bed, eat a lump of cold poison, work twenty-nine hours a day down mill, and pay mill owner for permission to come to work, and when we got home, our Dad would kill us, and dance about on our graves singing “Hallelujah.”
But you try and tell the young people today that… and they won’t believe ya’.
It was actually only 40 minutes but I said 45 cuz I knew people
wouldn’t believe me!
😉 😉 😉
@ur momisugly +0.41%/decade, you & all the lousy PV solar panels will get an extra 10
minutes of sunshine/day in a century. That should push you over 5 hrs/day.
WOW!!! 😮 😉
Considering that we have cold oceans, the water could use a
wee bit of warming, too!
I’ll take any warming that’s going….
The rainforest draws water further inland than without. The theory has been developed by Gorschkov and Marakieva. Of course they’re Russian so as also in the case of INM they get short shrift. Ref: Biotic Pump: Contents (bioticregulation.ru)
That is an interesting perspective for higher latitudes and not dissimilar to what occurs in the tropics.
In tropical regions, the atmospheric moisture over land is needed to support deep convection at least 45mm total water column. Once deep convection is initiated, it creates a strong convergence zone that draws in mid level moisture from the oceans.
Australia has experienced unusually high levels of atmospheric moisture this year and it had already occurred before the volcanic eruption in the Pacific that pushed water into the stratosphere.
Umm – isn’t this what Ferenc Miskolczi predicted – reducing atmospheric water vapour compensating for increasing CO2 with the result of an unchanging emission height? Are we still allowed to say his name here?
Charles Blaisdell,
I have never heard of Cloud Reduction Global Warning, CRGW, I appreciate knowing about it now.
I have a working knowledge of albedo, it’s origins, causes and effects, but this is an eye opener for me.
I have known of the history of science looking at ‘Cloudiness’ as 19th century ‘Geographers’ referred to it. I put modern day sciences dismissal of the role of clouds in weather and climate as brushing an inconvenient truth under the carpet.
Could I ask the author to publish here an article on aerosols effect on cloud formation. CERN have a department dedicated to that.
CRGW does suggest looking at anthropogenic activity, as it affects weather and climate, could be widened to reappraise the changes brought about with deforestation. I see difficulties doing that for residents in both camps of the climate debate.
This depth of science is way above my pay grade, my quest for the truth is what makes it relevant…_
Thanks for the comments. Yes, CRGW is like sweeping natural science under the carpet. I hope the IPCC dusts off the old cloud related GCMs that were abandon because it was believed there was no change in cloud cover over time and looks at them again now that we have seen cloud reduction for 20-40 years.
Just look up! Maybe you could see something that possibly might have an impact on climate..
These contrails have temperatures in the 215K range. They emit only about 110W/m2 into space, about 130W/m2 less than average emissions. For every percentage point they effectively cover the sky, they produce a forcing of 1.3W/m2.
Next, despite they are having a low albedo (see below), they block a lot of sun light. This direct sun light however has a pivotal role in the water cycle of Earth. Evaporation is a function of insolation. If cirrus clouds dim the sun for the weather system below, you get less evaporation, relatively drier air and less natural clouds.
http://www.eumetrain.org/data/4/461/media/images/Ch3/Ch3_Fig02a_simulated%20albedo.png
On top of that, the combination of forced heating with restricted humidity has other effects than models predict for a CO2 related GW. The lapse rate hardly changes and the tropospheric “hot spots” fails to materialize. Needless to say the warming strictly follows the patterns of air travel, both in terms of time (1970s onward) and place (mainly NH, none in the Antarctic).
“Needless to say the warming strictly follows the patterns of air travel, both in terms of time (1970s onward) and place (mainly NH, none in the Antarctic).”
Contrails don’t explain the similar warming, of a similar magnitude to today’s warming, that took place from 1910 to 1940.
The sun does however. Sorry for focusing on anthropogenic factors..
“could be?” It’s unlikely global cloud cover decreased for 100 years. The trend shows a decrease but I bet there were increases from time to time. I bet post-1930s cooling was due to cloud cover increases. Until we can better describe the mechanisms we’re befuddled. This is just one more reason why I despise Warmists – they misallocate resources away from likely causes of climate change.
<- there you have it! Warmism is “a jobs for our boys“, misallocation of resources to reward group-think over competence.
BTW: Thanks for this. I’m happy to read every and any article on clouds; I’m even happy to hear plausible wrong ideas – provided ideas are testable.
From the article: “UHI plumes can also affect approaching thunder storms (20), the hot rising air is displaced by lower cooler air associated with the thunder storm and moves the storm toward the UHI over the UHI the storm can mix with the hot air and break into smaller cells, but the storm reforms after passing the UHI.”
That’s an interesting concept. I’ll have to keep this in mind when I watch weather fronts in the future.
I see it at my house all the time in the summer. As a line of t-storms approach our city (Raleigh NC), they basically split. One side goes north and the other side goes south leaving a rain shadow over my house. They reform on the east side and continue on. It only happens during the hot months. We probably get 10 inches of rain less than the northern suburbs. You don’t see it with a tropical system since the winds overcome the thermals generated by the downtown concrete.
I can see that working with a larger town like Raleigh. I wonder what caused what we used to call the “weather donut” we lived in down in Clayton…
“I see it at my house all the time in the summer. As a line of t-storms approach our city (Raleigh NC), they basically split. One side goes north and the other side goes south leaving a rain shadow over my house.”
I’ve been seeing that same pattern for a long time. I’m outside Tulsa, Oklahoma about 40 miles, and there have been numerous times when a solid storm front is approaching Tulsa but when it gets to my location then the front splits in two, and one part of the front goes north of me and one part goes south of me. I have wondered for years what could cause such a thing. It happens too often to be random. At one time I wondered if the Arkansas river might have something to do with it.
Now, this article may have provided a reason for this sudden change in the storm front when it gets about 20 miles from my location after passing by Tulsa’s heat island.
Of course, this doesn’t happen every time, but it happens enough to be noticable.
Very interesting! 🙂