Friday’s post principally reported on the recent (February 8, 2022) article by O’Neill, et al., in Atmospheres, “Evaluation of the Homogenization Adjustments Applied to European Temperature Records in the Global Historical Climatology Network Dataset.” In the piece, O’Neill, et al., dramatically demonstrate that the NOAA/NCEI “homogenization” algorithm is wildly off the mark in its intended mission of identifying and correcting for supposed “discontinuities” or “breakpoints” in weather station location or instrumentation in order to provide a more accurate world temperature history. At the same time, although not mentioned in O’Neill, et al., the NOAA/NCEI algorithm is wildly successful in generating a world temperature history time series in the iconic hockey stick form to support the desired narrative of climate alarm.
What should be done? O’Neill, et al., for reasons that I completely cannot understand, buy into the idea that having a group of government-paid experts correct the temperature record with a “homogenization” algorithm was and is a good idea; therefore, we just need to tweak this effort a little to get it right. From O’Neill, et al.:
[W]e are definitely not criticizing the overall temperature homogenization project. We also stress that the efforts of Menne & Williams (2009) in developing the PHA . . . to try and correct for both undocumented and documented non-climatic biases were commendable. Long-term temperature records are well-known to be frequently contaminated by various non-climatic biases arising from station moves . . ., changes in instrumentation . . ., siting quality . . ., times of observation . . ., urbanization . . ., etc. Therefore, if we are interested in using these records to study regional, hemispheric or global temperature trends, it is important to accurately account for these biases.
Sorry, but no. This statement betrays hopeless naïveté about the processes by which government bureaucracies work. Or perhaps inserting this statement into the piece was the price of getting it published in a peer reviewed journal that, like all academic journals in the climate field today, will suppress any piece that overtly challenges “consensus” climate science.
Whichever of those two it is, the fact is that any collection of government bureaucrats, given the job to “adjust” temperature data, will “adjust” it in the way that best enhances the prospects for growth of the staff and budget of the bureaucracy. The chances that scientific integrity and accuracy might intrude into the process are essentially nil.
Is there any possibility that a future Republican administration with a healthy skepticism about the climate alarm movement could do anything about this?
For starters, note that President Trump, despite his climate skepticism and his focus on what he called “energy dominance,” never even drained a drop out of this particular corner of the swamp. It took Trump until September 2020 — just a few months before the end of his term — to finally appoint two climate skeptics, David Legates and Ryan Maue, to NOAA to look into what they were doing. Before they really got started, Trump was out and so were they.
Even if a new Republican President in 2025 got started on his first day, the idea that he could quickly — or even within four years — get an honestly “homogenized” temperature record out of NOAA/NCEI, is a fantasy. The existing bureaucracy would fight him at every turn, and claim that all efforts were “anti-science.” Those bureaucrats mostly have civil service protection and cannot be fired. And there don’t even exist enough climate skeptics with the requisite expertise to re-do the homogenization algorithm in an honest way.
But here are some things that can be done:
- Do an audit of the existing “homogenization” efforts. Come out with a report that points to five or ten or twenty obvious flaws in the current algorithm. There are at least that many. The O’Neill, et al., work gives a good starting point. Also, there are many stations with good records of long-term cooling that have been “homogenized” into long-term warming. Put the “homogenizers” on the hot seat to attempt to explain how that has happened.
- After the report comes out, announce that the government has lost confidence in the people who have been doing this work. If they can’t be fired, transfer them to some other function. Don’t let the people stay together as a team. Transfer some to one place, and some to another, preferably in different cities that are distant from each other.
- Also after the report comes out, announce that the U.S. government is no longer relying on this temperature series for policymaking purposes. It’s just too inaccurate. Take down the website in its current form, and all promotion of the series as something providing scary information about “hottest month ever” and the like. Leave only a link to hard data in raw form useful only to “experts” with infinite time on their hands.
- Stop reporting the results of the USHCN/GHCN temperature series to the hundredth of a degree C. The idea that this series — much of which historically comes from thermometers that only record to the nearest full degree — is accurate to one-hundredth of a degree is completely absurd. The reporting to an accuracy of a hundredth of a degree is what gives NOAA the ability to claim that a given month was the “hottest ever” when it says temperature went from an anomaly of 1.03 deg to 1.04 deg. I suggest reporting only to an accuracy of 0.5 of a degree. That way, the series would have the same temperature anomaly for months or years on end.
- Put error bars around whatever figures are reported. Appoint a task force to come up with appropriate width of the error bars. There should be some kind of sophisticated statistical model to generate this, but I would think that error bars of +/- 0.5 deg C are eminently justifiable. Again, that would make it impossible to claim that a given month is the “hottest ever,” unless there has been some sort of really significant jump.
Discover more from Watts Up With That?
Subscribe to get the latest posts sent to your email.
A time change in any ” global average temperature anomaly” is physically meaningless in a flow system where both energy and mass are continually (and variably) being transferred from the tropics to the poles. Radiation is “line of sight and speed of light”. Minute average net IR has been recorded at four “base-line” sites for measuring atmospheric CO2 concentrations. The radiation and CO2 data are recorded in different sets of data with different time resolutions. The minute data containing both radiation , temperature and humidity needs to be hourly averaged to be able to test any affect of hourly average CO2 data.
To properly analyze these available data requires a lot more computing capacity and programing skill than I have. NOAA should be able to do it with their data.
Ahem … you can’t justify a precision greater than the granularity of your equipment.
You’re speaking a language foreign to those living in air-temperature-land, Mike.
Climate “Scientists” are strangers to Physics and Metrology.
+10^1000
So an article from a right-wing fossil fuel front site referencing a non-peer-reviewed “paper” written by the same collection of tired old shills, frauds, and liars like Soon is somehow supposed to represent “research” that successfully contradicts the findings of NASA, NOAA, NSIDC, the Royal Society, the UK Meteorological Office, the American Meteorological Society, and nearly 200 other scientific organizations around the world that conclude the current spike in global temperatures is a result of human activity?
Keep trying, Shirley you can be more abrasive that this. Go for it!
I think that is about his best shot.
Barry is trying to earn the troll of the week award but he is falling way short of the mark. Good trolls engage with targets and show some knowledge about the subject matter.
He still does not know that open access papers are peer-reviewed just like paywalled papers in journals because he seldom reads replies to his posts.
>>He still does not know that open access papers are peer-reviewed<< No, they’re not. The “Open Access” disclaimer at the top of the paper referenced by this article is a disclaimer by the publishing journal to ensure the reader is aware that the paper has NOT been vetted by their review process and has no warranties as to its credibility or veracity.
From AGU – the host organization for the publication in question:
What is Open Access?
Open Access (OA) refers to journal articles and other published materials that are distributed online and are completely free to access by the reader. The costs of publication are borne by the author(s) or their funder(s) through a publication fee rather than readers or institutions through either a subscription or pay-to-view charges. This business model was the spark for a larger movement towards greater access and transparency of scientific research.
You can find this information at the link below.
https://www.agu.org/Publish-with-AGU/Publish/Open-Access
My experience in this area includes nearly 40 years as an author, peer-reviewer, editorial board member and associate editor for various journals. Open Access articles in AGU journals are vetted by the peer-review process.
No. “Open access” means that downloads are free of charge.
They are free of charge because the journal’s expenses and profit have been covered by the author, either by payment from some grant account or out of pocket.
Open Access says nothing about the quality of the work.
Yes
The division between human and natural causes of climate change are unknown because the IPCC arbitrarily dismissed all natural all causes as “noise” in 1995.
It could be GUESSED that the warming since 1975 was faster than expected from 100% natural causes, but there is no proof of that. Guessing is not science.
Remember that this planet had 4.5 billion years of 100% natural climate change before 1975. It did not suddenly become 100% man made climate change AFTER 1975 simply because people with science degrees say so. Your appeal to authority logical fallacy statement is pitiful. You are a dingbat.
>>The division between human and natural causes of climate change are unknown because the IPCC arbitrarily dismissed all natural all causes as “noise” in 1995.<< That’s rubbish. The division is quite well understood.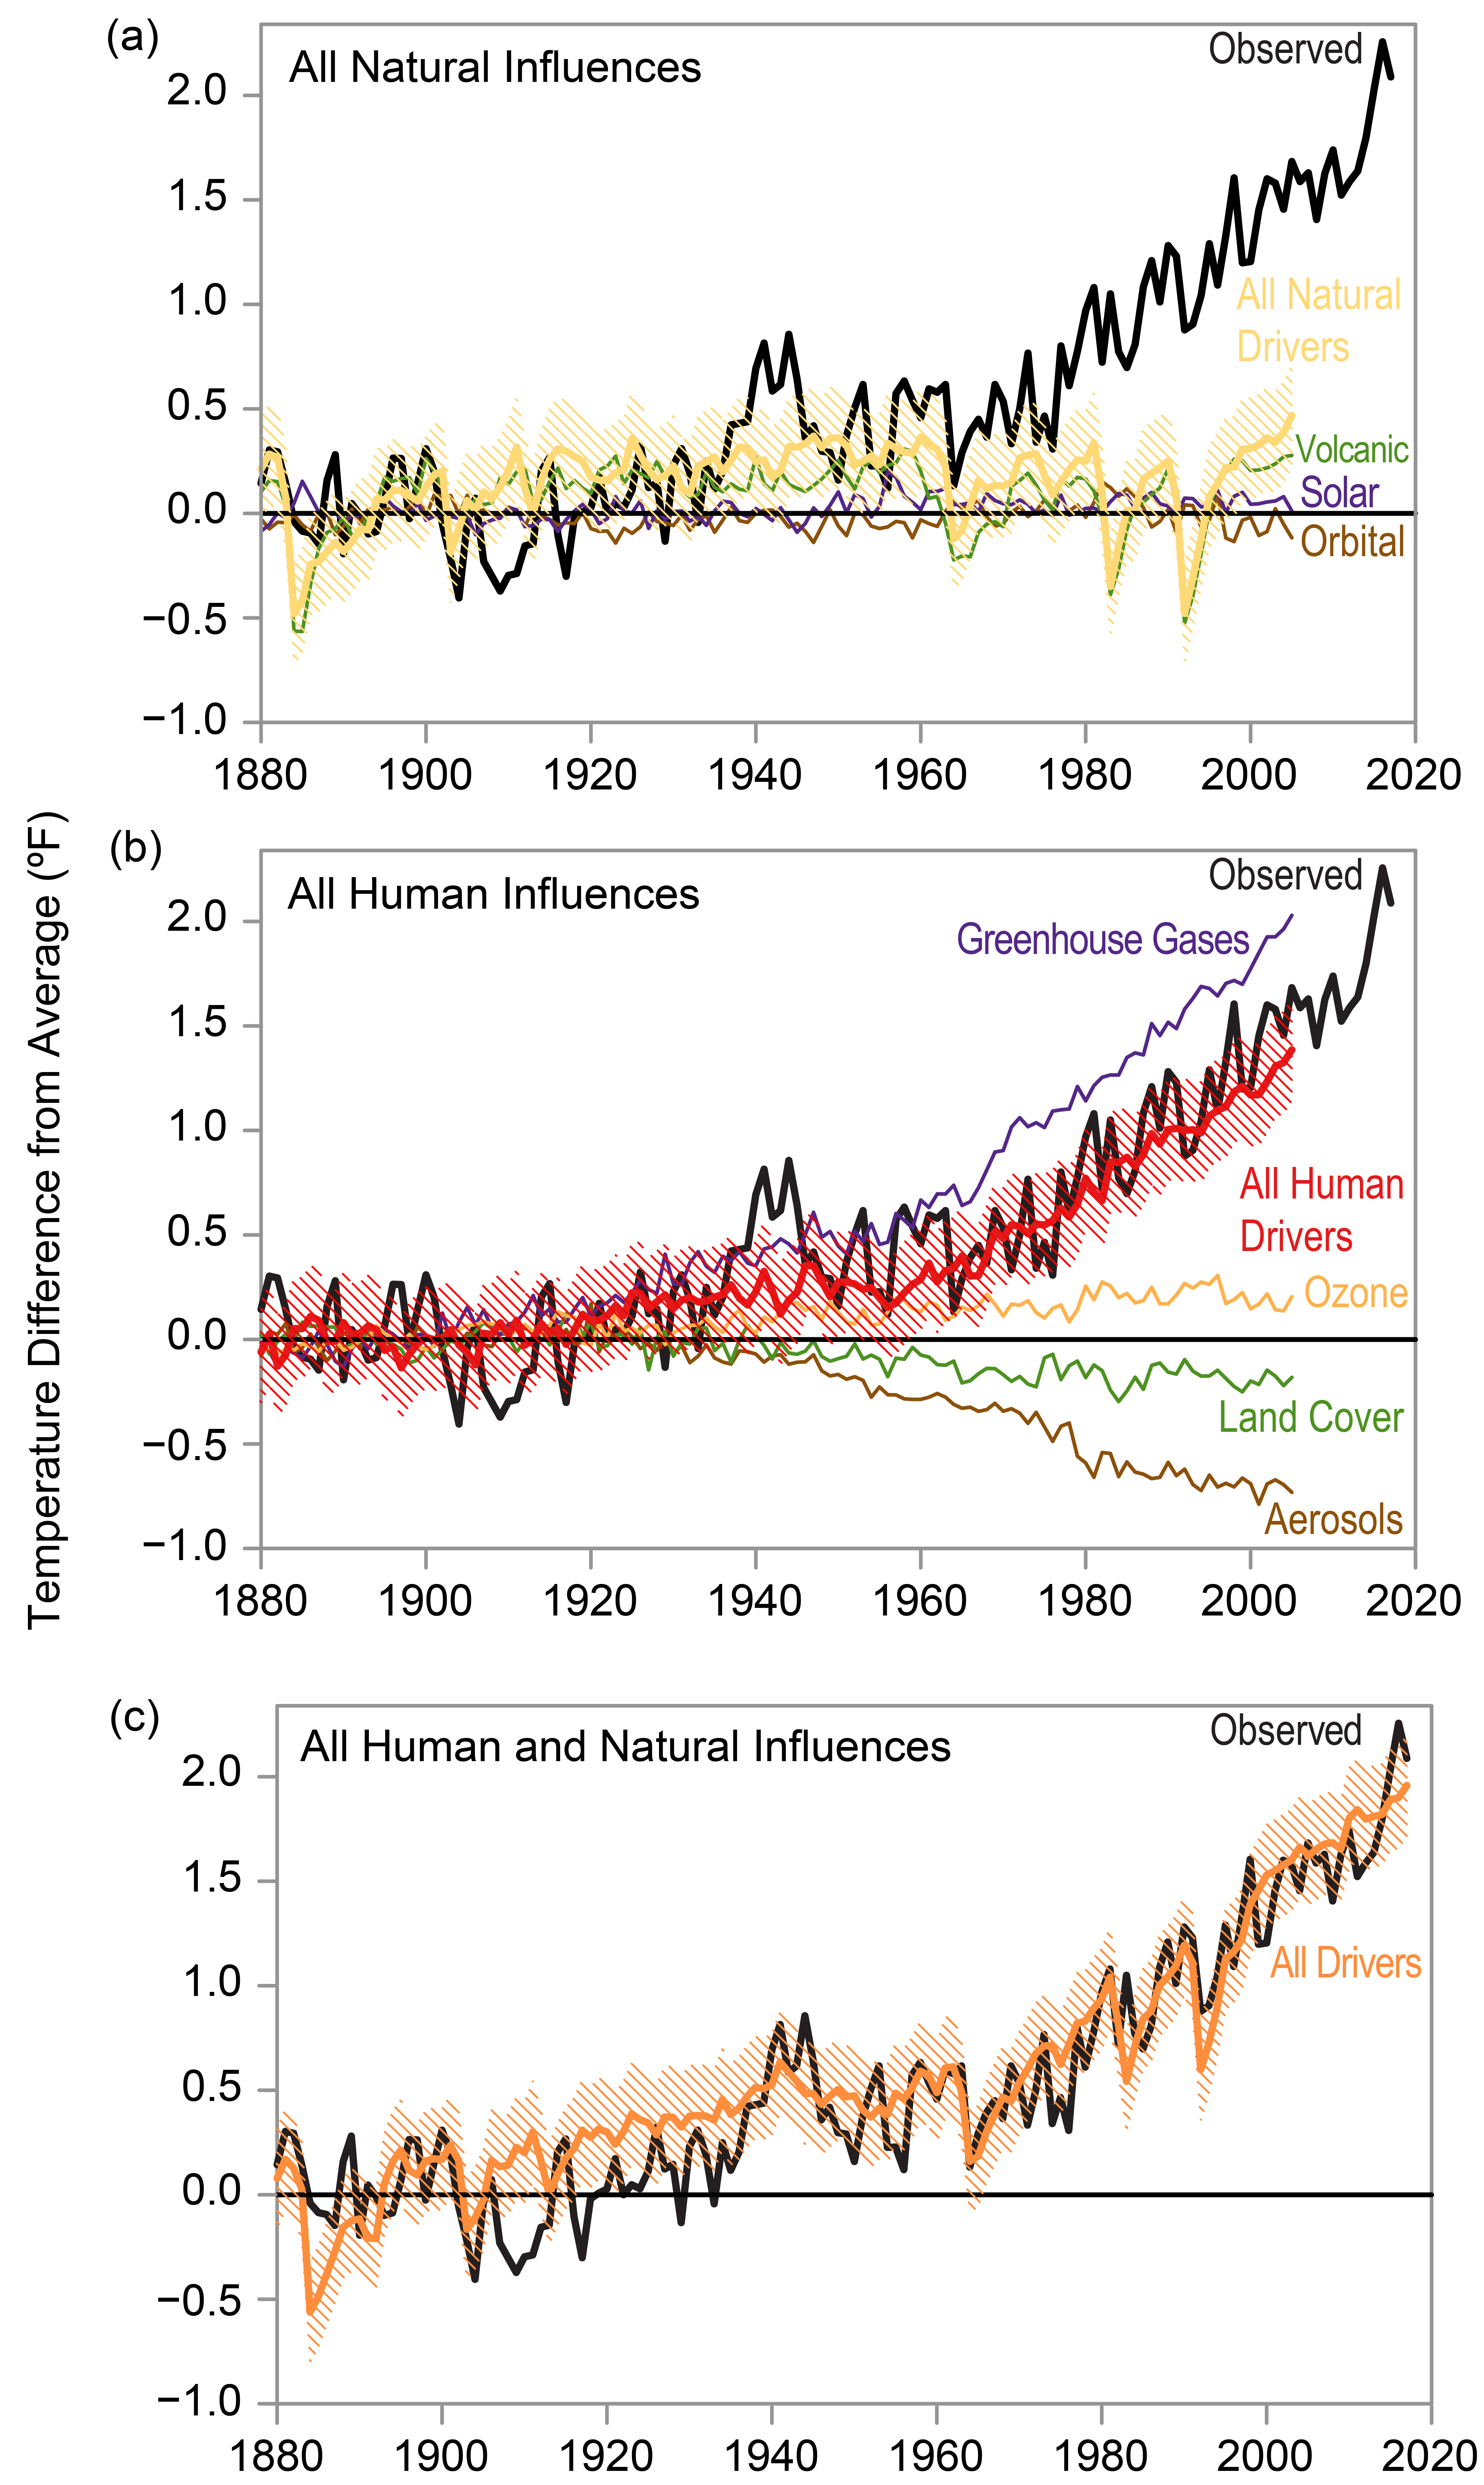
Look! Hockey Sticks!
Climate models are built to show a linear flat air temperature trend absent CO2, and to produce an air temperature rise with added CO2. Those plots mean literally nothing physical.
The air temperature trend since 1880 can be fit with a 60-year cycle imposed on the rising phase of a 234 cycle described in Lüdecke, et al., (2013).
Climate annual variability and transients are not fit. But the general trend in centennial air temperature is well-reproduced by these two natural cycles. No CO2 needed.
This is how to prove the “hockey stick” graph is at best misleading.
If you download the PAGES 12K metadata spreadsheet from NOAA you can use the hyperlinks to get each dataset. They open in Excel.
Then you can choose some of the high resolution sets and, with the help of some interpolation, calculate the standard deviation for any decade in the last 10000 years. It turns out to be circa 1C.
So we would expect a few decades somewhere between +1C and +2C every 1000 years.
Since records (proper measurements, not proxies) began we have seen a 1.5C rise however about half that is pulling out of the last cold era.
So we are well within normal limits.
The hockey stick is likely to be misinformation because our planet is not in thermodynamic equilibrium, so the climate is ALWAYS changing. A flat trend is more likely to be a figment of the imagination than reality.
Compose an essay to post here on WUWT, Chris. 🙂
The series of 30 articles is wrong.
I think eugenics was the greatest science fraud.
But climate change science fraud is still in progress,
and the fraud is getting worse, so it It could
reach number one on my scorecard.
The primary problem is wild guess predictions of climate doom.
The historical temperature :adjustments”, homogenation
and infilling of guessed data for surface grids with no data,
or missing data, are just SYMPTOMS of the main problem.
The main problem is starting with the conclusion
— the always wrong wild guess predictions
of climate doom.
Everything else (the junk science)
is done to support that conclusion.
Starting with a conclusion that never changes
means the data have to change.
It’s that simple.
A 12 year old child could understand this.
I hired a 12 year old child to explain it to me !
My problem is, what is the purpose of homogenizing? The only thing that comes to mind is that homogenizing is the only way to report an average global temperature. There is no way that we can know the average global temperature because the temperature is not being measured for the majority of the globe. So we just take the numbers we have mix them together and like magic we have an average global temperature. I know I have grossly over simplified this but in the end this is what is happening. I have more confidence in my description of what they do than the results they expect us to believe. I am only interested in raw data with a history of the site. If a site started in an open field with no unnatural influences but in the meantime is now surrounded by buildings with heating and cooling equipment nearby, paved roads, paved parking lots or what ever just let me know and I’ll figure out whether the readings make sense or not. In the meantime don’t lie to me, homogenizing is not truthful.
Spelling update: con-census
I recently discovered that Berkeley Earth records it temps with at least a 0.05C uncertainty – based on the resolution of instrument and not on random or systematic uncertainty.
Resolution is associated with repeatability and not with accuracy. Resolution does not determine uncertainty unless you assume all measurement devices are 100% accurate.
That’s how the justify using the standard deviation of sample means as the uncertainty in their products instead of the actual propagated uncertainty from each of the measurements.
How they get away with this is just beyond me.
Would you mind copying and quoting the relevant text regarding uncertainty from the data file so that the WUWT audience can see what Berkeley Earth actually said?
More whining.
I already did!
Fraud, and an audience that neither knows reality or cares.
Here is text that is included in the raw data files.
“measurement precision uncertainty.” always assumed to be random and averaged away.
Not word one about systematic measurement uncertainty due to uncontrolled environmental variables.
Let me make sure I’m understanding your argument here. Your criticism with the Berkeley Earth raw data files is that they don’t contain a discussion of uncertainty that is already available in their methods paper? Would your criticism be satisfactorily addressed if they had included the contents of their methods in each and every data file?
FWIW, they even say in that text that systematic uncertainty is handled in higher level products.
Also, isn’t this a little like the pot calling the kettle black? You insinuate that Berkeley Earth didn’t address systematic uncertainty (they did) while you never considered spatial and temporal sampling uncertainty, integer reporting uncertainty (which is σ = 0.29 for F or σ = 0.16 for F converted in C), the propagation of uncertainty through the gridding step, the propagation of uncertainty through the infilling step, and the propagation of uncertainty through the spatial averaging step, etc. some of things which have systematic influences.
Oh look, condescending bzx returns, replacing humble bzx.
They show temperature measurements in 1929 with a .05C uncertainty. Really? That’s not even the precision of the measuring devices in 1929! Where in Pete’s name did they come up with this value?
And *what* higher level products are they talking about? The ones where they use the standard deviation of the mean as the uncertainty?
“You insinuate that Berkeley Earth didn’t address systematic uncertainty (they did)”
Again, where did they do this? And how did they determine the systematic uncertainty of temperature measurements taken in 1929?
And you are complaining that because Dr Frank didn’t address *ALL* possible sources of uncertainty that his comment is somehow wrong? That’s the argumentative fallacy known as Poisoning the Well – dismissing an assertion by denigrating the sources of the assertion!
The error assessors at BEST are apparently all statisticians, Tim.
I doubt that any of them have ever made a measurement or considered that the true magnitudes of the published numbers are poorly constrained.
You got that right!
TG said: “They show temperature measurements in 1929 with a .05C uncertainty. Really?”
That appears to be the correct value for the reporting precision uncertainty.
TG said: “Where in Pete’s name did they come up with this value?”
I believe they are doing (0.5 * 5/9) / sqrt(N) where N is the number of observations. When N is 31 this comes out to (0.5 * 5/9) / sqrt(31) = 0.05.
TG said: “Again, where did they do this?”
Rhode et al. 2013.
TG said: “And you are complaining that because Dr Frank didn’t address *ALL* possible sources of uncertainty that his comment is somehow wrong?”
Not wrong. And not because *ALL* possible sources were not addressed. I’m just saying it is a little like the pot calling the kettle black because Pat is insinuating that BEST did not handle systematic uncertainty and because Pat himself completely ignores some of the most important aspects of the global average uncertainty which are influenced by systematic effects.
Hypocrite! These people get to divide by root-N but I don’t.
See the problem?
CM said: “These people get to divide by root-N but I don’t.
See the problem?”
No. I don’t see the problem. Especially since Bellman and I with support from your preferred text on the propagation of uncertainty have been trying to convince you that when you propagate uncertainty through a function that computes the average you have to divide by root-N.
Either way I’m hoping this means that your own source has finally convinced you.
An uncertainty of zero just because you made lots and lots of measurements?!??
You really think this is reality?
Not to mention that you are now running away from your vague claim about “correlation” having some (unknown) effect.
“That appears to be the correct value for the reporting precision uncertainty.”
So the uncertainty of measurements in 1929 is better than uncertainties for measurements in 2000?
993313 1 2000.875 -8.417 0.1021 24 -99
So the resolution of temp measurement stations in 2000 is HALF what it was in 1929?
How do you figure it is the correct value for 1929?
“I believe they are doing (0.5 * 5/9) / sqrt(N) where N is the number of observations. When N is 31 this comes out to (0.5 * 5/9) / sqrt(31) = 0.05.”
So they were doing fewer observations in 2000 than in 1929? Huh?
And, one more time, dividing by sqrt(N) only gives you an AVERAGE value for the individual measurement uncertainties. If you have 31 data elements then the final uncertainty for a month should be 31 * .05 = +/- 1C.
“Rhode et al. 2013.”
In other words not in a Berkeley data set? And did Rhode use Berkeley’s uncertainty as a base?
“I’m just saying it is a little like the pot calling the kettle black because Pat is insinuating that BEST did not handle systematic uncertainty and because Pat himself completely ignores some of the most important aspects of the global average uncertainty which are influenced by systematic effects.”
Pat wasn’t *trying* to address all uncertainty. He was only pointing out what the minimum uncertainty would be using only that one factor. Other uncertainties would only *add* to that value, it wouldn’t decrease it!
“Pat wasn’t *trying* to address all uncertainty. He was only pointing out what the minimum uncertainty would be using only that one factor.”
Thank-you Tim. I don’t know why that obvious point is so opaque to some.
You are a heretic to the CAGW crowd. Anything outside their bible doesn’t exist. There are none so blind as those willfully won’t see.
And yes, when the Feb. 2022 UAH update is posted in just a few days time, they will all be back, trotting out all the same baseless nutty ideas. This is willful blindness.
TG said: “993313 1 2000.875 -8.417 0.1021 24 -99″
That is saying the reports for that station during that month are to the nearest integer C. Notice that 0.1021 * sqrt(24) = ±0.5 C.
TG said: “So they were doing fewer observations in 2000 than in 1929? Huh?”
993313 was not providing reports in 1929. In addition it appears 993313 frequently misses observations even today.
TG said: “In other words not in a Berkeley data set? And did Rhode use Berkeley’s uncertainty as a base?”
I’m not sure what you’re trying to ask here. Rhode et al. 2013 documents the BEST dataset.
The record I provided shows they had 24 observations. The 1929 record doesn’t even show how how many observations they had, it just shows 99 (meaning unknown).
And you think that would double the uncertainty compared to an unknown number of observations in 1929?
“Berkeley Earth didn’t address systematic uncertainty (they did)”
They didn’t. They don’t.
PF said: “I doubt that any of them have ever made a measurement or considered that the true magnitudes of the published numbers are poorly constrained.”
I got a chuckle out of this since one of the assessors was Saul Perlmutter.
PF said: “They didn’t. They don’t.”
Let me make sure I’m understanding your criticism here. Are you saying the documentation and source code for processing the data are wrong and that BEST does not consider any systematic effects at all?
I’m saying BEST does not include systematic air temperature sensor measurement error.
Correct. Their record is inconsistent at best when it comes to uncertainty. Mostly it just looks to be biased because it is pure guesswork.
As Hubbard pointed out, you can’t correct for systematic uncertainty on a grouped basis. You have to do it station by station. There is no software *anywhere* that can accurately GUESS at the systematic uncertainty of measurements taken in 1929. The best you can do is use the resolution of the instruments at the time as a lower bound for the uncertainty involved. Any further estimates of uncertainty can only go UP from there, not down.
BTW, dividing uncertainty by the number of observations only gives you an AVERAGE uncertainty for each data element. The total uncertainty is still the sum of the uncertainties for each data element. Just as Bevington shows in his equation 3.13. If you have 30 observations then (σ_x)^2 is the SUM of the squares of the individual uncertainties, [(σ_u)^2 + (σ_v)^2 + …] It is *NOT*
[(σ_u)^2 + (σ_v)^2, …] / 30
The uncertainty of an average is just that, an average uncertainty. It is not total uncertainty. There is no way the total uncertainty of a monthly average in 1929 is 0.05C.
I don’t understand why you keep making this mistake. It’s been explained to you often enough you should have it memorized by now.
TG said: “The uncertainty of an average is just that, an average uncertainty.”
Nope. Let x = Σ[x_i, 1, N] / N and then do the propagation of σ_x_i through Bevington 3.14. Show your work. Be careful this time. Don’t make high school level math mistakes. Pat, same challenge. Prove me wrong!
I’ve already shown you that at least twice now. Why do you keep ignoring it?
Where do you find division by n in Bevington’s 3.14? I’ve attached a picture from his book. I don’t see “n” in a divisor anywhere.
Assuming the partial derivatives = 1;
(σ_total)^2 = (σ_u)^1 + (σ_v)^2 + ……..
I simply don’t see “n” in there any place. For at least the fourth time, calculating an average uncertainty is nothing more than mathematical masturbation. It is trying to equally distribute the total uncertainty (Bevington 3.14) across all data elements. In order to calculate the average uncertainty you had to know the total uncertainty already so what good does the average uncertainty do you?
TG said: “Assuming the partial derivatives = 1;”
That’s your problem. The partial derivative of the function x computing an average is 1/N.
TG said: “For at least the fourth time”
And for at least the 3rd time…stop making simple arithmetic mistakes. Slow down. Think about what you are doing. When you change one of the inputs of a function that computes the average by 1 unit the output changes by 1/N units. Convince yourself this true with a calculator if you need to. If you don’t know how to do partial derivatives then ask questions.
TG said: “In order to calculate the average uncertainty”
Nobody cares about the average uncertainty. What we care about is the uncertainty of the average. That is a completely different concept.
Here is the math using the Bevington style and notation.
Let
x = (u + v + …) / N
Therefore
∂x/∂u = 1/N
∂x/∂v = 1/N
Start with Bevington 3.14
σ_x^2 = σ_u^2*(∂x/∂u)^2 + σ_v^2*(∂x/∂v)^2 + …
Therefore
σ_x^2 = σ_u^2*(∂x/∂u)^2 + σ_v^2*(∂x/∂v)^2 + …
σ_x^2 = σ_u^2*(1/N)^2 + σ_v^2*(1/N)^2 + ..
σ_x^2 = (1/N)^2 * (σ_u^2 + σ_v^2 + …)
When .σ_u^2, σ_v^2, … all equal σ_uv then
σ_x^2 = (1/N)^2 * (σ_uv^2 * N)
σ_x^2 = (1/N) * σ_uv^2
σ_x^2 = σ_uv^2 / N
Which means that
σ_x = σ_uv / sqrt(N)
Unless N > 1000 points?
Your hole is still here.
It’s not even sqrt(N). The partial derivative is outside the square.
It is (σ_u)^2 * (∂x/∂u)
So what you wind up with is (σ_uv)^2 / n
It’s the uncertainty of the mean value, i.e. the uncertainty of one element in the data set, not the total uncertainty of the data set.
It is more than a little hypocritical for them to even talk about metrology statistics because generally as a whole, they ignore them completely until it is time to fit the Holy Trends. Take the UAH for example, what is never reported:
• number of points in the monthly averages for each grid location
• standard deviation/variance of same
• standard deviation/variance of the 30 y baseline avg
• standard deviation/variance of the monthly “anomalies”
• distributions of these averages
Statistics are pretty much restricted to comparisons of the line fits, which are all close to zero, so the numbers are always very small.
UAH claims a 0.3K overall uncertainty, but this seems to be based mostly on hand-waving even though the microwave-to-temperature conversion procedure is very complicated.
Note that Spencer rejected Pat Frank’s cloud UA model propagation paper with “errors can’t be this big, must be wrong”. Earlier in this thread Pat reported that he recently tried to talk about the 0.3K with Spencer, who didn’t see anything wrong and cut the conversation short.
“Pat reported that he recently tried to talk about the 0.3K with Spencer, who didn’t see anything wrong and cut the conversation short.”
That conversation was about 7 years ago, CM. It was I who stopped the conversation when Roy just shrugged off the uncertainty. As I understood it, his position was that the satellite ±0.3 C just averages away.
OK, thanks for the additional explanation.
“That’s your problem. The partial derivative of the function x computing an average is 1/N.”
So what?
x = (u + v)/2 = u/n + v/n
So σ_x is the uncertainty of the AVERAGE VALUE, i.e. the mean. The uncertainty of ONE VALUE, not the total uncertainty of all the values in the data set.
x IS THE AVERAGE VALUE of the data set.
So now you are going to find the uncertainty of the AVERAGE of the data set as:
(σ_x)^2 = (σ_u)^2/n + (σ_v)^2/n => [(σ_u)^2 + (σ_v)^2 ] / n
You have *STILL* done nothing but find the uncertainty of the mean, you haven’t found the total uncertainty!
In other words you have found the uncertainty of ONE VALUE, not the uncertainty of all values.
It is the total uncertainty that is of interest, not the uncertainty of one value in the data set (which may or may not actually exist)!
“Nobody cares about the average uncertainty. What we care about is the uncertainty of the average. That is a completely different concept.”
Why do you care about the uncertainty of the average?
It’s like the space shuttle o-ring example I gave you. If you run to your boss with the uncertainty of the average value saying it shows how the o-ring is safe to use then how does that make sure that the o-ring is safe to use? The safety risk is based on the variance of the uncertainty across the *entire* data set and not on the uncertainty of the mean!
Apparently the picture didn’t come through. Here is a second attempt.
TG said: “Apparently the picture didn’t come through. Here is a second attempt.”
Yep. Do you see the ∂x/∂u, ∂x/∂v, … terms in there?
Again, all you are doing is finding the uncertainty of the mean and not the total uncertainty of the entire data set.
Do you *want* to chance blowing up the space shuttle by using the uncertainty of the mean to evaluate risk?
U goes to zero as N goes to infinity.
You failed (again).
It’s just a matter of how quickly it goes to zero!
True this! Notice he no longer tries to refute this inconvenient little problem.
Why would I refute it? It is a fact that lim[σ / sqrt(N), N, infinity] = 0. That’s kind of the whole point. The more elements included in the average the less the uncertainty of that average will be.
So uncertainty can go to zero?
Clown show.
CM said: “So uncertainty can go to zero?”
No. It is not possible to collect and average an infinite number of measurements.
I used an example with 60 million points, which, according to your clown math, reduces a 0.5C uncertainty to 65uK! Faced with this absurdity, you pulled some nonsense out of your @ur momisugly$$ about “correlation” to hand-wave your way out.
Is this idiotic number close enough to zero for you mathematicians?
CM said: “you pulled some nonsense out of your [snip] about “correlation””
I got that from your preferred source the GUM. This is on page 11.
Exactly! Have you ever heard of “time series analysis”?
Look it up. Temperature is consistently mentioned as an appropriate subject.
FORGET HOW THE DATA IS COLLECTED!
Do you seriously think that a temperature uncertainty of 65uK is possible?
Yes or no:
CM said: “Do you seriously think that a temperature uncertainty of 65uK is possible?”
My answer is unchanged from the dozens (literally) we’ve discussed this.
It is an unequivocal NO.
The uncertainty on individual observations is about 0.3 C on the lower end (USCRN) and about 0.05 C for a monthly global average.
I question whether 65 uK is even possible in a laboratory environment.
Then you have a problem because this is exactly what your new math tells.
Your assertion is not based on laboratory conditions. It is based on the number of observations regardless of the uncertainty of each individual measurement.
This is why you see us say that according to your math, you can measure a 1 inch rod with a yardstick and if you do it a large number of times you can reduce the uncertainty to a very small number, say 1/1000ths of an inch.
Why? Some of the new mechanized systems can take a measurement every second. Over a years time, that’s pretty close to an infinite number. 31+ million!
First, 31 million is not even remotely the same thing as infinite. Second, as Bellman and I have been pointing out in practical applications correlations are usually > 0. I’m happy to discuss the concept with you, but an understanding of the ideal uncorrelated case is required before moving on to the more complex correlated case.
Here is a little something I ran across while studying time series analysis. Although it is a wiki it does have numerous references and is similar to things I have mentioned to you before.
It indicates that your use of standard error is of “no value” unless the temperature distribution is Gaussian. LOL
“”Many commonly used statistical formulae depend on the randomness assumption, the most common formula being the formula for determining the standard error of the sample mean:”
{\displaystyle s_{\bar {Y}}=s/{\sqrt {N}}}s_{{{\bar {Y}}}}=s/{\sqrt {N}}
s(sub-Ybar) = s / sqrt N
where s is the standard deviation of the data. Although heavily used, the results from using this formula are of no value unless the randomness assumption holds.””
https://en.m.wikipedia.org/wiki/Correlogram
“unless the temperature distribution is Gaussian. LOL”
Another fail! Just like his goofy ideas about heat transfer.
CM said: “Another fail! Just like his goofy ideas about heat transfer.”
I want to make sure there is no confusion here. These ideas concerning propagation of uncertainty and heat transfer are not my own. They are the product of the evolution of centuries of mathematical and scientific endeavor by those far smarter than I’ll ever be. If you have a concern with them then you need to demonstrate how mathematicians and scientists got so wrong for so long, how the application of the wrong work seemed to produce expected results, provide the corrected equations, publish your work for review, and assist people in replicating it so that it can be adopted worldwide. Until you do that I will continue to apply the rules for propagation of uncertainty and transfer heat the way they are documented and verified by established mathematical principals and scientific experimentation.
I grow weary of your trollish antics, if you don’t want to learn, not my problem.
The real concern is that one must understand not only the arithmetic functions of calculations, but also must know and meet all the assumptions and requirements that go along with applying the arithmetic calculations.
Both the GUM and Taylor and others require a “functional relationship” when combining uncertainties from different measurements. A functional relation ship is something like:
L · W · H = volume (a metric called volume)
P·V = n·R·T
L + L + L = total length
E = m·c^2
A “mean” of a set of data points does not define a functional relationship between the points. A “mean” is a statistical parameter. Note: A mean is a defined function in terms of math, but it does not define a value in terms of arriving at a relationship between the data points.
You can find a height if you know a volume, length, and width. You can find a Pressure if you know the other variables.
I’ll give you a mean and a data point and you can not calculate the remaining values. There is no relationship to use.
“If you have a concern with them then you need to demonstrate how mathematicians and scientists got so wrong for so long, how the application of the wrong work seemed to produce expected results, provide the corrected equations, publish your work for review, and assist people in replicating it so that it can be adopted worldwide.”
There is no problem with the theories of propagation of uncertainty and heat transfer. The problem is how they are interpreted. It is the failure to understand that multiple measurements of the same thing is not the same thing as multiple measurements of different things using different measurement devices. It is the failure to understand that random error that can cancel is not the only uncertainty that exists in measurements. It is the failure to understand that precision of the mean is not the same thing as uncertainty of the population mean. It is the failure to understand that anomalies do not cancel out uncertainty and, in fact, cause uncertainty to increase. It is the failure to understand that mid-range temperatures lose data like variance and range. It is the failure to understand that the average of multi-modal distributions like temperatures are pretty much unable to convey any information about the distribution of the data set. It is the failure to understand that the precision of a measuring device is not its uncertainty.
I could go on but it’s probably useless. Those who have blind faith in CAGW won’t listen. When I see studies from agricultural scientists contradicting those of the climate scientists I can only reach the conclusion that the climate studies have a problem. The ag scientist’s conclusion are driven by the need to be correct. Their conclusions directly affect the public immediately if they are wrong. Climate scientists, not so much! If their predictions don’t come true (and none have that I know of) its always sometime in future.
JG: “Here is a little something I ran across while studying time series analysis.”
Your source (like Taylor) is consistent with the fact that for random uncorrelated dataset the uncertainty of the mean is given by s / sqrt(N). Do you still accept your source?
You haven’t shown that your temperature distribution is random, i.e., has a Gaussian distribution.
As it states:
See the reference from the article:
1.3.3.1. Autocorrelation Plot (nist.gov)
You haven’t shown that the temperature distribution is uncorrelated. In fact, you claim anomalies are correlated sufficiently to allow homogenization and infilling. Which is it?
“Which is it?”
Which ever gives him the lowest numbers.
You don’t actually expect an answer, do you?
You are a perfect example of the saying that a little knowledge can be a dangerous thing.
That is not the point. The point is that using your interpretation the uncertainty COULD go to zero even when the individual components each have an individual uncertainty.
It is called Proof by Contradiction.
The assertion is that uncertainty can not be reduced.
You assert the negation that uncertainty can be reduced.
A contradiction to that negated assertion is found. You even posted the contradiction.
This means the original assertion must be true.
Uncertainty can NOT be reduced. reductio ad impossibile!
If you wish to refute the contradiction, then you must show where the limit is and how that limit is calculated.
The people who might have the background to challenge the behavior want it to be true, so they have little incentive to expose the inappropriate procedures.
Is you have many stations and lots of them have discontinuities due to changes there is a simple procedure for making an accurate curve.
1. Take first differences for each series.
2. Create a series based on the median for each point in time. (Discontinuities will have very little effect).
3. Integrate the median series to get an accurate temperature variation curve.
Is your split into urban and rural first you will get further useful results.
I’m not sure this will work quite the way you think. First differences only tell you if the relationship is linear. Temperature relationships across seasons are not linear, they go up and down, e.g. a non-stationary time series that are an approximate sine wave. The daily temperature profile is not linear, it is approximately a sine wave. The median for each point in time will, therefore, also vary across time. I’ll think about this some more, I’m just not sure you will get a valid “adjustment” factor from your process.