Reposted from Dr. Roy Spencer’s Blog
November 1st, 2021 by Roy W. Spencer, Ph. D.
The Version 6.0 global average lower tropospheric temperature (LT) anomaly for October, 2021 was +0.37 deg. C, up from the September, 2021 value of +0.25 deg. C.

The linear warming trend since January, 1979 is +0.14 C/decade (+0.12 C/decade over the global-averaged oceans, and +0.18 C/decade over global-averaged land).
Various regional LT departures from the 30-year (1991-2020) average for the last 22 months are:
YEAR MO GLOBE NHEM. SHEM. TROPIC USA48 ARCTIC AUST
2020 01  0.42  0.44  0.40  0.52  0.57 -0.22  0.41
2020 02  0.59  0.74  0.45  0.63  0.17 -0.27  0.20
2020 03  0.35  0.42  0.27  0.53  0.81 -0.95 -0.04
2020 04  0.26  0.26  0.25  0.35 -0.70  0.63  0.78
2020 05  0.42  0.43  0.41  0.53  0.07  0.84 -0.20
2020 06  0.30  0.29  0.30  0.31  0.26  0.54  0.97
2020 07  0.31  0.31  0.31  0.28  0.44  0.27  0.26
2020 08  0.30  0.34  0.26  0.45  0.35  0.30  0.24
2020 09  0.40  0.42  0.39  0.29  0.69  0.24  0.64
2020 10  0.38  0.53  0.22  0.24  0.86  0.95 -0.01
2020 11  0.40  0.52  0.27  0.17  1.45  1.09  1.28
2020 12  0.15  0.08  0.21 -0.07  0.29  0.44  0.13
2021 01  0.12  0.34 -0.09 -0.08  0.36  0.50 -0.52
2021 02  0.20  0.32  0.08 -0.14 -0.65  0.07 -0.27
2021 03 -0.01  0.13 -0.14 -0.29  0.59 -0.78 -0.79
2021 04 -0.05  0.05 -0.15 -0.28 -0.02  0.02  0.29
2021 05  0.08  0.14  0.03  0.06 -0.41 -0.04  0.02
2021 06 -0.01  0.31 -0.32 -0.14  1.44  0.63 -0.76
2021 07  0.20  0.33  0.07  0.13  0.58  0.43  0.80
2021 08  0.17  0.27  0.08  0.07  0.33  0.83 -0.02
2021 09  0.25  0.18  0.33  0.09  0.67  0.02  0.37
2021 10  0.37  0.46  0.27  0.33  0.84  0.63  0.06
The full UAH Global Temperature Report, along with the LT global gridpoint anomaly image for October, 2021 should be available within the next several days here.
The global and regional monthly anomalies for the various atmospheric layers we monitor should be available in the next few days at the following locations:
Lower Troposphere: http://vortex.nsstc.uah.edu/data/msu/v6.0/tlt/uahncdc_lt_6.0.txt
Mid-Troposphere: http://vortex.nsstc.uah.edu/data/msu/v6.0/tmt/uahncdc_mt_6.0.txt
Tropopause: http://vortex.nsstc.uah.edu/data/msu/v6.0/ttp/uahncdc_tp_6.0.txt
Lower Stratosphere: http://vortex.nsstc.uah.edu/data/msu/v6.0/tls/uahncdc_ls_6.0.txt
Every month so far this year has been cooler than last year, some by large amounts. Four months in 2021 recorded negative anomalies.
However October was the closest to 2020.
Two Las Niñas this year replaced El Niño of 2019-20.
UAH is driven by sunspot cycles, but not way you might expect /sc
http://www.vukcevic.co.uk/UAH-SSN.gif
Your site seems to be down.
Your browser may refuse to go to the website since doesn’t have current certificate. Website operator has changed number of times in recent years, I think that the current operator is Plusnet.
No, it’s a bit more fundamental than that. I can’t even get a DNS record for it
I had no problem seeing Vuks website
tonyb
No problems from here in the UK
(Gener8 browser)
For me it resolves to 212.159.9.151, 212.159.8.151 and works just fine.
Your site works for me Vuk, and so does your graph – impressive.
http://www.vukcevic.co.uk/UAH-SSN.gif
UAH LT temperature corresponds to a solar driver of global temperature, moderated by the 3-4 year period ENSO.
As I wrote in 2008 and later, this is why CO2 changes lag temperature changes by 1/4 of that ENSO cycle.
That observation is a disproof of the CAGW hypothesis, because temperature changes lead CO2 changes in time, and the future (CO2 changes) cannot cause the past (temperature changes).
Busy this morning, got to run.
Best, Allan
Hi Alan
Interesting. I just did spectral analysis and shows that (for all three sets of data :global, land & ocean) the principal component is 44 months.
But where this (3.7 years) periodicity comes from?
It may well be second harmonic of one of LOD’s components, which apparently is due to the rotations of the Earth’s liquid core (7.4 years). The right hand graph is taken from a AGU lecture by Andrew Jackson, one of the foremost scientist on Geomagnetism
https://youtu.be/1SOSmHPTods?list=RDCMUCAmvZawnAXogfsrXWKpPTVw&t=1416
(note his graph shows peak at about 7.5 years but (probably erroneously) he says 6 years.
Hi Vuk,
Please see Section 7 of my June 2019 paper and Table 7b:
https://wattsupwiththat.com/2019/06/15/co2-global-warming-climate-and-energy-2/
The ENSO period averages between 3 and 4 years, but is variable – I estimated averaging 3.6 years pre-2003.5 and 2.5 years post-2003.5.
The lag of CO2 changes after temperature changes is 1/4 cycle – the calculus relationship between an integral and its derivative, due to the close correlation of atmospheric dCO2/dt and atmospheric LT temperature here:.
https://www.woodfortrees.org/plot/esrl-co2/from:1979/mean:12/derivative/plot/uah6/from:1979/scale:0.18/offset:0.17
Why is the period 3-4 years? I have not attempted to determine that – enjoy!
Best, Allan
“Why is the period 3-4 years? I have not attempted to determine that -”
That is because ENSO is typically solar energy related and the solar minimum lasts around that time as well as the solar maximum.
Trade winds tend to be higher during high solar activity periods and lower during low solar activity periods. This causes an opposite ocean surface and atmospheric temperature affect, typical of just one of the many negative feedback mechanisms.
This means the pattern repeats in a 3-4 year ENSO duration with ocean cooling at depth in low solar activity and ocean warming at depth in high solar activity.
has henrik svensmark seen that?
La Nina is locked-in – very cold in ~4 months from ~Oct 1, 2021.
Major deviations of the Polar Vortex starting anytime.


CO2, GLOBAL WARMING, CLIMATE AND ENERGY
by Allan M.R. MacRae, B.A.Sc., M.Eng., June 15, 2019
https://wattsupwiththat.com/2019/06/15/co2-global-warming-climate-and-energy-2/
[excerpts]
This formula works reasonably well back to 1982, which is the limit of my data availability.
5. UAH LT Global Temperatures can be predicted ~4 months in the future with just two parameters:
UAHLT (+4 months) = 0.2*Nino34Anomaly + 0.15 – 5*SatoGlobalAerosolOpticalDepth (Figs. 5a and 5b)
6. The sequence is Nino34 Area SST warms, seawater evaporates, Tropical atmospheric humidity increases, Tropical atmospheric temperature warms, Global atmospheric temperature warms, atmospheric CO2 increases (Figs.6a and 6b).
in the middle of back to back la ninas, no less
And just what is the actual anomaly baseline temperature?
Is it not mentioned because everybody has a different value for GMST?
IPCC/WMO say 288 K, 15 C.
K-T diagram says 289 K, 16 C.
UCLA Diviner mission says 294 K, 21 C.
Hadcrut 4 says 286.97 K, 13.97 C.
RSS, NOAA/GISS, Berkley Earth, UAH, Cowtan & Way, JAXA don’t make it obvious.
Non-consensus = non-sencus.
The variation across data sets gives some insight into the real magnitude of the absolute errors, probably plus or minus a degree or two, not one one hundredth of a degree, like Hadcrut 4 falsely insinuates. Laughable.
meab, you pretty much hit the nail on the head. I would estimate 3 – % of full scale. Let’s say 0.04 * 15 = 0.6 degrees of uncertainty and I would really expect something more than that. But 286.97, no way.
If you .6 degrees of uncertainty, would that not cover the minimum and maximum of the graph presented?
It would. That is exactly what uncertainty is, an interval within which you can not rely on any measurement being the true value. A 286.37 is just as likely as 287.57. 286 ±0.6 or even 287 ± 0.5 or something like those would be much more believable. 286.97 leads one to believe that you can measure atmospheric temperature to the 1/1000th decimal place, e.g., 286.97 ± 0.005. I would like to see evidence that this is not just from simple calculations without significant digit use. I will admit I’m not a satellite expert, nor instrument specialist on what they are actually measuring, but even so, that kind of precision seems doubtful.
Dr. Christy and Dr. Spencer say that the uncertainty of UAH-TLT annual anomalies is 2σ = 0.1 K and the uncertainty of the trend is 2σ = 0.06 K.decade-1. See Christy and Spencer 2000 for details.
Implausibly small.
In an update for version 5.0 they say the uncertainty of UAH-TLT annual anomalies is 2σ = 0.15 K and the uncertainty on the trend is 2σ = 0.05 K.decade-1. See Christy and Spencer 2003 for details.
Anyone who is familiar with performing serious temperature measurements will tell you these numbers are way too small, except for national laboratory-level calibrations.
The title of this article is “Error Estimates of Version 5.0 of MSU–AMSU Bulk Atmospheric Temperatures” — once again, error is not uncertainty. Skimming through, these numbers seem to be nothing but standard deviations (“standard error of the slope”).
This is nowhere close to being a serious uncertainty analysis, a subject about which I suspect the authors are completely unfamiliar.
I keep asking, but have you taken your concerns to Dr Spencer? He has an active comment section on his blog and I’m sure would be interested in corrections to his uncertainty analysis.
I’m sure Spencer would be thrilled trying to explain why he, Christy, Norris, Braswell, and Parker divide uncertainties by √N when propagating through an upscale average. He’d surely be double thrilled trying to explain the √(N/Neff) adjustment as well.
You are still pushing the same tired dog, not worth my time to go through it all, again.
These numbers are NOT uncertainty.
Look, I’ve tried to explain this before and you obviously did not understand. The relationship between a population and a mean of sample means is:
SEM = SD/√N
You have two choices with your data,
1) you can declare you distribution as an entire population or
2) you can call it a single sample of a larger population.
There are no other choices.
If you declare it an entire population, the the standard deviation is calculated as usual with the formula,
σ = √[Σ(X – µ)² / n]
You then have the Standard Deviation of the population and dividing again by √N will give you the SEM which is little use since you already have the population SD.
The SEM is only useful when you are sampling a population with a sample size and numerous samples. You can then take the SEM (which is the standard deviation of the sample means) and calculate the SD of the population you have sampled. The SEM is really an interval within which is the uncertainty of what the population mean actually is. It has nothing to do with precision of the means value.
Now if you declare the data you have is a sample. Then it probably is a sample of size of the number of stations you have. Let’s say 2500 stations each with a sample size of 12, e.g., 12 months per year. So you now have 2500 sample means, with a sample size of 12. You can now calculate the SEM. That formula is:
SEM = √[Σ(x – x(bar))² / (n-1)
Now what do you do? The mean of the sample means should be close to the population mean. You can also calculate the Standard Deviation of the population (SD) by:
SD = SEM * √N
Note however that N = sample size which in this case would be
N = 365.
Now you could claim that all the data is one sample but again the SD of the population would be:
SD = SEM * √2500
Let me reiterate. Dividing the population by the √N is a meaningless figure. Declaring the data a sample means you MULTIPLY the SEM by the sample size that you declare.
There are other requirements of sampling that probably won’t be met such as each sample being representative of the population. You might want to read this.
<a href="http:// ” target=”_blank”> <https://www.scribbr.com/statistics/standard-error/>
‘Cannot find requested page’. Is it just me?
Try
https://www.scribbr.com/statistics/standard-error/
“Now you could claim that all the data is one sample but again the SD of the population would be:
SD = SEM * √2500 ”
I kept asking Tim last month, but are you saying that you would prefer the uncertainty of the mean to be expressed as the standard deviation of the population?
I ask, becasue there are some times when that makes sense, because you need to know how much individual elements will deviate from the mean. But I think using standard deviation of the global population when talking about the uncertainty of the mean temperature does not make sense here.
“Declaring the data a sample means you MULTIPLY the SEM by the sample size that you declare.”
But then what’s this? Did you mean to say multiply by the sample size, or should that have been the square root of the sample size? I’d assume it was just a mistake, but this seems to keep cropping up starting with the original 100 thermometer quote.
Multiplying SEM by sample size will not give you the standard deviation of the sample, it will give you the standard error of the sum of all samples. Hence the claim that uncertainty increases with sample size.
Corrections? There is no analysis to correct.
To be clear, you are saying that UAH is inaccurate and that Dr Spencer is failing to provide the necessary analysis?
Do you think this is due to ignorance or dishonesty?
YASM — yet another strawman
Did you read the paper? Of course you didn’t.
It’s a question. You can agree or disagree, do you think UAH is inaccurate? Do you think a monthly uncertainty of at least 0.7, roughly equivalent to the entire range of monthly values over the last 40 years, makes the data accurate or inaccurate?
You still have no clue about the difference between error and uncertainty is do you?
No one is saying it is in error. They number may be calculated extremely well. The problem is that it is quite likely within the uncertainty interval of the measurement system or the algorithm that is used to make the metric.
What we are saying is that we have sufficient experience with measuring devices to suspect that the precision shown may be overstated and that the possible spread of possible values is considerably larger.
Dr. Spencer’s site does not have sufficient information on how uncertainty has been dealt with so it is difficult to analyze.
And you still don;t seem to understand how uncertainty is related to error. Error does not mean a mistake.
The problem with the claim that UAH monthly data has an uncertainty of at least 0.7°C is that it makes the data set pretty useless. Especially when looking at monthly data. The entire range of monthly values lies between ±0.7°C, so it’s impossible to be sure if any month is warmer than any other. By the way, it would help if you or Monte specified what sort of uncertainty the 0.7°C represented. Is it the standard uncertainty, or a 95% confidence interval, or what?
It’s bizarre that I seem to be the only one defending UAH, when I’m usually having to point out it isn’t perfect, but I really cannot see how the uncertainty could be that large and yet the data be so consistent both with itself, and other data sets.
For example, comparing the difference between monthly UAH and HadCRUT 4 anomalies, both set to the 1991-2020 base period, the biggest difference is 0.46 and most are a lot less. The average difference is 0.11°C. Very difficult to see how there could be that much agreement if at least one of the data sets had an uncertainty of 0.7°C.
Are you for real??
And I told you exactly where the 0.7C number came from, yet it didn’t sink in.
And no, I didn’t bother to differentiate between combined and expanded uncertainty in my back-of-the-envelope.
How is your satellite temperature measurement uncertainty analysis coming along?
I’m not interested in whether it’s combined or expanded. What I’m not sure is if it’s meant to be a 1 sigma, a 2 sigma or whatever.
You ignore the part of my comment where I compare UAH monthly values against HadCRUT. Could you explain how if the uncertainty of UAH is 0.7°C or higher, there has never been a difference that high in over 500 observations, and the average difference is only about 0.1°C?
As far as I can tell your back of the envelope estimate is based on the assumption that the absolute monthly mean will have an uncertainty of 0.5°C, and the base period monthly uncertainty is also 0.5°C. Both seem too large to me, just looking at it empirically. But, in addition, the uncertainties in the base period are irrelevant when looking at the trend, as they will be constant throughout.
As I keep saying, I’m not trying to defend Dr Spencer or UAH. Spencer’s had many articles here I think are rubbish, including ones that ignore all uncertainties. And I don’t think UAH is more trustworthy than any other data set, on the contrary. But the issue with UAH is not how uncertain the monthly the values are. It’s whether there is some systematic bias that is resulting in the lower trend rate. Or, if it’s correct if there is a systematic bias in other data sets making them warm too quickly.
Yet another indication that you fail to understand even the basics of expressing uncertainty.
Well the GUM says you should avoid using ±0.7 when it is a combined uncertainty. As I understand it, and I certainly don;t have your expertise, that would mean you are saying 0.7 is the standard uncertainty,corresponding to 1 standard deviation. Which would mean you expect almost a third of monthly measurements to be out by more than 0.7°C.
Expanded/combined has very little to do with 1 or 2 s.d. because the PDF is generally unknown. The standard expansion factor is 2 and many people believe this gives 95% coverage, but it really doesn’t. But you are correct, using +/- notation means it is an expanded uncertainty.
I did the same comparison with HadCRUTv5, GISTEMP, BEST, and ERA. Out of 3072 comparison’s the differences between them fell into a normal distribution with σ = 0.053 C and with the maximum difference only being 0.20 C. That implies an individual uncertainty of σ = sqrt(0.053^2 / 2) = 0.037 C which is consistent with the uncertainties published these datasets and inconsistent with claims that it is actually ±0.50 even assuming that is 2σ.
Uncertainty is not related errors. Errors mean you have readings that are not equal to the true value. Uncertainty means you may have a reading that equals the true value but you can never know for sure because the reading is inside the uncertainty interval where any reading is possible.
Every reading you take has uncertainty associated with it, even when you are using the same measurand and same device. That is why uncertainty adds. Consecutive readings can show the same but may be wrong and you’ll never know it.
Uncertainty is what you don’t know and can never know!
An example is a micrometer with a ratchet stop. That is a device like a clutch that is to slip when a certain pressure is applied to the screw to help obtain repeatable measurements. However one can never be sure that the clutch operates exactly the same on each and every measurement. That means there is an uncertainty interval on each and every measurement. There are other things that can change or be slightly different such as are anvils aligned exactly the same for each measurement.
Another example of uncertainty is using a ruler. Are you sure the beginning mark is exactly centered on the edge being measured? That’s not error, it is uncertainty.
Errors have two classes, one is random, and one is systematic. Random errors are amenable to statistical analysis but even then, each measurement also has an uncertainty with it. Systematic error are constant and are not amenable to statistical analysis.
The GUM specifies that uncertainty can be shown by standard deviation. And yes, this would include unresolved random errors and the actual measurement uncertainty. Unresolved random errors are a contributing factor to uncertainty
This is where Significant Digit Rules also enter the picture. They help identify repeatability and resolution. If you measure something to the units digit, you can not be sure of the next 1/10ths digit. That is uncertainty. The next person who uses your measurement can be sure that if his reading to the units digits matches yours, then they have done it correctly. However if you average several readings and get an answer that is far beyond the resolution of your measuring device, say to 1/1000th and then publish it, you are stating that you know what a repeated resolution should be. Anyone trying to repeat the reading will need a much more expensive device and pay for lots of calibration yet never be able to duplicate your result.
From: http://www.chemistry.wustl.edu/~coursedev/Online%20tutorials/SigFigs.htm
Does an uncertainty make something unusable? Maybe. If you are looking a something that has no quantity outside the uncertainty interval, it means the quantity could really be anything inside the interval. Statistically, it would not be significant.
I could go on but this is all stuff learned in metrology and you should really study it.
All you say seems to be talking about error. You measure something, there is a value that may or may not be true value, the difference between the measured value and the true one is the error. The uncertainty is an estimate of how big the error could be.
I’m really not sure why there is this reluctance to accept that uncertainty is derived from error. The book by Taylor I keep being urged to read is called “An Introduction To Error Analysis.” Subtitled “The Study of Uncertainty in Physical Measurements”
Section .1.1 is called “Errors as Uncertainties”, and concludes that “For now, error is used exclusively in the sense of uncertainty, and the two words are used interchangeably.”
“Uncertainty is what you don’t know and can never know!”
I think that’s backwards. You can k.now the uncertainty, you don;t know what the error is. Section 1.3 of Taylor is called “Importance of Knowing the Uncertainties“
This is older terminology that was superseded by the GUM standard, which clearly delineates the difference.
Then maybe people shouldn’t have spent so much time insisting I had to understand everything Taylor and Bevington wrote.
As far as I can tell the GUM usses a lot of terminology to “decouple” the concept of uncertainty and error, but then go on to say that you will get exactly the same result whether you use their definitions or the old ones. As far as I can tell it’s a distinction of language not fact. You cannot use the uncertainty is not error to justify uncertainty values that have no relation to the likely error.
An exact quantity (c):
https://physics.nist.gov/cgi-bin/cuu/Value?c
One with uncertainty (G gravitation constant):
https://physics.nist.gov/cgi-bin/cuu/Value?bg
The exact value of G is unknown, and these figures represent the best available information. Uncertainty is given without +/- notation so this is ‘u’, not ‘U’. This number (0.000 15 x 10-11 m3 kg-1 s-2) can be seen as the amount of ‘fuzziness’ associated with the value of G. It is very much akin to looking through an unfocused optical microscope. Turning the knob can improve the image but there is always a limit to how much.
You do it if it is so important to you.
It’s not remotely important to me. As with Monckton I’m happy to accept for the sake of argument UAH is a reasonably accurate data set.
I’m pretty sure they say the uncertainty of the mean is an interval of +/- 0.1 K. That is not uncertainty in the measurements. It also doesn’t show the standard deviation of the population of data points distribution used to calculate the mean. If you have a mean, you must also have a distribution to get it, even if its only two numbers. You simply can not judge how well the mean represents a distribution without a variance.
Plus they also apparently smooth the monthly data prior calculating the regression fit, again throwing variance information away.
“And just what is the actual anomaly baseline temperature?”
There isn’t one. Anomalies are calculated individually at stations, and the average anomaly is published. Indices have no dealings with average global temperature.
But for UAH it would be about 250K.
-23 C?
Their weighting function peaks around 4 km and there is a bit more contribution above 4 km than below so their mean absolute temperature will be pretty low.
This link gives the RSS LTL. The average is close to 270K. I expect UAH LTL is much the same but cannot recall if I have actually found that data:
http://climexp.knmi.nl/data/irss_tlt_0-360E_-90-90N_n.png
That is exactly why a GAT has no meaning. You can not simply add the anomaly to any existing temperature because that would mean everywhere on earth is doing the same thing. We know that is far from true.
The fact that the GAT is an anomaly implicitly means that there must also be a common baseline. The fact that no energy has been spent to calculate it doesn’t mean that it doesn’t exist. Your comment is a cop out to keep from admitting that you either don’t want to calculate one or that you don’t want to disclose it.
I will also point out that your definition of average of averages leaves out some important statistical parameters that I can find nowhere. If you are going to keep promoting GAT as meaningful then you need to begin showing the variance or standard deviation, skewness, and kurtosis of the distributions used to calculate the GAT. An average of 2 to 20000 numbers all have these parameters that explain how well the calculated mean represents the distribution.
That’s the great thing about using anomaly temperatures./sarc
If you use absolute temperatures then the errors accumulate until the whole thing, and Nick Stokes’ comments, become manifestly ridiculous to everyone.
The absolute global average temperature for the various climate models vary over a range of 3 degrees. If you take the Chinese FGOALS model then it will be late next century before it even catches up to where the EU MIROC model is now.
There is broad consensus for CO2 causing temperature increase because any model that produces decreasing temperature is weeded out and the group defunded. So the increase is essentially guaranteed but there is no consensus on the current temperature and no reliable way to measure it.
The whole exercise is based on a fairy tale about the “greenhouse effect” – absolute pure bunkum. Oceans have retained a little more heat as the water cycle is slowing down due to the Earth’s orbital precession taking perihelion progressively later than the austral summer solstice reducing ocean evaporation. No climate model has predicted the downward trend in the global river run-off because the models have no connection with the real world they are based on a fantasy of how Earth’s energy balance is achieved.
The running, centered 13-month average (red line in the graph) has not been updated for at least nine months.
Dr. Spencer noticed the omission last month and stated (as of 2 October) that it would be added “when I’m back in the office.”
https://www.drroyspencer.com/2021/10/uah-global-temperature-update-for-september-2021-0-25-deg-c/#comment-891510
Since then, nothing has happened. What gives?
I show +0.173 C for the 13m centered mean if that helps.
That’s what I get, too, and it looks centered to me.
It looks up to date to me. It’s centered, so the last point will be 6 months ago.
And the Chicoms continue to add CO2….
Naughty Chicoms. But wait, don’t you add more CO2 than the average Chinese?
Aren’t you the person who said man didn’t land on the moon?
I am pro CO2 and I hope we emit as much as possible so everyone can enjoy prosperity.
Wait, so you’re actually pro-Chicom?
I am pro human and believe they the Chinese have a right to a better life with fossil fuels. I am totally against authoritarians like Xi, Putan, Biden…..and people like you who are anti human.
Did they teach reading comprehension at whatever school you went to?
Because the only other possible alternative is glaciers that eventually scrape everything off the surface down to Topeka. The irony is that us “deniers” would prefer that the pseudoscience were actually real.
Not the rich ones, maybe the ones whose organs are being harvested.
Actually, I don’t know an “average Chinese”, nor do I know how much CO2 an “average Chinese” prefers to emit. Do you?
Do I care if someone somewhere emits more than me? Nope. But there are surely many who emit many times more than me but wish to impose restrictions on me and others, for example. Those people are dangerous because they will abuse the power of government to do it.
Does the average Chinese want China to become America? Doesn’t seem like it to me, as they prefer a dictator-style government, which is inherently evil. Did the Soviets in the USSR emit the same amount of CO2 as Americans? Ummm, no.
So, I’ll live my life the way I wish, and they can live their lives how they wish. How’s that for a bargain? I’ll worry more about their evil government and those wishing to emulate that evil here on my soil.
If CO2 was going to kill us all as you keep claiming, then why does it matter who is producing the CO2?
The fact that you give China a pass to produce as much CO2 as they want just proves it was never about CO2.
What’s an average Chinese? Use middle class and rich Chinese and you’ll find they add the same CO2 as the middle class American.
Well it’s pretty cold in a lot of China and they’re a bit short of heating and they’ve heard on the grapevine a CO2 atmospheric blanket will keep them warm. Why wouldn’t they with Big Gummint?
And the relevance of that statement to my comment is?
They emit more and more C02 and your graphs barely rise. I think your correlation and causation is a tad off 😉
These averagers treat the UAH numbers as if they come out of NIST or PTB in Germany—they didn’t, not even close.
They come from the University of Alabama in Huntsville, hence the name. I’m not sure if that makes them more or less reliable in your mind.
Go read the paper, there is nothing in it about uncertainty.
What paper? What has it to do with the 13 month moving average, or where UAH comes from?
So you didn’t read the thread, not surprised. Here:
https://wattsupwiththat.com/2021/11/03/uah-global-temperature-update-for-october-20210-37-deg-c/#comment-3380420
He is not paid to read
Ah yeah, silly me.
Silly me, for assuming you were sticking to the subject of this thread.
I have not read any of the papers listed in the thread. For one thing they are referring to older versions of UAH. If you remember people here disliked version 5 of UAH because it showed too much warming (Monckton used RSS to get his pause as long as possible) but now version 6 is the gold standard as it shows less warming and the later version of RSS is regarded as fraudulent.
People here have also gone from insisting that satellite data was near perfect, and calling anyone who questioned it a “satellite d-word” to throwing even UAH out of the pram if it shows a single warm month.
personally I have no intention of trying to get into the minutia of how satellite temperature reconstructions work, or how uncertainty is calculated. I’m happy to use the data as is, whilst accepting it isn’t perfect.
This is obvious from your ignorant comments.
Yep. It’s a running-centred 13-month average; so the last datum point is April 2021 and it covers the period from October 2020 to October 2021 (inc). The value is +0.17C, as shown on Dr Spencer’s chart.
We have past the peak, and are now beginning the downward phase of the AMO. I expect it to get harder and harder to maintain the fiction of a heating globe over the next several years…
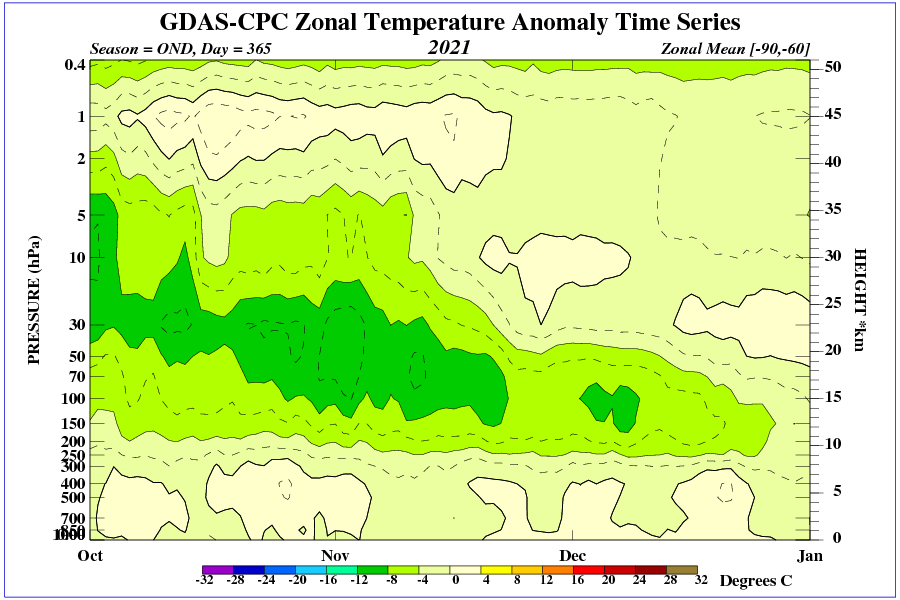
Pity that the Antarctic does not get a mention, given its significance.
It does figure in global averages, although satellites can’t record above 80 degrees.
One reason the supposed hottest month evah! of July 2021 wasn’t is due to record breaking cold in Antarctica.
I would like to know where temps where above average for October. I want to import some of the excess heat to my region.
The UAH gridded data is here. It looks like the Arctic Archipelago is the hotspot last month.
2m (?) temps
http://ocean.dmi.dk/arctic/plots/meanTarchive/meanT_2021.png
Lower Troposphere. Maybe peaking around 700mb’ish.
UAH LTL is not well correlated with surface temperature at any point in time. Give it about 26 days to respond. That is the lag between surface temperature and response at altitude. Could be somewhat faster response at the poles. of
RickWill
” UAH LTL is not well correlated with surface temperature at any point in time. Give it about 26 days to respond. ”
Sure sure?
UAH land correlates pretty good with land stations (but… with the raw raw data of the GHCN daily data set, maybe less with homogenized and infilled data).
I’ll manage to process HadISST1 SST’s 1 degree grid data.
Then I will compare that in anomaly form with UAH oceans, combine it with the anomalies of the GHCN stations and finally compare that .with UAH Globe.
We then will see what remains of your claim.
Of course I agree, as always: there is few possibility to compare weather and climate patterns in the LT with those at the surface.
But their departures from a common mean may nonetheless correlate.
Maybe not all ocean grids are created equal if some cool spots are headed to the sub Arctic.
Would the turning down of the long cycle AMO create persistently cool grid cells rather than random shifts elsewhere?
I’m not sure. I’ve not studied the AMO enough to make any statements in that regard.
Third warmest October in UAH record. Down 0.01°C from last October and 0.10°C from the warmest October set in 2017.
Seems very likely that 2021 will be warmer than 2018, the last La Niña year. Which will make it the 8th warmest in the 43 years of UAH history. It might just beat 2015, to make it the 7th warmest.
The “pause” now starts in March 2015, making it one month shorter than it was last month.
I’m glad that you accept that there’s been no warming for six and a half years
If you carefully choose the start point to be just before the big El Niño, and end on a La Niña, then yes, you can find a brief meaningless flat trend line. Saying this means there’s been no warming over this period is more dubious. For a start the uncertainty of the trend is huge, suggesting that the zero trend is just due to chance events, such as the El Niño at the start. It also ignores the jump in temperatures you need to get to the start of the trend line.
You can cherry pick a start date that gives you a zero trend, you can just as easily choose a start date that gives you a much faster rate of warming. For instance, the trend since January 2011 has been 0.40°C / decade. If you have to accept there’s been no warming for the last six and a half years you also have to accept there’s been rapid warming for the last ten years and ten months.
Personally, I prefer to assume there’s has been no change in the underlying rate of warming until the evidence suggests a significant change one way or the other.
In February 2022, Earth will have been cooling for six years.
How does the consensus explain that fact, under constantly increasing CO2?
Also, please explain Arctic sea ice extant flat since 2007 and rising since 2012.
Thanks!
Not sure why you want to wait for next year. You could already say the Earth has been cooling for the last si years. Since November 2015 the UAH trend is cooling at the rate of 0.20°C / decade. It’s just as meaningless figure as any of the other short term trends.
The “consensus” will explain it the same way it explains every meaningless six year trend. You’re measuring noise. Here’s a graph showing every six year trend. (It’s only going up to April, so doesn’t show the current negative trends.)
There have been positive trends over 1.0°C / decade, and negative ones as low as 0.5°C / decade.
First, it is not noise, it is indicative of the variance in climate if anything. Noise has to be an extraneous interference that appears to be the same as the phenomena you are examining. You are trying to say temperature averages are noise to temperature averages. That makes no sense.
Second, the GHG theory requires an increasing CO2 to raise temperatures and raise humidity level. If rising CO2 doesn’t raise temperatures then there is not a direct correlation between the two. That means natural variation is at work and not CO2. The fact that natural variation can even perhaps “hide” CO2 warming also means that natural variation has a greater impact than CO2. That is death to the GHG theory being the phenomena that controls the temperature.
Third, the fact that the models do not have random occurances of temperatures being flat for periods of time is a salient point that the models have the wrong physics in their calculations. The models show ever increasing temps without bound based on CO2 ppm growth. We know that isn’t the way the earth works because of the temperatures remaining flat for periods of time even while CO2 growth remains.
I suspect we are just talking about different sorts of noise here. By noise I mean the error term.
“If rising CO2 doesn’t raise temperatures then there is not a direct correlation between the two.”
But you haven’t established that temperatures are not rising, that’s the problem. Natural variability can mask out a an ongoing rising trend, when you look at a short time scale. But that does not mean you have established there is no correlation between CO2 and temperatures. If, say, CO2 causes 0.2°C in a decade, but a natural event caused a temporary 0.5°C warming in one year, and another event caused a 0.4°C drop 10 years later, then without the CO warming you would see a 0.9°C cooling over that decade, but with CO2 warming you still see a 0.7°C cooling.
“The fact that natural variation can even perhaps “hide” CO2 warming also means that natural variation has a greater impact than CO2.”
Greater impact in the short term, but not in the longer term.
You have not shown that CO2 is a control knob. Where are the pauses where warming stops even in the face of rising CO2? Why do they happen? Scientists are more interested in trying to find reasons why CO2 is a control knob rather than finding out why pauses occur and what causes them.
You keep talking about uncertainty, but then don’t want to follow that logic when looking at short term trends. A short term trend is very uncertain, it’s impossible tell what the underlying trend is because there’s too much variability in the data. Why try to figure out why the trend over the last seven years is flat when the uncertainty is far greater the the overall trend? Should scientist investigate why the trend over the last 10 years has been more than double the overall trend?
The point about describing CO2 as the control knob, is that CO is causing long term fixed warming. Other changes are transient. An El Niño might make one year very warm, but temperatures will fall back once it’s over. What increased CO does is to change the equilibrium temperature. If I set my thermostat to 18°C, I expect the room to settle at that temperature. Opening a window might cause a sudden drop in temperature but the temperature should go back up to 18.
And you keep failing at understanding anything about the subject, yet keep making ignorant proclamations.
And you just keep making one line meaningless insults.
If you can’t explain whys pauses occur, then neither can you assert that CO2 causes constantly rising temperatures, The excuse that natural variation can mask or hide underlying warming is a straw man with no evidence supporting it.
A recent study surmises that cloud reduction has caused the latest spate of warming and not increased CO2. Are you declaring it wrong because you have proof (not correlation) CO2 is one and only cause?
Where is the water feedback that CO2 is supposed to have caused? Why is Antarctica still as cold as ever? Why is sea ice expanding again? More and more CO2 should be causing these, why aren’t they happening? Why don’t you plot those against CO2 and see what kind of correlation you get?
The dedicated satellite record began at the end of decades of cold.
The trend is flat from the interwar warm interval.
John Tillman
I understand what you mean… but you keep fixated on the September months, usually deepest point in the melting season
2012 9 3.57
2020 9 3.92
2007 9 4.27
2019 9 4.32
2016 9 4.51
2011 9 4.56
2015 9 4.62
2008 9 4.69
2018 9 4.71
2017 9 4.80
while
*
2012 for example is known to everybody as the year with the highest melting, but is less known as the year with the highest recovery since many years:
(This graph will be updated next week.)
*
Would you look at yearly averages combining the two phases instead, you then would see the following:
2016 10.16
2020 10.18
2019 10.21
2018 10.35
2017 10.40
2012 10.42
2007 10.50
2011 10.51
2015 10.59
2010 10.73
But… no doubt at all that 2021’s year average will be a good bit higher than 2020 and 2019.
No doubt whatsoever.
Pretty much how the whole warming thing was sold for decades based on charts starting in 1985 eh???
Or we reference “pre-industrial” temperatures as the Little Ice Age??
It’s not that Bellman is against cherry picking. It’s just that he’s got to find some excuse to ignore that data that disagrees with what he is paid to support.
“Paid to support” again. Ha! You really mustn’t put so much faith in Monckton’s ad hominems.
“Personally, I prefer to assume there’s has been no change in the underlying rate of warming until the evidence suggests a significant change one way or the other.”
An utterly pragmatic, and absolutely sensible position to take.
Back during the “Great Pause” which eventually went 18+ years, I liked to update my plots as soon as the data came out. Eventually one commenter here pointed out that the atmospheric data set and the trends within are *long term* things. The commenter chided me for making a fuss over long term trends every single month. I had to admit that the commenter had a point.
“Personally, I prefer to assume there’s has been no change in the underlying rate of warming until the evidence suggests a significant change one way or the other.”
That would be the warming that started back around 1850 and has continued at basically the same rate ever since, regardless of what CO2 has been doing.
Checking HadCRUT 4 data.
Trend since 1850 is 0.05 ± 0.01°C / decade. Trend since 1950 is 0.12 ± 0.02°C / decade. Trend since 1970 is 0.17 ± 0.02°C / decade.
The trend from 1850 to 1950 is 0.03 ± 0.01°C / decade.
I can see some evidence that the trend has not been basically the same since 1850.
How can a trend be established for the 19th century (much less these tiny supposed errors) when measurement uncertainty for an instrument (in ideal circumstances) then was at least +/- 0.5 degrees F? In real life it would have been closer to +/- 1 degree. You can’t average away this imprecision.
And how can you establish trends to this level of precision when instruments were highly concentrated in just North America and Western Europe? There were hardly any systematic measures taken in the whole Southern Hemisphere before the early 1900s.
As a psychometric statistician (my PhD is in decision-making) I just can’t get a handle on the levels of precision reported in climate science – used for data that clearly has, even now, very high variance.
Hip Hip Hurrah! Well said and another sceptic with a cogent critique. Welcome!
As a climastrologer, Bellman believes that performing the mystical “anomaly” incantation, all inconvenient little details such as these disappear leaving one with the Holy Trendline with milli-Kelvin uncertainty.
The anomalies are as stated by UAH, not Bellman.
But they are quoted by Bellman without him recognizing the limitations they have.
What would you have me say? “According to UAH the trend is 0.13 ± 0.05°C / decade, but can we trust UAH to get their sums right, and it’s all just data taking from satellites which keep going wrong, and they don;t even measure proper temperature, just guess it up from microwaves!”
Everyone here uses UAH and occasionally other data sets, without having to justify the accuracy of the data. Why do you think it’s only a problem when I do it.
Monckton uses UAH data to claim a precise trend over six years, with no mention of uncertainty, and he gets a regular guest spot here. I point out the trend has uncertainties, and spend the net few days being attacked for not understanding how Monckton calculates his pause.
Again you fail to understand why he does so.
Oh, I think I understand why he does so alright. He’s said on occasions that it is simply a political tool intended to impress those who don’t understand statistics.
No. The warmunists put great stock in ever-increasing CO2 causes ever-increasing temperature rises.
By pointing out evidence this is not the case, their theories deflate.
CMoB does not dispute any warming is happening, but rather that the amount is mild and beneficial.
The exact causes of this warming remain unknown.
I was attacked for using UAH data without accepting the limitations of the data, which apparently includes not working out all the uncertainties by hand. Monckton uses the same data with no mention of uncertainties, especially regarding the uncertainties of a trend line over a few years, but that’s OK because you think it is evidence that increasing CO2 is not causing warming. Is that what you are saying? He’s giving evidence to deflate the “warmunists” theory’s so uncertainty doesn’t matter?
Same issue with the assertion that the UAH rate of warming is mild and beneficial. When I showed gave a graph of UAH data with a significant trend, you told me I had to put massive uncertainty bars on each month, that the trend could be anywhere within the uncertainty bars, and that it would be nonsense to project it to the end of the century (something I hadn’t done).
But if Lors Monckton says the trend is mild, that can be accepted without qualification. No silly uncertainty bars on each month, no sensible look at the uncertainty in the trend, and an implied assption that this trend will continue and so won’t cause non beneficial warming on the future.
What Jim said…another duh.
As an idiot, Carlo, Monte, likes to invent new words and make stuff up about people who disagree with him.
I do not think using anomalies rather than absolute temperatures, removes all problems with sampling, nor do they improve the precision of individual temperature readings. What I do think is that they help to reduce problems caused by imperfect sampling.
The figures I quoted for the trend, taken from the Skeptical Science Trend Calculator, gave uncertainties across the 170 years of HadCRUT data of 0.01°C / decade. (The actual uoted figure was 0.006°C, but I know how people here dislike too many decimal places.), that amounts to an uncertainty of 0.1°C across the entire range. That is not a milli-Kelvin uncertainty. Is it a useful figure? Not really because as I was trying to point out, the temperature rise has not been linear.
However, the certainty of the trend has little to do with the uncertainty of the monthly figures, but much more to do with there being 170 years worth of data.
Have you figured out the differences between error and uncertainty yet?
My understanding is that uncertainty is an estimate of the likely range of error. If I take a measurement and say the uncertainty is 1mm I am saying I expect the error to be more likely to be 1mm or less, and very likely to be within 2mm. 1mm is the uncertainty, the error might be 0.1mm or 1.5mm, but we don’t know what it is, hence the uncertainty.
That’s my understanding as well. And based on extensive google searching this understanding is consistent with how most people use the terms. I will say that Christy and Spencer seem to have used the term “errors” (plural) in the place of “uncertainty”.
Both the books I keep being urged to read, by Taylor and Bevington, are on Error Analysis, and describe uncertainty as a measurement of error.
Again, this is old terminology. The GUM has the current terminology for these metrology terms.
The GUM says that the definition of “uncertainty” is not inconsistent with “a measure of the possible error in the estimated value of the measurand as provided by the result of a measurement” and “an estimate characterizing the range of values within which the true value of a measurand lies”. It appears that Bellman and I’s usage of the term uncertainty is not inconsistent with anything that the GUM says. When I say “uncertainty” I’m talking about the range of values in which the error can be expected to exist. I’m probably guilty of occasionally adopting the term “errors” (plural) for “uncertainty” as others seem to do as well, but I do try to stay consistent and stick with “uncertainty” as best I can. Anyway, it is clear that Christy and Spencer’s estimates of what they call “errors” is not inconsistent with the GUM’s definition of “uncertainty”.
And they are both wrong as it does not adhere to the GUM standard. That 2003 paper has nothing in it about real metrology, instead they try to validate by comparisons against radiosonde data.
No. It is not a measure of error. Instead it is a measure of what you don’t know about a measurement result. A lab makes a certain measurement and attaches an uncertainty value with it which represents their best information about the fuzziness of the number.
Forget trying to think about error, it is causing you endless confusion.
What does fuzziness mean, if not that the result will have a possible error? How do you calculate the fuzziness apart from understanding what the possible range of errors is?
The GUM might have redefined uncertainty, but you still use the same calculations.
That uncertainty value is their expectation of the error. And when you add/subtract that value from the measurement you get the range in which the true value is expected to be. The GUM does not challenge that definition and usage of the term “uncertainty”. In fact, the GUM even says in no uncertain terms (the pun was intended) that this interpretation and usage is not unacceptable.
Satellite data doesn’t use thermometers to obtain temperature data. The precision in the trends is purely mathematical, not based on instruments.
Yet they are based upon measurements with an uncertainty that should be propagated. Granted that much of the precision is not based upon actual measurements but rather mathematical calculation.
She was replying to my comment on HadCRUT, not satellite data.
Welcome to the merry dance. Someone tells me something about a particular data set, I check and find they are wrong, then everyone attacks me for using the same data.
In this case MarkW claims “that would be the warming that started back around 1850 and has continued at basically the same rate ever since”
I show that the trend has not been basically the same since 1850, and am told I can’t look at trends starting in 1850. It’s true, I wouldn’t put too much reliance on data from then, but then how does MarkW know it started warming around then and the trend has been more or less constant since then?
“You can’t average away this imprecision.”
That’s been very much the interminable debate that’s been raging here the last 6 months. I say the mean of multiple measurements is more precise than a single measurement, others inist that the mean becomes less precise. For reference, the argument started when Tim Goran claimed that if you average 100 thermometer readings each with a measurement uncertainty of 0.5°C, the uncertainty of the mean would be 5°C.
What keeps getting lost in the arguments, is that the uncertainty for the measurements is much smaller than the uncertainty from taking a random sample, and that in case, global temperature reconstructions aren’t based on random samples, and there are much more complicated sources of uncertainty.
However, back to your point – it is my contention that a mean of multiple measurements can be more precise than the precision of any single measurement. If my thermometer only measures temperature to the nearest degree, does that mean the annual temperature based on 365 readings can still only be known to the nearest degree?
Just stop now while far behind, all you are doing is digging the hole you are in deeper.
Sorry, are you now claiming that measurement uncertainty will be bigger than the sampling uncertainty. If I take 100 measurements from random places around the earth, each with a measurement uncertainty of 0.5, but with readings that vary by 10-20°C, do you think the measurement uncertainty will have more of an impact than the uncertainty caused by the randomness of the locations?
Each individual temperature measurement will have its own uncertainty (fuzziness) attached to it and they should not be assumed to be all identical without justification. A real analysis of a given measurement result must take all intermediate value and measurements into account. This is why UA is not an easy subject.
What you describe is a great illustration of just why the global average temperature has very little meaning.
It was a hypothetical question in which the known uncertainties of each thermometer is 0.5°C. I’m not asking for a detailed analysis, I’m asking if you think the measurement uncertainties are greater than uncertainties from sampling across a diverse range of temperatures.
Global average temperature is a meaningless number.
It’s an opinion. Not one shared by the majority of scientists or scientific institutes.
They will begin to share this opinion as nations begin to push them for information pertinent to their immediate area in order to minimize their mitigation costs. They will be forced to admit that there are a large number that are on the less warming side of the average. People aren’t going to accept that everywhere on earth is going to warm a similar amount.
That is why I am starting to require a standard deviation be quoted with an average. We need to begin giving people information so they can judge how well the “mean” represents the range of the temperature distribution.
HadCRUT4 and NOAA have always published 2 sigma SD with every monthly update.
Look at their accuracy uncertainty. Now tell me how you can get better resolution!
https://www.ncei.noaa.gov/pub/data/uscrn/documentation/program/X034FullDocD0Sig.pdf
“Climate Reference Network (CRN) ”
“Test and Evaluation Master Plan”
“January 2003 ”
±0.3 calibration uncertainty!
I tried to demonstrate to bellman the huge variance one gets from averaging a single month of one-minute temperature data (for a single site) and posted the histogram—the s.d. was on the order of 10C. He failed to see the significance and rejected it without a thought.
You didn’t demonstrate anything. You just asserted that the uncertainty of the monthly mean derived from minute readings could be 10°C.
I didn;t reject without a thought, I thought about it and decided it was insane. If each reading is accurate to 0.5°C then there is no way the average could be wrong by 10°C. I said I didn’t think you could assume that all errors would be independent, but at worst the average error could only be 0.5°C.
So go on, tell me uncertainty has nothing to do with error. But then explain what you think uncertainty means, if it’s 10, when the maximum possible error is 0.5.
So what does that amount of variance indicate instead?
Stop thinking about error and true values.
So, no attempt to justify the claim that your thermometer might give you an error of 10°C, or if you prefer a monthly average that has a fuzziness of 10°C.
Back to the strawmen, I see. Exactly when did I make this claim?
Exactly never.
What does a 10C standard deviation mean to you?
It would be a lot easier to avoid accidental strawmen if you didn’t talk in riddles. You said,
“I tried to demonstrate to bellman the huge variance one gets from averaging a single month of one-minute temperature data (for a single site) and posted the histogram—the s.d. was on the order of 10C.”
I took, the huge variance in averaging to mean the variation in the average. If you meant the sample variance than why talk about averaging. Yes maybe the standard deviation of the samples is 10°C. So what? That says nothing about the uncertainty of the average, apart from dividing by the square root of the sample size to get the SEM, which as I said would be inappropriate in this case.
You are not taking random samples here, the only inaccuracy in the mean would be from any changes occurring between each minute, which I would expect to be very small, and any errors in the reading. Or fuzzyness in the readings if you prefer.
The standard deviation of the sample might be useful if I want to know how likely a random minute is to the average, but it doesn’t tell me how fuzzy the average is.
So, what do you think the uncertainty of the mean is? And what do you think the significance of the 10°C sd is?
If you are not taking samples, then the only other option is that you have the entire population. The Standard Error of the Sample Mean has no meaning when you have the entire population.
My god man, do you not understand what sampling is for? It is when you can not obtain the full population and so must take samples to gather “statistics” that are used to make an estimate of the population Mean and Standard Deviation.
The formula is:
SEM = SD / √N
where “N” is the sample size (not the total number number of samples)
Rearranging this gives:
SD = SEM ∙ √N
If you already have the population, why would you calculate an SEM? It makes no sense.
Lastly, if I have 10 samples whose average is 72 using significant digits, I can still calculate the sample mean and an SEM. However, the SEM is not an accuracy figure, it is merely the interval within which the mean will lay. IT DOES NOT indicate that the accuracy of the sample mean is 72 ± SEM. It is a statistic that describes how well the sample mean estimates the parameter of the population mean. You need to read up and learn about parameters and statistics. I have given a link to this before if you need one.
Operative word being random. SEM assumes the samples are random and independent. This isn’t the case when taking regular samples from a time series. At this resolution we are practically getting close to the population mean.
However, you still have the uncertainty of individual measurements. Each reading is a sample from the range of possible measurement errors, or the fuzziness of the measurement. If all these errors were independent the impact would be negligible owing to the large sample size, but as I said I doubt they would be independent so you cannot use SEM. But the mean measurement uncertainty cannot be greater than the individual uncertainty.
As to your last point, I’m not sure what you think accuracy of the mean is, if not “a statistic that describes how well the sample mean estimates the parameter of the population mean.” .
Here for the record is what you said originally
http://wattsupwiththat.com/2021/09/15/all-5-global-temperature-measurement-systems-reject-noaas-july-2021-hottest-month-ever-alarmist-hype/#comment-3347512
Which contradicts nothing I’ve written here, so what?
You still can’t answer the questions.
The so what is, that you appear to be saying that you can take minute by minute readings over a month, using a thermometer with a stated uncertainty of 0.5°C, and get an average for that month with an uncertainty of at least 7.4°C. I would like you to confirm that is what you are saying, and if it is explain where that extra uncertainty comes from.
I’m not sure what sort of answer you looking for as to what a standard deviation of 10°C mean to me. It’s a measure of the amount of dispersion of all temperatures across the month. It’s the square root of the variance (100), which is the average of the squares of the deviation from the mean of each minutes recording.
As to the question about what the mean value indicates, that’s the sum of or the minute values divided by the number of minutes in the month. It’s a statistical parameter indication the average temperature during the month. It’s difficult to say what else it might indicate without more context. Do you want to compare it with a different month, or a different location? Do you want to test if temperatures have been getting warmer over time? Do you want to know if that month was typical or unusual for that location?
I find it funny how these alarmists consider a time frame that starts at today and counts backwards as being cherry picking.
Then again, they have no actual science, so they got to grab onto something.
They certainly love to yammer about subjects for which they have little or no understanding.
If you wanted to cherry pick a start date that gave you the longest possible non-positive trend how would you do it? And how would you be able to tell the difference between that method and the one Monckton uses?
“Stop whining” — CMoB
If you’ll answer the question.
If CO2 is driving the global climate, so far it is obeying the law of diminishing returns as would be expected:

Not sure how accurate your values from GHCN-Daily are. Nor do I know where you got Mauna Loa values below 300ppm.
Here’s my comparison of HadCRUT global, verses CO2 since 1959.
Nice plot. Your X axis ranges 8.3 – 8.7.
What is it?
I used the wrong graph. That one is showing the log of CO2, but it makes little difference at this scale. Here’s the one against CO2 ppm.
So CO2 is your control knobby?
”I used the wrong graph. ”
Yes, you should’ve used this one….
Simplistic ignorance.
NV at play in the form of ENSO.
This is the correlation causation ….

La Ninas
Why those on here pray for them.
Banton! Where is your “insolation” graph?
Not relevant to debunk the motivated ignorance displayed.
It is relevant below.
Enjoy!
Where you deftly demonstrated your total ignorance about solar radiation…good job!
Your graph seems to imply that a rise in CO2 of less than 10% should result in around 1.5°C warming. That would mean a very alarming climate sensitivity.
Really? This is your interpretation?
There’s a green line showing a short period of UAH data, and a red line showing CO2 levels over the same period. As they are measured in different units, I assume there is some reason for the scaling used, or else why plot them on the same graph? I assume the point being made is that CO2 has shot up between 2000 and 2015, but UAH didn’t. But it’s meaningless and misleading if you scale the CO2 in a way that doesn’t indicate the expected warming.
How do you interpret it?
“expected warming” — circular reasoning.
Here’s my version of your graph, with the CO2 scaled to get the best fit over the entire range.
And here’s the same showing the entire UAH set.
Id be really interested, to see the adjustments plotted against the same graph
Good luck.
And yet CO2 keeps rising despite the pause…when will this warming kick into high gear?
Winter is almost starting
What pause? The normal ‘new pause’ poster is noticeably absent this month. Perhaps because he would need to pick (yet another) start date and even then it would leave his pause 1 month shorter than it was last month!
Just give it up, you aren’t impressing anyone.
I guess we will experience a pause in the pause-discovering activity of Monckton. A true “Monckton pause” at last.
Lol…CO2 keeps rising and your stupid graphs aren’t complying 😉
Mmm, no, a relentless decade on decade rise is not complying.
At first I thought all the butt-hurt was just caused by yet another rise on the graph but no, it seems the last hope – Roy Spencer, yes even Roy, must be lying about it too. How sad and lonely you guys are. Maybe Crystal Balls MacRae can chime in with a revised cooling forecast to cheer you up.
Lol….your religion is coming to an end. C02 is life.
Sorry, no relentless rise in the record. It’s been going up, down and sideways.
Notice how the troll now likes Lord Monckton’s methods, now that a single month has caused a change that it likes.
If “troll” is referring to me, I regard it a libelous to say I “like”” Lord Monckton’s methods. I think his methods are almost always bad, and his “pause” ones are statistically inept. I only mention the shortening of the pause this month as a statement of fact. It’s not remotely relevant to how meaningful his trend is, and I expect the pause will grow longer once the next La Niña takes effect.
Reply to nyolci November 4, 2021 9:03 am
Try again…
Nyolci replied to me, MarkW replied to Nyolci referring to the troll. This could either mean he’s referring to Nyolci as a troll in the third person, or is talking to Nyolci about me as a troll. Given that neither of us said we like Monckton, either is possible.
Maybe you should have set another strawman afire instead.
Looks like it’s cooling as it’s not warmer
So I guess that is bad
Or good
Too hard to tell anymore
You acknowledge the “pause” then?
This tedious old game again.
What do you mean by “the pause”?
I kept asking during the last time, and rarely got a meaningful answer, which is the point. By allowing “the pause” to be anything you wish it to be, you can use the old Motte-and-Bailey fallacy; get some one to “acknowledge” a weak meaningless definition, then claim that that means they agree with the strongest possible definition.
So, if say I acknowledge the trivially true claim that the trend over a short period of time is less than zero, and this is then taken to mean I accept the idea that there has been no warming for over six years that completely disproves the the notion that rising CO can warm the atmosphere, and who knows what else.
The fact that the alarmists have to start quoting monthly figures is just further proof that they know that the game is almost up.
Climate is very noisy. The shorter the time period being quoted, the noisier the data gets.
The fact that one month jumps a lot is utterly meaningless, but it’s all Bellman has, so he has to pump it for all he’s worth. (Which isn’t much)
Plus, these UAH graphs are not climate!
By alarmist do you mean Watts Up With That, which publishes the monthly UAH figure every month?
And now you’ve noticed how noisy monthly UAH is are you beginning to understand the problem of claiming a 7 year pause?
I’m making no particular point about the October anomaly, anymore than about the preceding cooler months. I suspect temperatures will be down over the net few months and the pause will lengthen again, at which point feel free to criticize me every time I point it out.
And in other news, bellman still doesn’t get it.
And as so often, Carlo thinks that a line put down is better than actually explaining what it is I’m meant to get.
Both Tim Gorman and Jim Gorman have gone to great lengths and spent significant amounts of personal time trying to educate you, and you reject everything they give out-of-hand.
Why should I bother?
March, April and June 2021 recorded negative anomalies.
Indeed, they were much discussed at the time.
That reads a lot like journalism majors from my experience with reporter/editor mentality in story writing.
You forget to mention that we also know from Loeb et al 2021 and Dübal/Vahrenholt 2021 that the most likely reason we have warmed is an increase in solar energy reaching the surface (reduced clouds). Or, did you expect the planet to cool when it’s receiving more energy?
Give them time: PDO, La Ninas, and AMO
We need another 2 C warming to get back to the Holocene Climatic Optimum level.
In that case you will need to tilt the Earth a tad to achieve the forcing that caused it …..
Even burning fossil fuels won’t do that.
Typed too soon, I knew you couldn’t resist…so are you ever going to answer the question about what “insolation” this is supposed to represent?
I doubt it.
Sorry, I didn’t think it was possible to not understand.
Insolation (Solar energy absorbed).
Summer (err, summer)
65 deg north (absorbed at, err, 65 deg North)
Reason: varying orbital characteristics of the Earth around the Sun (in this case tilt).
Significance:
Polar ice sheets extending south in NH landmasses at last glacial melted due increase of (above).
65 deg north is the Earth latitude of greatest landmass.
Ergo: That land absorbs and warms the atmosphere more efficiently than ocean (SH).
Result: (once ice sheets melted) – the HCO.
Slow decline in high lat. summer insolation since then.
I guess you fail to understand that Watts per square meter of solar radiation (i.e. insolation) can be or is:
Direct
Hemispherical, horizontal or tilted
Diffuse
Altitude dependent
Once again, Banton proves that he isn’t as smart as he thinks he is.
This of course will not prevent him from pumping the same graph again and again in the future (perhaps I should have used an ‘i’ here).
Obfuscating ignorant bollocks…..
https://en.wikipedia.org/wiki/Solar_irradiance
So if your hallowed graph is really AM0, why do you try to hide this little detail?
And based on your little graph, this explanation is total BS — the y-axis is labeled “Watts/m2 at summer solstice” with values from 440 to 540. If this really was AM0, the last point would be about 1360 W/m2.
So you either lied, or you have no idea what you are talking about.
Or it could be right. I calculated the average horizontal irradiance at 65N on the summer solstice for the contemporary era when Earth is close to perihelion and I was getting values in the low 490’s. The University of Chicago graph may be using slightly different inputs or assumptions which could explain the small difference from what I was getting. I did these results against other independent calculations and they are to be consistent with what everyone else is getting.
Which is certainly NOT the lame wiki Banton tried to play out. Why are you trying to cover for him?
Because I am correct and you are an ideologically motivated denizen who comes here solely to bolster his bias, with no intention of understand the science that you thank all experts have wrong or that are scammers …… that’s why.
https://www.pnas.org/content/108/48/19299
“During the Holocene, high-latitude insolation varied markedly with the precessional cycle; for example, July short-wave radiation declined by ∼50 W m−2 at 65° N latitude throughout the Holocene”
And, as you probably won’t believe that here we have David Archibald, stalwart of WUWT and of failed cooling predictions fame ….
https://wattsupwiththat.com/2012/09/16/onset-of-the-next-glaciation/
“Onset of interglacials is driven by insolation at 65°N. That is where the landmass is that is either snow-covered all year round or not. It seems that insolation above 510 watts/sq metre will end a glacial period. For an interglacial period to end, the oceans have to lose heat content so that snows will linger through the summer and increase the Earth’s albedo. Thanks to the disposition of the continents, our current ice age might last tens of millions of years yet. From the Milankovitch data, this graph shows insolation at 65°N from 50,000 BC to 50,000 AD:”
Still the question remains, which is this:
Direct solar irradiance?
What altitude?
Hemispherical solar irradiance?
Tilt angle?
“Insolation” tells you precisely nothing, very much like the mythical global average temperature.
Dear god!
You really are obtuse.
Insolation is the (mostly) SW radiation that is absorbed directly from the Sun into the climate system (oceans/land) – which then heats the atmosphere.
Angle of incidence is inherent in the calculation FFS.
As in 65 deg N and the alteration of the Earth’s tilt.
Between 22.5 and 24 deg (now 23.5)
THAT IS WHY THE W/M2 CHANGES (along with 2 other variables see vid).
Altitude is irrelevant.
Try learning some science — Google it.
Sorry if it shatters your conceptions.
(Ah, but there’s the rub — the vast majority on here only want their ideological bias confirmed – why they refuse to understand the science).
Experts know stuff.
And (mostly ) denizens don’t. Or refuse to.
You being a prime example it seems.
Wearing your ignorance a though a badge.
Mostly this rabbit-hole lets you do that.
Save for the odd person who is prepared to endure the bollocks that comes back, that “knows stuff”.
Try watching this if reading stuff is so difficult ….
“How Ice Ages Happen: The Milankovitch Cycles”
Go learn some LOWTRAN/MODTRAN.
Today’s strong increase in solar wind speed will result in an increase in wind speed along the equator and a decrease in the Niño 3.4 index.
With the increase in solar activity in the coming days, the Niño 3.4 index may drop to -1.5 C in November.
Sorry.
The sharp increase in the solar wind speed caused an equally sharp decrease in galactic radiation. This shows the strength of the solar wind’s magnetic field reaching Earth.
WOW! +0.37151926 degrees!
Now I know why I was sweating profusely all month.
Heat on!
Not in North America.
In October, “hot weather” occurred in northeastern Canada.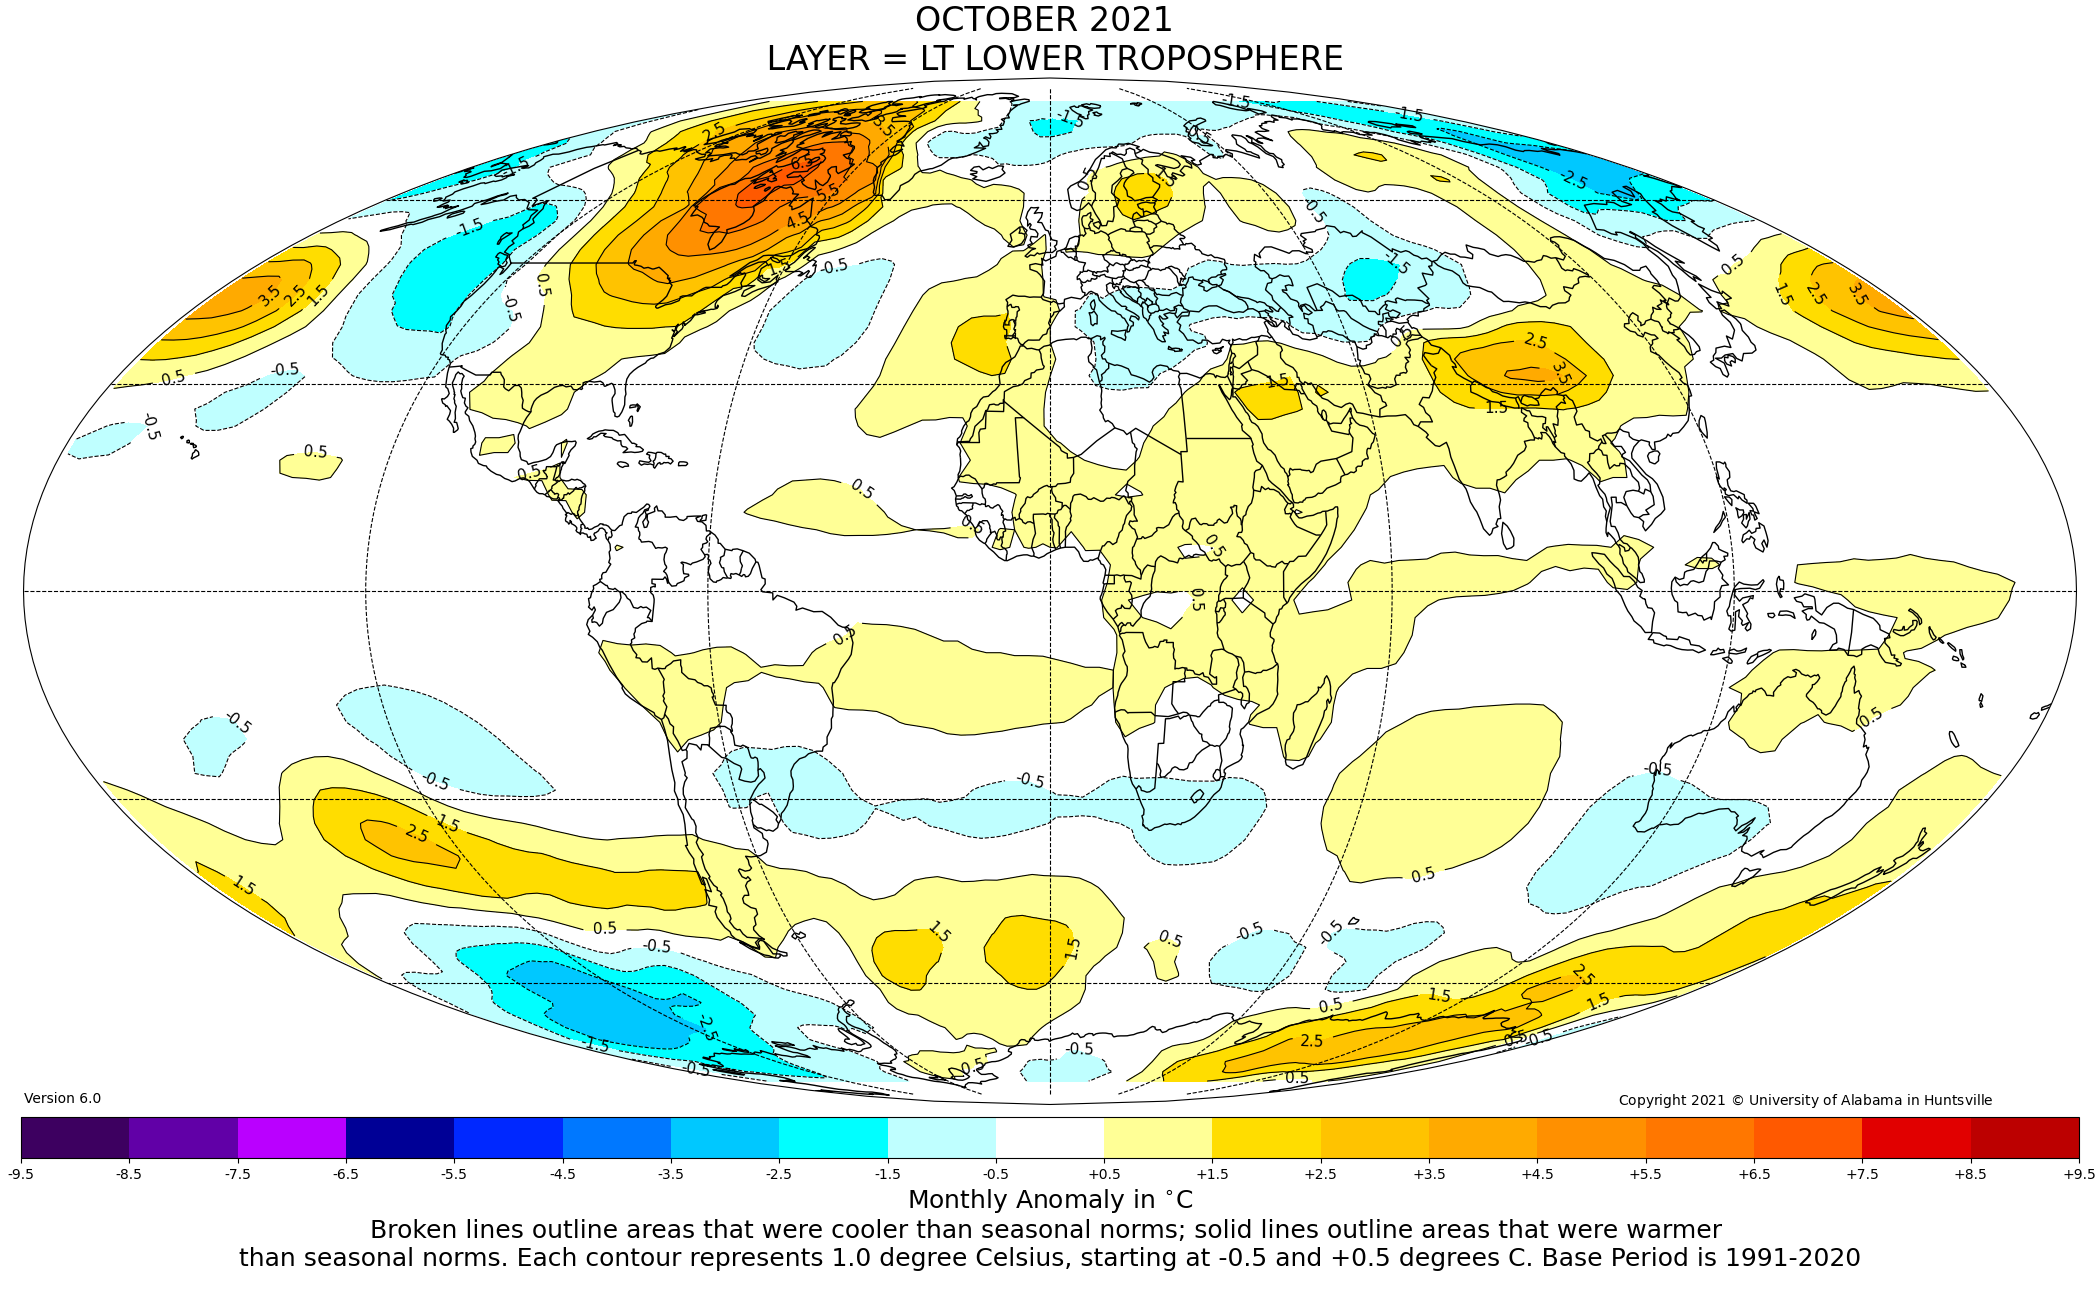
It also appears that the Blob has returned to the central North Pacific. Or Son of Blob, not so hot.
Heat displaced by Las Niñas has to go somewhere.
The circulation pattern directed more water vapor over Canada. There is a stationary high in the Pacific.
Geopotential height anomalies over the Arctic Circle have reached the higher troposphere.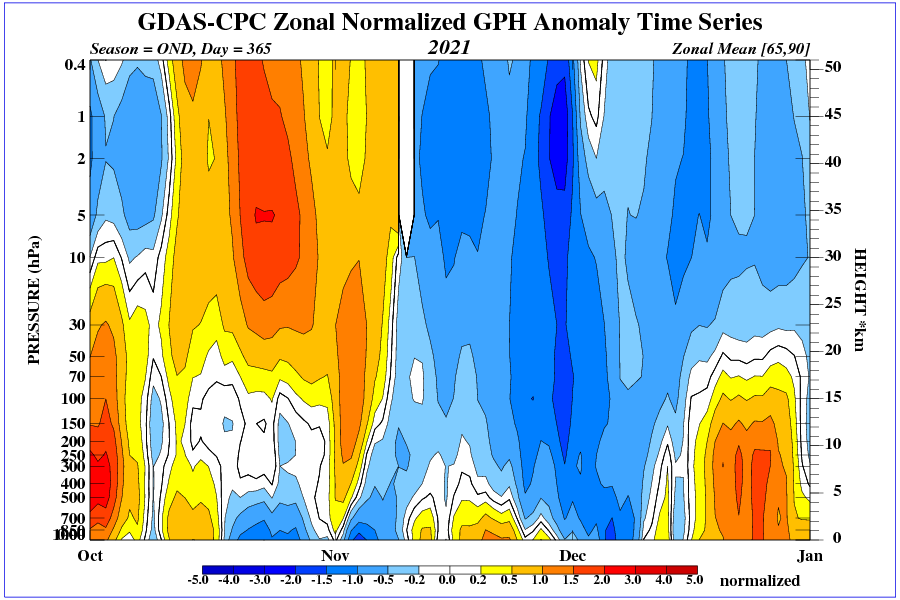
The ozone hole in the South could be at a record high again this year in November and December and break the 2020 record in those months.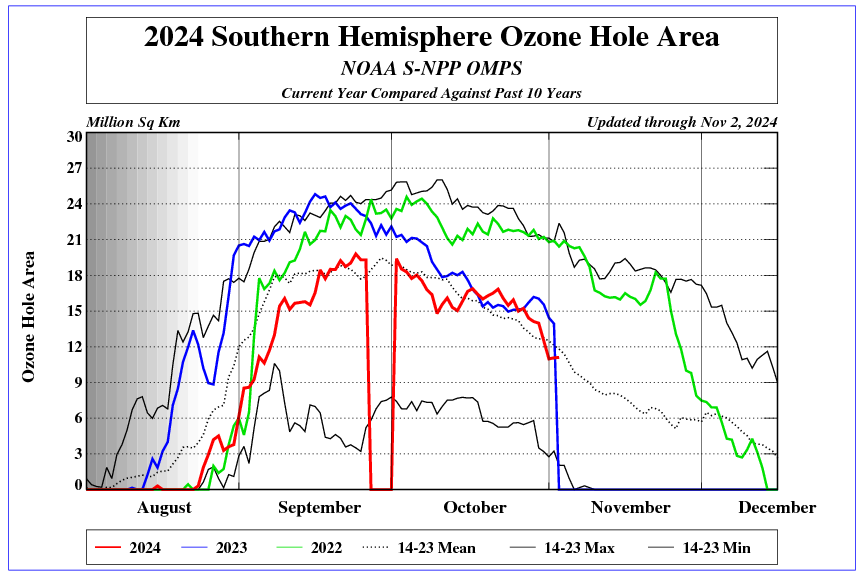
One also has to remember that in 1970’s a new ice age was forecast it was much colder than normal, also in the 1930’s and early 40’s it was hotter but Environment Canada has wiped out these records off their web site. Records of the New York times .. New Ice age in the 70’s seems no longer available .. not denying reality just thinking. Interesting that most sites start their analysis beginning at 1977/1978 which means that an upward trend is always shown as it was the coldest period.
Denise
” One also has to remember that in 1970’s a new ice age was forecast … “
No, it wasn’t.
There was a considerable amount of noise in the press about that, but if you would perform a consistent review of climate papers published at that time, you would obtain a very different result.
” … also in the 1930’s and early 40’s it was hotter but Environment Canada has wiped out these records off their web site. “
This claim is endlessly repeated on all skeptic blogs, especíally on this one; but it is not correct, because it confounds two basically different measures of temperature:
Please have a look at the following document, mahe by John Christy at UAH:
http://climaterealism.com/wp-content/uploads/2021/01/01-08-21-OSTP-Christy-Record-Temperatures-in-the-United-States.pdf
There you will see that NOAA’s USHCN data set didn’t wipe anything out. And your Env CA very certainly keeps similar data.
I’m far away from home and have no access to my desktop; otherwise I’d have posted a graph based on anomalies as described above, where winter months mostly show higher departures than summer months, what leads to a very different representation of the same original data.
But a bit of what these anomalies show you can see here, using GHCN daily instead of USHCN:
The red and blue lines are similar to Christy’s bars; look at the green line showing the highest daily minima, and draw your conclusion.
Spent a few hours with the USCRN data this week and found that, among other things, every station in Alabama had a cooling trend, while every station in California had a warming trend.
With disparities like these, how can a “global average” have any meaning at all?
James Schrumpf
I spent quite a lot more than ‘a few hours’ this year, and one of the many results was to compare, for CONUS + Alaska, USCRN with GHCN daily and UAH:
That, James Schrumpf, is exactly the meaning of global averages.
Snow and frost could be on the way for north west Europe and the U.K. for the end of November.
https://youtu.be/7o2aNGi5R2A
A November that will needless to say be the hottest evuh.
Just misses COP26 unfortunately.
https://www.cpc.ncep.noaa.gov/products/CFSv2/htmls/euT2me3Sea.html
Question from a naive person: How meaningful or accurate is ‘global temperature’? I’ve seen charts of weather station locations and find it hard to believe that a temperature can be derived without a large error bar. Why not compute and track it where stations are dense, e.g. U.S. and Europe, rather than maintain a fiction that we know what the ‘global’ temperature is?
Think about this example:
Go into your nearest Home Depot or Lowes with your tape measure, and measure the length of every piece of wood in the entire store, all different types, even the pieces broken in shipping and custom sawing cut-offs. Then calculate the average — what does this number tell you? Not much.
It is the same with temperature, it can range from -60C to +50C on any given day across the planet, and the climate scientists fool themselves when they think they can resolve changes in the global average of one hundredth of a degree.
The global average temperate is a meaningless number, which is certainly not representative of the “climate” (singular).