Guest Post by Willis Eschenbach
I see that there’s a new post up on WUWT claiming that eeevil humans are responsible for the increase in earth’s energy imbalance, which is denoted as ∆EEI in their paper. (The delta, “∆”, means “change in”.) The underlying paper discussed in the post is entitled Anthropogenic forcing and response yield observed positive trend in Earth’s energy imbalance
What do they base this claim of anthropogenic forcing on? Curiously, it’s not the usual claim that it’s due to CO2 absorbing more longwave. Instead, according to their press release, the cause is that:
…we are receiving the same amount of sunlight but reflecting back less, because increased greenhouse gases cause cloud cover changes, less aerosols in the air to reflect sunlight — that is, cleaner air over the U.S. and Europe — and sea-ice decreases.”
I’ve NEVER heard the claim that increased greenhouse gases cause “cloud changes”. How would they possibly know that?
Well, the same way they claim to know everything in their paper—haruspicy, except they use computer models instead of animals. They examine the entrails of climate models, and they compare them to the CERES and other satellite datasets. Color me unimpressed.
In any case, let’s take a closer look at their claims. They are correct that the CERES satellite dataset does indeed show an increasing imbalance. We can start by looking at the relative size of the imbalance. Figure 1 shows the actual size of the changes in incoming and outgoing energy, the two energy fluxes that are compared to give us the changes in Earth’s Energy Imbalance (∆EEI).

Figure 1. The earth receives and radiates about 240 watts per square meter (W/m2)on a globally averaged 24/7 basis.
As you can see, the change is quite small. It’s far less than one percent of the fluxes themselves.
Uncertainty
So … given the tiny size of the imbalance compared to the underlying energy fluxes, can the CERES dataset even be used for this question? As you might imagine, this question has been studied. From here we find:
However, the absolute accuracy requirement necessary to quantify Earth’s energy imbalance (EEI) is daunting. The EEI is a small residual of TOA flux terms on the order of 340 W m−2. EEI ranges between 0.5 and 1 W m−2 (von Schuckmann et al. 2016), roughly 0.15% of the total incoming and outgoing radiation at the TOA.
Given that the absolute uncertainty in solar irradiance alone is 0.13 W m−2 (Kopp and Lean 2011), constraining EEI to 50% of its mean (~0.25 W m−2) requires that the observed total outgoing radiation is known to be 0.2 W m−2, or 0.06%. The actual uncertainty for CERES resulting from calibration alone is 1% SW and 0.75% LW radiation [one standard deviation (1σ)], which corresponds to 2 W m−2, or 0.6% of the total TOA outgoing radiation. In addition, there are uncertainties resulting from radiance-to-flux conversion and time interpolation.
With the most recent CERES edition-4 instrument calibration improvements, the net imbalance from the standard CERES data products is approximately 4.3 W m−2, much larger than the expected EEI. This imbalance is problematic in applications that use ERB data for climate model evaluation, estimations of Earth’s annual global mean energy budget, and studies that infer meridional heat transports.
So that is the uncertainty in the imbalance … ± 4.3 W/m2. Makes determining the top-of-atmosphere (TOA) energy imbalance somewhat problematic, given that it is less than 1 W/m2 …
Then there’s the question of drift. Over time, satellites shift slightly in their orbits, instruments age, and reported values drift slowly over time. Basically, the authors of the paper just shine this on, in the following fashion:
Although there is excellent agreement between the individual satellites CERES derives its data from, there is, however, the potential for systematic errors associated with the observed trend due to instrument drift. We attach an estimate of 0.20 Wm−2decade−1 (assuming a normal distribution) to CERES trends, based on best realistic appraisals of observational uncertainty (N. Loeb, CERES Science Project Lead, personal communication)
Call me skeptical, but I find that far less than satisfying … seems to me that the CERES dataset is not at all fit for looking for the purpose of diagnosing trends of less than half a W/m2 per decade in the residual difference of two large values.
Data
Setting that large uncertainty aside, let’s look at the two datasets that make up the EEI. These are the top-of-atmosphere (TOA) outgoing longwave and incoming solar radiation. I often use “breakpoint analysis” to investigate what is going on. There’s a description of the breakpoint analysis functions that I use here. Figure 2 shows the breakpoint analysis of the outgoing longwave.

Figure 2. Breakpoint analysis, TOA longwave radiation. Blue lines show individual trends of sections of the data, yellow line shows the overall trend.
Now, this is interesting. Outgoing longwave runs basically level up until about 2015 (plus or minus about half a year), when there is a shift upwards combined with a rapidly increasing trend.
Why? I can’t guarantee that nobody knows … but that is certainly my belief. We can speculate, but cause and effect in the climate system are like sand in your hands …
How about the incoming solar? Figure 3 shows that result.

Figure 3. Breakpoint analysis, TOA solar (shortwave) radiation. Blue lines show individual trends of sections of the data, yellow line shows the overall trend.
This one is a bit more complex. Initially, incoming solar was increasing rapidly. Then it went level, followed by an upwards jump around 2015 (the same time as the jump in the longwave).
Why would the solar and the longwave fluxes both have breakpoints at the start of 2015? It may be related to the large 2015-2016 El Nino/La Nina … or it may not be related, given that there are more Nino/Nina alternations during the period of record, and given that the El Nino peak is not until the very end of 2015. It may be due to a change in instrumentation. Again, a very elusive question.
We can take a couple of other kinds of looks at the energy imbalance. First, here’s a graph showing both incoming and outgoing energy, along with LOWESS smooths of the two datasets.

Figure 4. Same datasets as in Figure 1 but at a different scale, including LOWESS smooths of both datasets.
This is curious. At times the incoming and outgoing radiation fluxes move in harmony, and at other times they move in opposition. In particular, they move in harmony after the breakpoints in 2015. At a minimum, we can say that we are looking at some complex processes in both cases …
Finally, here’s the difference between the LOWESS smooths, which give the actual changes in the TOA earth energy imbalance (∆EEI). Figure 5 shows those changes.

Figure 5. Earth’s Energy Imbalance, March 2000 – February 2021
Now, this is most interesting. The imbalance starts out at about 0.4 W/m2. Shortly thereafter, it drops to half of that amount. It then goes up, down, and back up to 1.2 W/m2 … before rapidly dropping all the way back to 0.2 W/m2. Then it jumps all the way back up to 1.2 W/m2, wanders around for a bit, goes up to a peak at 1.4 W/m2 … and then drops all the way down to about 0.4 W/m2. So it ends up right about where it started.
I’m sorry, but anyone claiming to see a “human fingerprint” in Figure 5 has curious fingers.
Let me close with a map showing the complexity of the overall energy imbalance.

Figure 6. Energy imbalance at the top of the atmosphere, on a 1°latitude by 1° longitude basis.
Some things of note. The numbers involved are very large. In the tropics, there is much more solar energy entering the system than longwave energy leaving the system. The opposite is true near the poles, where far less solar energy enters the system than longwave energy leaving the system. This is an indication of the “advection”, the huge constantly ongoing horizontal movement of sensible and latent heat from the tropics to the poles. In addition, the ocean generally receives more solar energy than it loses in longwave, and the reverse is true for the land. This difference is visible, for example, around the Mediterranean.
Me, I find it highly unlikely that our instruments can determine the overall total of that to the nearest tenth of a watt per square meter … yes, that’s the answer we get, but the slightest error, the slightest drift in the system, the slightest shift in the line of zero imbalance, and we’d be out by much more than the imbalance itself, much less the even smaller change in the imbalance.
My best regards to everyone,
w.
Nota Bene: PLEASE quote the exact words that you are discussing. This makes it clear who and what you are talking about, which avoids much misunderstanding.
All of the graphs and charts ad nauseum are just noise. The premise of climate change/global warming is Human caused CO2 is adding about 4% more CO2 to the atmosphere each year over and above what the natural carbon cycle can absorb, which has led to a cumulative 100+ ppm increase in atmospheric CO2 over the last few decades and the additional CO2 is causing the average temperature of the earth to increase. Theory, not fact. But even if you believe the premise, with 67% of the CO2 emissions coming from undeveloped countries at a 5% growth rate with no plans/expectations for that to change, none of the mitigation efforts being discussed will make any difference. CO2 emissions will continue to exceed the absorption capacity of the carbon cycle. Furthermore – if the premise is false, again, none of the mitigation efforts will make any difference because they’re unnecessary. This is not that complicated.
You’re right, it’s not that complicated. It’s even less complicated that that, though: They’re even against sequestration by natural gas companies, which makes it obvious that it’s not ABOUT CO2 or the climate.
From the above article’s second-to-last paragraph (itself a quote) under the subsection titled
Uncertainty:
“. . . We attach an estimate of 0.20 Wm−2decade−1 (assuming a normal distribution) to CERES trends, based on best realistic appraisals of observational uncertainty (N. Loeb, CERES Science Project Lead, personal communication)” (my underlining emphasis added)
An estimate, based on an assumption, of an appraisal . . . what could go wrong with that?
ROTFLMAO.
Something I do not see discussed very much is the fact that every effort/instrument used to measure TSI, has come up with different numbers.
And the spread is pretty wide, even among the newer ones.
So, why should we believe anyone knows how to measure these things to any particular degree of accuracy, let alone precision?
Frankly it makes me think that these numbers are all guesses.
If they are so different, what if they are all wrong?
And then there is the question of how anyone can trust any such numbers, given the evidence of alterations in apparently every data set in existence, as compared to what those data sets used to show.
The devices are one thing, and the people employing them are another.
I know for sure they are altering the TSI numbers.
They have to, since every instrument has given different values from each of the others.
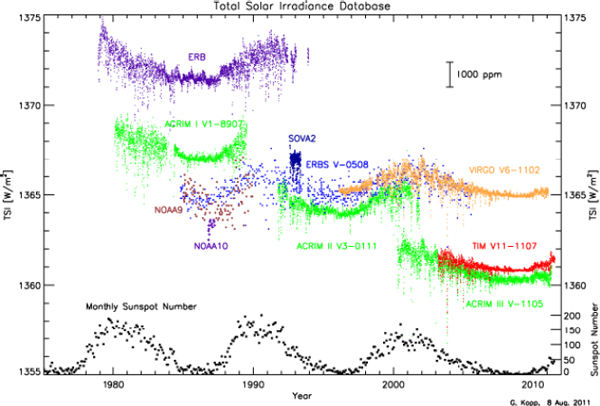
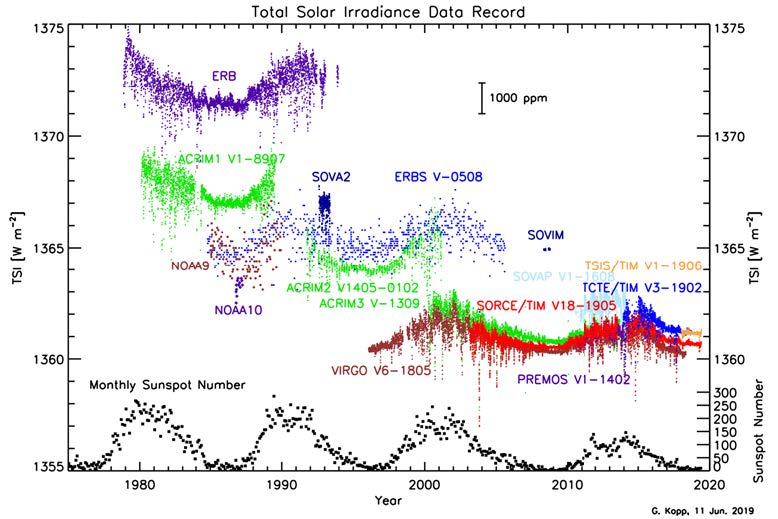
We can even see how as of about ten years ago, the TSI measured by ACRIM (green) was noticeably lower than the TSI as measured by TIM (shown in bright red in both of the pics below):
…but in the more recent graphs of these same sets compared to each other, this relationship has been reversed:
These discrepancies can be read all about in a number of places, sources as diverse as can be found.
Even the warmista friendly Wikipedia details the issue, using this info here as one source:
SORCETCTE Mission Ends – SORCE (colorado.edu)
Of course the “official” gubmint sources make it sound like they have it all settled now, but when do they not say that?
From Warmistapedia:
“Despite the fact that ACRIM I, ACRIM II, ACRIM III, VIRGO and TIM all track degradation with redundant cavities, notable and unexplained differences remain in irradiance and the modeled influences of sunspots and faculae.”
Solar irradiance – Wikipedia
Everyplace we look we see numbers altered, and every alteration goes the same way…they show a result that never is at odds with the warmista narrative.
Given that, and given that if there was no negative imbalance between what is going down to Earth and what is coming back up it would all by itself wreck the narrative….given all of the information we have, how can anyone trust these numbers?
Everything depends on them.
Everything, from surface temp, to ocean heat content, which is adjusted to match the imbalance observed at the TOA, after initially showing the ocean was in fact cooling!
Correcting Ocean Cooling (nasa.gov)
On top of all of that, UAH data shows the TLT has cooled substantially in the past few years, so, does the TOA imbalance data show this energy escaping?
Or is it even more energy that is somehow hiding in the ocean depths despite never showing up where it can be seen directly?
Bottom line is, like with everything else Warmista, the more carefully one looks, the more obvious it is that the whole field of government sponsored climate science is rotten to the core.
Here is the most recent graph I have been able to find in a few minutes of looking.
It has a new data set colored in orange.
As usual, it does not line up with others well:
AM0 measurements are made with cavity radiometers which are non-trivial to operate in orbit, with problems such as degradation over time. In 2005 there was a workshop that tried to sort through the problems:
https://nvlpubs.nist.gov/nistpubs/jres/113/4/V113.N04.A01.pdf
Also, note that the range on this plot (1360 to 1375 W/m2) is only about 1.1%; the yearly orbital variation of AM0 is more than 20 times this amount.
“Bottom line is, like with everything else Warmista, the more carefully one looks, the more obvious it is that the whole field of government sponsored climate science is rotten to the core.”
That’s what it looks like. We are contending with liars.
I don’t think it is quite fair to lump all the people doing extraterrestrial solar irradiance measurements in with the usual crowd of suspects, many of them are metrologists who do try to get the best results possible. And note that the most recent TIM data in his graph is quite close to the more recent TIM/VIRGO/SORCE data beginning in 1995. In 2018 the range of all four was just 0.06% (1360 – 1361.5 W/m2).
Yes, you are right, I don’t want to lump everyone into one category. We do have honest scientists. It’s just that the ones that get published under the climate change banner all seem to be either dishonest, or clueless, and I have a hard time thinking a climate scientist could be *that* clueless.
But you’re right, we should not lump everyone in the “liar” category. Just the Perps!
Even if we have complete trust and confidence in the people doing the work and keeping the data records, there is no way to have any reason to believe that the numbers are accurate and precise enough for the purpose of computing an imbalance which is less than a watt per square meter.
And it is surely the case that it is easier to measure the solar flux than it is to measure the flux upwards from the Earth.
Since the imbalance is the difference between these two, unless I am misunderstanding it, and no two of these type of instruments have ever given the same result, IMO it is ludicrous to believe that these numbers can be trusted.
We are bankrupting people, dismantling our industrial civilization, panicking generations of children (many of whom subsequently become addicted to drugs or commit suicide), and causing all manner of greater and lesser harms all over the planet.
The ARGO floats were constructed using the best technology available, and when the initial results showed the oceans were cooling, that was deemed to be impossible, and the instruments recalibrated to comport with the TOA imbalance.
In other words, instead of using these independent sources of data as independent verification of global warming predictions, one source of data was altered to conform to the other!
And the same thing is going on everywhere we look.
Temperature data collected over the entire planet, going back over 100 years into the past, is being altered to conform to the amount of CO2 in the air.
There are dozens of people who comment here regularly that could give a long list of examples of this very same sort of thing regarding other types of data.
This is not science, it is religion.
Faced with a lack of evidence for their ideas, people are manufacturing it, then declaring themselves correct.
It does not take everyone being dishonest.
But it does require that anyone who is honest, instead of blowing a whistle or speaking out, just shuts up, looks away, goes along to get along, or whatever.
At some point the jig is gonna be up on this con job.
I would not want to be one of the ones standing out in the open, holding the bag, when that comes to pass.
Isn’t Figure 3. Figure legend TOA Short wave incoming?
Thanks, Joel, fixed. Always glad to have someone check my work, and always glad to hear from you.
w.
One in a long line of “sure, its hot as hell, but explanation x cannot account for 100% of it!”
( suppose in this case I should have said “sure, its raining buckets, …” warmer air containing more HOH, causing more downpours, clouds, etc. :-} )
File under: Who you gonna believe, me our your own eyes? – Chico Marx 🙂
Willis,
Impressively fast turn around! The <1% probability (natural causes) claim in the GFDL paper reminded me a lot of Santer's 6-sigma opus that was published a couple of years ago, so am grateful you responded before it becomes a grifftoid talking point.
Wow. Very interesting data as always. I have to confess at being confused as to the time frame. I’m struggling with flows verse stocks. Imbalances are instantaneous and accumulate through time. I think of imbalances as flows. So over the course of a month to get the total accumulated imbalance you would have to integrate. Of course we don’t have the functional forms so that won’t work. So when you say the accumulated imbalance over 21 years is +.8 W/m^2 it is the stock of energy that has accumulated in the atmosphere. Is this right? I get confused in looking a graph 4, which shows a huge amount of accumulated imbalance through time. Its clear i am missing something as I’m sure that is not what Figure 4 is meant to convey.
If there is an imbalance, there are places besides the atmosphere that might have +, or – quantities.
Hi Willis,
I thought the best way to estimate the TOA imbalance is via heat accumulation in the ocean. Measurements of TOA radiative fluxes seem too blunt a method to get meaningful results.
People say that, but I doubt the precision and the accuracy of the measurements of oceanic heat content.
w.
Especially when you Karlize SSTs in 2015 with Night Marine Air Temperatures.
Well, there is certainly evidence of heat accumulation during the ARGO era. The number of measurements of temperature profiles (surface to 2000 meters) is on the order 35,000 per month, and since the sea doesn’t change in temperature very quickly, big measurement errors would show up as significant month-to-month swings; but I haven’t seen that in the data. The best estimates are a globally averaged TOA imbalance of somewhere near 0.65 watt per square meter over the past decade. That doesn’t seem to me very surprising considering surface temperature increases since the late 1970’s. The ARGO profiles are consistent with heat mixing (very slowly, via shear induced turbulence) down the thermocline, with most of the accumulated heat in the top 700 meters, just as we would expect. I don’t see the imbalance estimates as a serious threat to anything…. just a better measure of the TOA imbalance than direct radiation measurements can provide.
Steve, the ARGO probes measured cooling.
When that result was obtained, the measurements were recalibrated using TOA imbalance to determine what SHOULD have been measured.
Hard to believe?
Impossible?
Not for that crowd of con artists.
You are right…TOA is no where close to being able to be determined exactly enough for anything important.
But it is being so used.
The TOA imbalance is why ARGO now shows warming!
I do not know how many times I have to post this, but apparently the answer right now is, “more times”.
This what happened and is still happening:
Correcting Ocean Cooling (nasa.gov)
“…surface temperature increases since the late 1970’s.”
It got cooler and it got warmer over the entire TLT since then, but overall, as of the past few months, the increase is…well, let’s just see how much:
http://www.drroyspencer.com/wp-content/uploads/UAH_LT_1979_thru_June_2021_v6-550×317.jpg
Very close to nothing.
Since physical objects do not retain a memory of what temperature they were in the past, at the present time we are pretty much where we were then…which was notable, and noted at the time, as being the coldest period or very close to the coldest period in a hundred years.
In the 1970s, there was widespread agreement that the earth had cooled sharply for several decades.
National Geographic published graphs that showed no net warming over the 20th century, and also published sea ice maps that are almost exactly the same as what is there in recent years.
In the late 1980s, Tom Karl said that the latest careful analysis of all available data showed zero net global warming over the entire period of the 20th century.
In 1996 James Hansen said there had been no net warming in the past 16 years.
In 1992 Mark Serreze said there was no evidence of atmospheric warming between 1957 and 1986.
In 1995 the IPCC said there was no evidence of net warming between 1958 and 1995.
In 2015 NASA graphs showed zero net warming over the previous 20 years.
Graphs of temp over the past century show no net Arctic warming, and no warming in places such as the capital of Iceland.
Sea ice graphs from the 1970s and 1980s showed ice was near the midpoint of what had been observed in the past century.
The US, which is the only large area of the Earth with very good coverage of thermometer data over more than a century, shows no net warming.
No single station that has not been affected by UHI effects, shows that temperatures are in a long warming trend, or that today is anything close to the warmest ever.
No records of any type of bad weather shows the recent past to be anything other than what is commonly seen since observations began.
Nowhere can anyone look and see any sign of a crisis or catastrophe.
Our planet is half frozen, and there is no data set from the past that points to global warming caused by CO2, except those that have been altered by the people that want everyone to think otherwise.
There are no records from the entire period of human or Earth history that shows 2021 to be unusually warm, and none that show that CO2 controls the temperature of the atmosphere.
None of them, from anywhere.
Every such lie that has been advanced to the contrary has been utterly debunked and proved to be false.
The only way to refute a word of what I just said is to lie.
And that is the unvarnished truth.
“People say that, but I doubt the precision and the accuracy of the measurements of oceanic heat content.
w.”
Me too, sir, me too.
And I am willing to state flatly a far stronger expression of this sentiment:
It is a con job.
-Made up.
-Phony.
-Manufactured for purpose.
-Ad hoc.
-Malfeasance.
-Criminal.
The only reliableOHC measurements are from ARGO, and span now about a decade. See my previous ARGO fit for purpose post. So, by ARGO design, we dunno yet.
Thanks, Rud. You are correct that the ARGO measurements are good … but the calculations done from them are suspect. The problem is that they claim an uncertainty of 0.003°C for the temperature of the top 2000 metres of the ocean.
Now, uncertainty varies inversely with the square of the number of observations. So if you want another decimal of uncertainty you need 100 times the number of observations.
And this works in reverse as well … which implies that we could measure the temperature of the top 2000 metres of global ocean with an uncertainty of 0.03°C using only 40 Argo floats …
… and if someone believes that, I’ve got a bridge to sell them …
w.
Willis:
Careful, don’t fall into the mire used by most of the climastrologers—this is impossible without a measurement system that makes 100 independent temperature measurements simultaneously at the same spatial location.
They do not understand (or refuse to understand) that uncertainty from standard deviation is only reduced when the population is invariant.
With a single thermometer the standard deviation is exactly one!
Monte, suppose we want to figure out the sea level height at some given location, given that there are waves and tides. Now, which will be more accurate. One measurement taken at one time at that location, or a thousand measurements taken at different times in that same location?
Obviously, the latter will be much closer to the actual sea level than the former.
In other words, no, it’s not a requirement that the measurements be taken simultaneously as you claim.
w.
Since you are measuring the height of the water, as long as you take all measurements in the same spot, you are measuring the same thing.
This is not true of the ARGO floats. By definition, they float around the oceans, each measurement occurs in a different location.
To carry on with your sea level analogy, instead of taking 1000 measurements at the same spot, you take 1000 measurements scattered at 1000 spots, scattered over a wide area.
Willis,
You state that “I’ve NEVER heard the claim that increased greenhouse gases cause “cloud changes”. How would they possibly know that?”
However only a couple of days ago in your post “Keeping things in balance” you wrote “Decrease the incoming radiation. This happens by means of changes in the amount, composition, albedo, thickness, time of emergence, and/or nature of the clouds. “
So it appears that you have in the past couple of days made exactly the claim that your are now dismissing.
Isaak – in Willis’ previous post did he actually, at any point, explicitly state that the changes in clouds were as a result of increased greenhouse gases?
No, I did NOT make any such claim, Richard. That’s why Izaak hasn’t quoted any such claim.
It’s just another part of Izaak’s endless failed attempts to stand on tiptoe high enough to bite my ankles … just ignore him.
w.
There you go exaggerating again Willis as the climate crackpots, climate liars, climate criminals, and climate nitwits accuse you of … whatever.
Standing on tiptoes they might be able to lick the soles of your sandals and that’s probably an already falsified, falsifiable hypothesis.
Izaak doesn’t even know who the important Izaak Walton was and still is, as his legacy. He thinks his fishing joke isn’t about 3 years past its sell-by date.
The PDO went positive in February 2014,
https://www.data.jma.go.jp/gmd/kaiyou/data/db/climate/pdo/pdo.txt
and the oceans soon followed.
https://www.woodfortrees.org/plot/hadsst3gl/from:1980/to:2014/plot/hadsst3gl/from:2014/to
Interesting correlation as the PDO usually is driven by different atmospheric conditions which could certainly affect clouds.
True. However, the PDO also “went positive” in Nov-2000, Jul-2002, Dec-2003, Jun-2004, Dec-2004, Nov-2005, May-2006, Jan-2007, Mar-2007, Jun-2009, Dec-2009, Jan-2014, Nov-2017, Mar-2018, Jun-2018, and Oct-2019.
So I fear you’re not looking at a real phenomenon.
Regards,
w.
I think you guys in the NH should hang your heads in shame. We poor Aussies and the rest of the SH are due at least a trillion $ in compensation because our CSIRO tell us we are the NET co2 sink and you jokers in the NH are the NET co2 SOURCE.
Don’t forget SH is about 0.8 billion population and your NH about 7 billion or about 8.75 times more people. Think of all the damage you’ve caused over the last 200+ years. Just kidding, SARC.
Here’s their quote from their Tassie Cape Grim site and the link.
https://www.csiro.au/en/research/natural-environment/atmosphere/Latest-greenhouse-gas-data
“Seasonal variation””Carbon dioxide concentrations show seasonal variations (annual cycles) that vary according to global location and altitude. Several processes contribute to carbon dioxide annual cycles: for example, uptake and release of carbon dioxide by terrestrial plants and the oceans, and the transport of carbon dioxide around the globe from source regions (the Northern Hemisphere is a net source of carbon dioxide, the Southern Hemisphere a net sink).
The Cape Grim baseline carbon dioxide data displayed show both the annual cycle and the long-term trend.”
Is it just me, or does the shape of the incoming solar radiation graph look a lot like the temperature anomaly graph? Big peak around 2000, fairly flat trend for 15 years and then a shift up and flat trend on a new, slightly higher level.
Just a quick eyeball-matchup using the graph from Dr. Spencer:
I am not seeing how that TSI part matches up with measured solar flux:
We are in a quiet Sun period, which is correlated with lower solar output.
The amount is small, but that graph of incoming solar seems to indicate solar output has increased as solar activity has diminished.
haruspicy
New word for the day!
“The imbalance starts out at about 0.4 W/m2”.
And you called such a small thing imbalance?
I’ll tell you what imbalance is:
“ The earth receives and radiates about 240 watts per square meter“.
How this number was calculated? It was calculated using Stephan-Boltzmann law: power from black body equals constant by temperature power four. This power spread on the area of the sphere with the radius of Earth orbit.
The Earth has inner core with the temperature of 5700K and radius 1220 km.
Using same Stefan-Boltzmann equation and recalculating for the Earth’s radius, we got about 2 Megawatts per square meter from down under!
That’s what I call imbalance.
Nick B July 29, 2021 4:43 pm
Not true in the slightest. It is MEASURED, not calculated but MEASURED, by instruments on a satellite. Nothing at all to do with either Stephan [sic] or Boltzmann.
w.
Willis,
You wrote –
“Not true in the slightest. It is MEASURED, not calculated but MEASURED, by instruments on a satellite.”
Wishful thinking. For starters, the entire energy spectrum cannot be measured using any currently known instrumentation.
Second, in practice, such instruments as used are not highly accurate – in practice, plus or minus 3%, or worse.
Third, if you look at research into satellite “measurements” the magic word “estimated” pops up with monotonous regularity.
Additionally, the energy in a particular band may be completely irrelevant to conditions on the surface. For example, energetic UV-C may be “measured” by a satellite instrument. However, 100% of this energy will be absorbed in the creation of ozone from O2.
And so it goes . . .
“Energy balance” in relation to weather, or its average, climate, is just nonsensical pseudoscience. The Earth has cooled from the molten state to its present temperature. No GHE needed.
If you can think of any physical reason which prevented the Earth from cooling to its present temperature, I would be grateful to hear it. I certainly can’t think of any, and a reduction in the rate of cooling is not heating. No semantic tricks, please.
Swenson, I fear you haven’t done your homework. From the CERES website:
Now, you may not like it, but there’s no Stefan-Boltzmann calculations in there as you are claiming. Those instruments MEASURE what is going on.
w.
Willis,
You wrote –
“Swenson, I fear you haven’t done your homework. From the CERES website:”
Nothing you have quoted addresses anything I wrote.
Maybe you could afford me the same courtesy you demand of others –
“Nota Bene: PLEASE quote the exact words that you are discussing. This makes it clear who and what you are talking about, which avoids much misunderstanding.”
Vague nonsense like ” I fear you haven’t done your homework . . .” whilst totally avoiding providing a reason for making such a witless statement, just makes you look a little bit silly.
To top it off, you wrote –
“Now, you may not like it, but there’s no Stefan-Boltzmann calculations in there as you are claiming.”
Eh? What happened to ” . . . quote the exact words . . .”?
I claimed no such thing. You just made that up, didn’t you?
Finally, I repeat something you obviously avoided –
If you can think of any physical reason which prevented the Earth from cooling to its present temperature, I would be grateful to hear it. I certainly can’t think of any, and a reduction in the rate of cooling is not heating. No semantic tricks, please.
You see, neither the Sun, nor the Earth’s internal heat have been able to prevent the Earth cooling to its present temperature. To raise the temperature of the Earth would require some new form of energy, which you can’t produce.
Sorry, Willis, the GHE is a delusion. Feel free to quote me.
Swenson, my bad. I figured you were both smart and honest enough to see what I was referring to since it was the entire topic of our interchange. You claimed that the toa radiation was NOT measured, it was calculated. Now, you are lying about saying that.
You now say:
However, just above you said:
I made up NOTHING.
No, it was not “calculated”. It was measured. Since you are neither honest enough nor smart enough to notice or admit that’s what our discussion has been about, I’m gonna give you the last word, but I’m done talking with you. You’ve burned your bridges with me.
w.
Willis,
You wrote –
“However, just above you said:
No I didn’t. I assume you were a bit (or a lot) sloppy, and assumed I was Nick B. You then compounded your lack of care by saying –
“Now, you are lying about saying that.”
Try learning to read and comprehend what I said. Swenson, not anyone else.
i don’t blame you for saying “You’ve burned your bridges with me.” Running away after being made to look foolish? Why should I, or anyone else, care for the opinion of someone who makes stuff up, falsely accuses me of lying, and then runs away like a coward when I point out you have put someone else’s words in my mouth.
Oh well, others can make up their own minds.
By the way, you ran away from answering “If you can think of any physical reason which prevented the Earth from cooling to its present temperature, I would be grateful to hear it. I certainly can’t think of any, and a reduction in the rate of cooling is not heating. No semantic tricks, please.”
What’s up, Willis, running away, and burning your bridges behind you?
Ah, my bad. You are 100% right. I read Nick’s comments as yours. My apologies.
However, regarding your claim that:
I didn’t “run” from this, I simply didn’t understand it. Geological evidence is that the earth cooled down so far that it entered a phase called the “snowball earth” some 700 million years ago. From there, it warmed up to warmer than today, then gradually started cooling. For the last 3 million years or so it has alternated between glaciation and interglacials.
Given that, I fear I can’t make any sense out of your question …
My best to you.
w.
Willis,
Two “my bad”s. Tut, tut. One might be acceptable, two smells of sloppiness and ineptitude. Would you like to try for three?
You wrote –
“Geological evidence is that the earth cooled down so far that it entered a phase called the “snowball earth” some 700 million years ago.”
No. A “snowball earth” hypothesis (speculation) has been advanced as an explanation for some geological anomalies. Unfortunately, it is of course physically impossible for a large ball of molten rock, exposed to the sun at the distance of the Earth, to develop a completely frozen surface.
So, to reiterate, if you can think of any physical reason which prevented the Earth from cooling to its present temperature, I would be grateful to hear it.
Just claiming that the Earth cooled even further, and then spontaneously heated again, would indicate that you can’t provide any physical reason why the Earth has not cooled to its present temperature.
Are you still claiming you cannot understand my question? What is so difficult about admitting that the Earth cooled to its present temperature. Or are you trying to avoid admitting this is possible, because there would be no need for any nonsensical GHE?
I can’t think of any physical reason why the Earth did not cool to its present temperature. How about you?
Swenson,
What sort of an argument are you making here, that earth has steadily cooled from a “molten” state to its current, apparently ever-cooling condition? Is that over the past 6000 years since Adam and Eve, or what is the source of your evidence?
I’m not sure why Willis sustained interest in your blather as long as he did.
What you’re implying is that there have never been any glaciations nor Holocene Climate Optimum, Egyptian, Minoan, Roman, Medieval, or Modern Warm Periods of this current interglacial period. No Dark Ages, no Little Ice Age. Only a monotonous steady cooling. Frost fairs on the Thames? You weren’t there to see it, didn’t happen.
You present as a classic case of the farcical pseudo-intellectual who says “that’s fine in practice, but does it work in theory?” You don’t have an explanation, so the evidence is to be discounted and discarded!
I’ll be the first to say that the current modest warming is quite unremarkable and beneficial, but it is a slight warming nonetheless. Apparently you deny that as well?
Unless you are about 15 years old and live in a tropical region where temperatures rarely vary, it’s hard to conceive how you would lack personal experience of the fact that climate fluctuates with both warmer and cooler periods.
If there ever was a point to what you were saying, you failed utterly to communicate it.
Rich,
Maybe you could quote what you are disagreeing with? I am not “arguing”, but merely stating current facts, as generally accepted by geophysicists. If you believe the Earth was created 6000 years ago, or created at absolute zero, or is flat, you are perfectly free to do so.
In the meantime, notwithstanding your attempts to tell me what I am thinking, maybe you could tell me if you can think of any physical reason which prevented the Earth from cooling to its present temperature, I would be grateful to hear it.
Or you could just wriggle away, and pretend that you are so thick that you cannot understand a simple question.
As to your other attempts at diversion, don’t be stupid. Putting words in my mouth just makes you look like a fool. If a thermometer shows a rise in temperature, why would I deny it? That’s what the instrument was designed to indicate – temperature. If you claim that CO2 makes thermometers hotter, then I would say that you are delusional. It doesn’t.
What is it precisely that you are whining about? Are you denying that the Earth cooled from its initial molten state to its present temperature? No?
Oh dear, much ado about nothing, then
Your point about cooled to it’s current temperature makes no sense.
The earth was once completely molten. Yes.
The earth currently only has a molten core. Yes.
The amount of energy reaching the surface from the core is less than 0.1% the amount energy reaching the earth from the sun. Yes.
The temperature of the core has so little impact on the temperature of the atmosphere that it isn’t worth the time to calculate it.
Mark W,
The surface was once molten. Yes.
The surface is not now molten. Yes.
The temperature of the surface has . . . dropped.
The surface has . . . cooled.
All quite natural, unless you can think of any other reason.
Nothing stopped the temperature falling to where it is now.
Certainly not any mythical “GHE”.
Following that line, in several billion years what remains of earth will cool to the ambient temperature of the surrounding vacuum. And many trillion years after that, eventually to just above absolute zero.
While it may be factually correct, it’s hardly relevant.
I’m really trying to decide what kind of point you think you are making. The crust cooled to it’s current temperature billions of years ago. You’d have to be quite a moron to think that GHE would have prevented this.
I’m still trying to understand why it is you believe GHE would have been able to stop this cooling, even it had been thousands of times more powerful that it is.
Swenson,
I have only read so far about the first 15 comments in this subthread, and I am with Mark…I do not know where you are coming from or going with the stuff about the Earth once being molten, therefore a snowball Earth is impossible.
There does not seem to be any info asserted to stand on one side or the other on that, and it sounds like you are arguing about something only you have spoken about.
What the heck does what is going on now re the Earth’s energy budget have to do with what was going on 4.5 billion years ago?
Look “Swenson” (if that’s the latest sock puppet name you want to use), you are obviously arguing that there’s no such thing as a greenhouse effect and you are obviously trying to derail meaningful conversation with your absolute nonsense.
Going with Willis’ rule, I’ll give you one last serious response and then you can blather on into the ether for all I care.
“If you can think of any physical reason which prevented the Earth from cooling to its present temperature, I would be grateful to hear it. I certainly can’t think of any, and a reduction in the rate of cooling is not heating. No semantic tricks, please.”
Those are your cryptic nonsense words. Nothing being put into your mouth.
It’s inscrutable. Basically asking if something that is asserted to be true was in fact prevented from being true. If it had been, then the original assertion would be false. Pure illogic, or a proof by tautology. So we’re forced to try to make meaning out of your non-meaning in order to give you a response. Then you attack saying that we are putting words in your mouth. Very effective trollish behavior up to this point.
There is only one way that the earth has lost heat since it was “molten” and that is by radiation loss to space. The earth is not a point source of heat, and different parts of it have extremely different temperatures. There are oceans and an atmosphere interacting in a tightly coupled dynamic system. The amount of the solar insolation that is retained varies dramatically over time and across the surface.
In addition, the interior, while it had a certain amount of heat at the moment we want to consider it substantially finished with its accretion process, has also been generating heat continuously through radioactive decay.
But with the foregoing as a way of saying that this system is very complex, the bottom line is that every last joule of energy lost from the earth system has ultimately been by radiation. The rate of that loss is a net of inputs from the sun. The thing you want to deny is that the rate of radiation loss can be inhibited by absorbing and re-emitting upwelling infrared protons. It’s an observable fact that this happens. So rage away now. I won’t be responding further.
Rich,
You wrote –
“The thing you want to deny is that the rate of radiation loss can be inhibited by absorbing and re-emitting upwelling infrared protons.”
Why don’t you quote me, rather than make stuff up?
In any case, reducing the rate of radiation loss from the Earth does not result in heating!
Slower cooling is the result. Fact. In the case of the Earth, observable fact. The surface has cooled. That’s what you are concerned about, isn’t it?
Geophysicists calculate the current rate of heat loss (based on measurement) as being in the range of one to four millionths of a Kelvin per annum.
Deny all you like. The Earth is cooling.
If you have your knickers in a twist about thermometer readings in the vicinity of the surface, that is a completely different matter. Nothing to do with the mythical “GHE”.
I assume you have no genuine interest in discussing physical reasons for thermometer readings, but let me know if you can’t figure it out.
Nobody has ever denied that the Earth’s core is cooling.
What we have denied is your belief that this rate of cooling plays any part in day to day or even century to century weather/climate.
I don’t know where you have gotten this insane notion that GHE’s are supposed to prevent cooling. Nothing could be further from the truth. They slow cooling, which is an entirely different animal. One which your ideology is preventing you from acknowledging.
some funny typos there, I meant of course “the rate of that loss is net of inputs from the sun”, not “a net of inputs”
and
photons, not protons.
This is what happens when you type on an iPhone. 🙁
Rich said,
“Those are your cryptic nonsense words. Nothing being put into your mouth.”
I do not want to gang up on Swenson, since it is unclear to me what exactly he is trying to say.
But he is being kind of rude.
But mostly I want to thank Rich, because this is what I was thinking, but was not sure.
Now I am.
Those are nonsense words, pointless, and purely argumentative.
And Swenson, Willis did make an incorrect attribution in his first few comments, and he did own doing so and make an apology for that.
You could try to be a little gracious at least.
And you could have simply started out by saying directly that Nick B said that stuff about Stefan-Boltzmann right at first, and been done with it.
There is only one way to make a point that people are not understanding, and that is to restate it more carefully and in more detail.
Doing otherwise is not having a conversation, it is just yelling.
First off, the world isn’t molten. It has a molten core. That’s it.
Whether or not any part of the globe can have ice on it’s surface depends solely on whether the heat that is warming a particular site (from above as well as from below) will allow that particular point to drop below freezing.
Since the amount of heat coming from below is trivially small, all we need to concern ourselves with is the heat coming from above, and how much of it is retained at the surface.
In other words, your claims that having a molten core prevents a molten earth scenario are utter bullocks.
Swenson July 30, 2021 3:03 am
What, you’ve never made a mistake? I have the balls to admit my mistakes, and you want to rag on me about it?
Go away. I’m done with you and your ugly kind of personal attack. Go bother someone else, because I can guarantee, this is the last serious answer you’ll get from me. Not enough hours in the day.
w.
Willis,
You wrote –
“What, you’ve never made a mistake? I have the balls to admit my mistakes, and you want to rag on me about it?”
Eh? You don’t like me pointing out your more obvious mistakes? Who would? Admitting your mistakes is just common courtesy.
Boasting about your balls for admitting you were mistaken when you called me a liar, and all the other condescending and patronising rubbish you wrote, does not change things.
The Earth’s surface has cooled from the molten state. No amount of mythical GHE prevented it. The Earth continues to lose heat at the rate of some 44 TW. Not a lot, but energy loss results in cooling, not heating.
You are probably confused about thermometers near the surface used to measure nominal air temperatures. If you can’t figure out why these show varying temperatures, let me know.
if your balls are big enough, of course.
Oh, I missed “Go away. I’m done with you and your ugly kind of personal attack.” Pointing out your blunders is a personal attack, but you calling me a liar isn’t? Tut, tut, Willis.
Obviously my balls are much larger, and demonstrably less sensitive. I’m not going away as per your command, by the way. You make mistakes, I’ll do my best to point them out, just as I expect you to do to me.
Pass. Rave on, it’s your reputation you’re destroying, not mine.
w.
I’m still trying to understand where you managed to dig up the insane notion that GHEs are supposed to prevent cooling.
If you can ever get that nonsense out of your head, perhaps you will be able to realize just how big a fool you have been making of yourself.
“Running away after being made to look foolish?”
You are the one that looks foolish. Self-inflicted.
Tom,
And that is your considered opinion, is it? Add $5, and you would have enough to buy a cup of coffee.
In other words, opinions are worth what you pay for them – generally nothing.
How about it, Tom. Can you come up with a physical reason why the Earth could not have cooled to its present temperature? No?
Surely you have an opinion. Otherwise, others might think you have made yourself look like a bit of a dill!
I’ll wait while you think up another diversion.
I think you just want to pick a fight with someone, Swenson. Then you can demean them and presumably, that boosts your ego.
I think Mother Nature is in charge of the Earth’s climate and have no reason to come up with a physical reason why the Earth has attained its current temperature, other than that.
All I have to do is look at history and see that our current temperature profile is just a repeat of the 1910 to 1940 warming. That would be back when Mother Nature was in charge, according to the IPCC.
And what came after the 1910 to 1940 warming? Why, about four decades of cooling, and that had to be Mother Nature, too, since CO2 was climbing steadily all during that time, yet the temperatures continued to fall to the point that the News Media was starting to worry about an New Ice Age coming.
Here’s a regional surface temperature chart that shows the various ups and downs of our climate:
Keep in mind that 1998 (on this chart) and 2016 (not on this chart), are statistically tied for the warmest year since the 1930’s.
And here is the UAH satellite chart that shows both 1998 and 2016:
Do you know where I’m coming from now?
Tom,
You wrote –
“Do you know where I’m coming from now?”
In view of the fact that you haven’t indicated whether you are disagreeing with something I said (quoting my exact words might help), I neither know nor care.
If you feel demeaned, I cannot control your feelings, so don’t blame me.
I just said that I can’t see any reason why the Earth cannot have cooled to its present temperature from an initial molten state.
Various commenters are aware that if this is true, the mythical GHE, supposedly some sort of heating effect due to things like CO2, has demonstrated its complete and utter inability to affect the cooling of the Earth, let alone increase its temperature.
I assume you cannot bring yourself address these facts, nor work out how thermometers respond to heat. Presumably, you think your graphs have some meaning, but of course you won’t say what you think it is, in case you end up looking a bit inept.
Tom,
It seems you are correct, that Swenson is just a rude person who likes be mad at the world.
Swenson, can you try to state your point without insulting anyone?
Do you know how long it took for the Earth’s surface to cool to a solid crust after it formed?
Are you aware that the Sun’s output is thought to have changed substantially over the intervening 4.5 billion years?
I love it, in Swenson’s opinion, opinions are worth nothing.
You have been giving nothing but opinions, ill informed and poorly presented, but opinions nonetheless.
You claim it can’t be measured.
Willis showed how it is being measured.
How is that not “addressing what you wrote”?
MarkW,
No, Willis passed on some wishful thinking.
The instrumentation cannot measure the full solar spectrum at all. The bandwidths being measured are a portion of it.
The instruments have inherent accuracy limits, which cannot just be wished away.
Check it out yourself, if you wish. Or just mindlessly believe what you want. Your choice.
Willis addressed your points, but you aren’t man enough to acknowledge that.
MarkW,
No, he didn’t.
If you really believed that, you would quote my “points”, and what Willis “addressed”.
But of course, you avoid quoting what I actually wrote, because you are just another climate crackpot, living in a fantasy.
Give it a try – face reality. Back up your witless assertions with actual documentation. How hard can it be? You never know, I might be as sloppy and inept as Willis! I might have to apologise more than he did,
Off you go, now,
“ I might have to apologise more than he did,”
I will bet you all the money in the world that you will not apologize to anyone, ever.
Swenson,
The measurements are in all likelihood very inaccurate, IMO.
They may even be deliberately fudged.
But that is not the same as saying they are not measured.
I made this point upthread, and did it without starting any fights, and by providing some data based rationale for what I was saying.
Logically speaking, naked assertions will never be able to prevail in an argument.
Some opinions tend to carry more weight in the minds of other individuals.
These tend to be ones proffered in a straightforward and logical manner, and backing up what one is saying with same data never hurt either.
Your method of argumentation is not going to win over anyone, and would not prevail even against a mob of teenaged simpletons.
Nicholas,
You may look more credible if you quoted my exact words, before you get all whiney.
Why would I want to “win over” anyone? Who would care?
It remains physically impossible to measure the total energy from the Sun, impinging on the surface, or the atmosphere.
Claims or assertions of such measurement are worse than useless, as gullible people might believe them, to their ultimate detriment, being seen as gullible or ignorant fools.
If you wish to believe fantasy in preference to fact, be my guest. Don’t blame me if it makes you look stupid. I don’t care about your “feelings”. Nor does anybody else who practices the scientific method.
“100% of this energy will be absorbed in the creation of ozone from O2″ (this energy being UVC)
UV that reaches the surface, the most energetic part of the sunlight that reaches the surface, penetrates relatively deep into water, depending on the overall condition of the water. Water is very dense relative to the surface atmosphere. The surface atmosphere is very dense relative to the upper reaches of the atmosphere. Yet those upper reaches, with few molecules per cubic meter, are claimed to absorb virtually all of the still more energetic shorter wavelength UV while apparently allowing most of the longer wavelength, lower energy UV to pass on by. If true, it must make sense. Is there an known explanation?
Andy,
Indeed there is. You are right, in the far upper reaches there are not a lot of O2 molecules. However, the number grows as the density increases. Photons with certain energy levels (broadly known as UVC) interact with O2, rupturing the bond, creating atomic oxygen, which combines with O2, forming O3 (ozone). Luckily, unstable O3 decays back to nice stable O2, quite quickly. Luckily, because O3 has extreme oxidising properties, and may oxidise your tissues to your detriment, if enough is present.
Having left many things out, to sum up, various types of matter interact quite differently with different wavelengths of light (EMR).
Quick example – water in microwave oven gets hot. Most plastics, paper, china, etc. do not. All exposed to the same wavelengths.
Interesting, isn’t it?
“Yet those upper reaches, with few molecules per cubic meter, are claimed to absorb virtually all of the still more energetic shorter wavelength UV while apparently allowing most of the longer wavelength, lower energy UV to pass on by. If true, it must make sense. Is there an known explanation?”
Hi Andy,
Since Swenson did not answer your question, which is a good one, I will give it a go.
The explanation has to do with how many molecules of ozone are in the whole of the layers in which ozone resides, coupled with the ability of an ozone molecule to absorb the wavelengths in question.
The upper atmosphere is very rarified, but it is many miles thick.
It varies with latitude, location, and from year to year and according to the time of year, and probably for several other reasons such as the solar cycle, but in general the ozone layer is about 12 miles thick, or about 20 kilometers, which is of course 20,000 meters.
This is a layer thicker than the entire troposphere.
Also ozone is able to strongly absorb in the UV bands that it does absorb.
We know that some materials can absorb light very strongly with only a thin layer of the material. Think of black polyethylene, like trash bags are made of.
In fact, the poly itself is transparent to most wavelengths of visible light, but it has dye in it that absorbs very strongly. It must…because only a small amount of the material is the black dye that can block sunlight with a sheet thinner than paper.
We can put sunscreens on our skin that block out UV with a layer that is not even visible, and can fit in a small dab of some cream that is mostly just a vehicle for the sunscreen molecules.
(BTW, I do not recommend anyone always smear the entire body with them. We need UV to made vitamin D, and our skin has not evolved to be smeared with gooey chemicals, but it is evolved, for most of us, to handle UV just fine.)
So, getting back to the UV and ozone thing…
There is a unit called a “Dobson”. One Dobson is the amount of molecules it would take to equal a layer of pure ozone 1/100 of a millimeter thick, 0.01 mm, if the ozone was at sea level pressure and 0.0°C.
This is what physical chemists refer to as standard temperature and pressure, STP.
There are something like 300 Dobsons of ozone on average in the ozone layer, according to the sources I checked just now.
Of course it varies, but that is the number given as an average.
So, that comes to the equivalent of a layer of pure ozone molecules 3 millimeters thick.
Over a tenth of an inch.
Each square centimeter of the air column from the surface to space has about 2.7 x 10^16 molecules of ozone in it.
A sheet of black construction paper can block every ray the Sun puts out that gets to the surface of the Earth, and it is a lot less than 3 millimeters thick.
3 millimeters is about the thickness of two pennies, according to one graphic I saw, and the ozone hole is said to represent a deficit of a dime’s worth of that thickness.
So, thought of in that light, I for one do not even need to look up the relative absorption of ozone to UV photons.
3 millimeters is plenty of something to absorb photons.
One pint of some dyes can dye an entire lake dark enough to kill weeds at the bottom. And the pint of dye is mostly water.
BTW…the ozone layer itself is only said to contain ten parts per million of ozone molecules! And it is already very rarified, as you note.
Nicholas,
You wrote – “Since Swenson did not answer your question, which is a good one, I will give it a go.”
Andy asked – “Is there an known explanation?”
I suppose you might think that “Indeed there is.” is not an answer.
However, presenting a farrago of misinformation just makes you appear stupid, ignorant, delusional or all three, to anyone who stayed awake during their undergraduate physics classes.
Such gems as “Also ozone is able to strongly absorb in the UV bands that it does absorb.” are about as silly as saying ozone is transparent to those UV bands that it does not absorb. Are you stupid, or sloppy?
So carry on. Maybe people less intelligent than you (surely there must be some) will take notice of your rambling irrelevancies.
No one is impressed by your trolling.
Best you run along back to Roy Spencer’s blog and spend all day having the same pointless and fact free disagreements with the same people you have been having them with, for another endless amount of time.
It has been at least twenty minutes since any of you dime-a-dozen jackasses has reposted their favorite 600 word comment about a ball on a string.
Nicholas,
You wrote –
“No one is impressed by your trolling.”
And I am supposed to care about your opinion because . . .?
I suppose you want to blame me because I point out you are a delusional climate crank, who can’t even describe the mythical GHE!
The latest from NASA is that the GHE is a “process”.
So, nothing to do with greenhouses, and not an effect either!
Do you actually believe this rubbish?
I suppose you do.
These climate “budget” or “balance” articles are a glorified “chocolate bar” trick. Break things up into pieces, and show that they do not add together again.
You can get any amount of chocolate you want with the chocolate bar trick. So climate alarmists use it to get any number they want.
“increased greenhouse gases cause cloud cover changes”
Changes in sea surface temperatures cause changes in could cover. Weaker solar wind states drive warmer ocean phases via the AO/NAO, which reduce low cloud cover.
If rising CO2 forcing projects onto natural variability, it should increase positive AO/NAO conditions and drive colder ocean phases and increase low cloud cover.
Ulric, you seamlessly morphed from what I said, that there was no evidence that “increased greenhouse gases cause cloud cover changes”, to discussing how changing temperatures cause changes in cloud cover, which everyone knows. Nice try.
As to whether “Weaker solar wind states drive warmer ocean phases via the AO/NAO”, if you have a link to both a study and the underlying data to support that, I’m happy to look at it.
w.
That is what they said, not what you said. I didn’t comment on what you said, so you’re doing the seamless morphing thanks.
Warmer SST’s do reduce low cloud cover, and not everyone knows that, so nice try yourself LOL.
https://www.sciencedirect.com/science/article/pii/S1364682616300360
Delegates from China at the UN IPCC Copenhagen Conference explained that during 3,600 years of recorded civilisation in China there were three periods of greater prosperity, they were warmer periods and with much higher crop yields.
Willis –
Baffled by a few things here! First, why is incoming Solar around 240 instead of around 340 watts per M^2? TSI is about 1360, divide by 4 for geometry, get 340. If it’s a sub-set, why don’t we care about the rest? If otherwise, I’m completely adrift….
Second, Incoming Solar drifting up is surely massive news? How on earth does that reconcile with TSI measurements, which have a sunspot-cycle related pulse, but nothing like the absolute trend you illustrate?
Also, regarding this:
“With the most recent CERES edition-4 instrument calibration improvements, the net imbalance from the standard CERES data products is approximately 4.3 W m−2, much larger than the expected EEI.”
I may have read this differently to you. It seems to me to be saying that the imbalance is consistently flat wrong by a large amount, not that the uncertainty is that size.
In any case, great stuff as usual, thanks for doing this work.
Russell Robles-Thome July 30, 2021 1:58 am
Hey, Russell. The solar number is net of the ~100 W/m2 of reflections, since they are going straight back out to space.
What is changing is the amount reflected, not the solar input.
Your reading is basically correct. My only correction would be the claim that it is consistently wrong by that amount. We don’t know that, because it is likely that there is drift in the results. They have provided no evidence that there is no drift, just a statement saying that:
Note that this is an “estimate” based on an “assumption” about an “appraisal” of an undisclosed personal communication … hardly what I’d call science.
My pleasure,
w.
Willis,
You wrote –
“Note that this is an “estimate” based on an “assumption” about an “appraisal” of an undisclosed personal communication … hardly what I’d call science.”
On the other hand, I suppose you believe in “climate science”.
Or even “political science”, or “social science”. Climate is the average of past weather. It’s a result, not a cause. Hardly what I’d call science, but believers in the mythical GHE probably would.
Are you one of those?
Pass … you’ve proven beyond question you’re not worth responding to.
w.
Willis,
You wrote –
“Pass … you’ve proven beyond question you’re not worth responding to.”
So you lied before, when you you said you were done with me, or just now, by responding, or both?
You don’t have to respond, you know. But you can’t help yourself, can you?
Here’s the thing, Willis. You talk about “energy imbalance” as though it has relevance to something. In this instance, it is completely irrelevant. I point out that the Earth has cooled, and continues to cool – as a result of losing energy at a rate of around 44 TW. I assume you don’t like this, but Nature doesn’t care what you or I think.
And, by the way, as Baron Fourier pointed out, during the night the Earth radiates away all the heat it received from sunlight during the day.
Plus a little of its internal heat, of course. At a rate of about 44 TW.
As to conflating W/m2 with temperatures, that is just stupid. A bizarre delusion. Maybe you don’t believe me?
If I have two containers, each radiating 300 W/m2, what temperature are their contents? You cannot say. Even worse, you can’t even say if either one is radiating more than it is receiving or vice versa. You have insufficient information.
Delusion certainty leads to nonsense of the following sort –
“Atmospheric CO2: Principal Control Knob Governing Earth’s Temperature.”
How are you going with actually quoting people before you call them liars? Or does patronising condescension only flow one way?
Feel free not to respond. Others may form their own opinions about whether I am right or wrong.
Constant streams of bafflegab, never responding to the points that others make, quick to insult anyone who doesn’t agree with the nonsense you are selling.
I agree with Willis, you aren’t worth responding to. When you decide to grow up, please come back.
BTW, are you related to Zoe, your style is identical to hers.
MarkW,
You wrote –
“I agree with Willis, you aren’t worth responding to. When you decide to grow up, please come back.”
Why do you bother, then? Responding, that is.
Do you hope that everybody is as stupid as you, and that nobody will notice you just make stuff up, rather than having the courtesy to quote my exact words?
I hope you don’t think that I am offended by your silly demand. I decline to take offence, as a rule, and I am not going to make an exception for uncouth dimwits who whine about things they are too gutless to actually quote.
Off you go, precious. Feel as offended as you like. If you wish to discuss physics, facts, and all that testable stuff, go your hardest.
You can’t, can you. Like Willis, you are all mouth, and no trousers. Oh well, I’m glad you won’t respond. Saves me from pointing out that you are just another climate crank.
I won’t go back on my word by responding to that moron troll, so I will just comment to you, Mark and the WUWT public in general…
The GHE could never have prevented cooling. By definition it can only delay cooling. So, logically the GHE must have delayed the cooling of the earth from an initial state where its temperature was much hotter than today to the current state where its loss of heat by radiation is essentially balanced by incoming radiation from the sun. (Evidenced by a nearly constant average surface temperature).
In the current situation of virtual balance, minor factors in the earth climate system can cause warming or cooling of the surface. That has nothing to do with the interior of the earth cooling over billions of years.
The amount of heat that escapes through the excellent insulator of the crust is probably pretty close to the amount of heat generated by radioactive decay plus tidal friction, although I wouldn’t be too surprised if it fluctuates and has some minor effect on the energy balance. I’m skeptical of Monckton’s speculations about undersea volcanoes being a major cause, but won’t doubt that they could be significant.
An effect that slows cooling, which is what the GHE is all about, does not cause any warming. It is the sun that causes virtually all of the warming (trivially, the geothermal flux that adds heat at the surface is also inhibited from radiating to space).
If the sun’s output doesn’t change, but the inhibition of cooling is increased, then that allows the sun to warm the earth more. And of course there are other factors besides GHG concentrations that can change the balance between incoming and outgoing radiation. For example, decadal and centennial period ocean current cycles affecting cloud cover.
It’s obvious that the newest sock puppet doesn’t care to discuss this rationally and only revels in derailing other people’s rational discussions.
Rich,
You wrote –
“If the sun’s output doesn’t change, but the inhibition of cooling is increased, then that allows the sun to warm the earth more”
No, it doesn’t. As you also wrote –
“The GHE could never have prevented cooling. By definition it can only delay cooling.”
And after four and a half billion years, the Earth has only cooled to its present temperature (mainly due to the asymptotic depletion of radiogenic heat producing isotopes).
Even though nobody has actually managed to define the GHE in any useful scientific manner, maybe you could provide your definition. No one seems to be claiming that the GHE exists in the absence of sunlight, when the surface cools.
Maybe you could also explain why the hottest parts of the surface (arid tropical deserts) are those places with the least amounts of the supposedly most important GHG, H2O.
On the other hand, you can just call me a moron troll, not quote me directly, and avoid reality. Or just call me a liar. Like Willis did. I don’t mind. Others can look at the facts, and your response or lack thereof, and make up their own minds.
Fair enough?
“On the other hand, you can just call me a moron troll, not quote me directly, and avoid reality. Or just call me a liar.”
OK, now we are getting somewhere.
I was wondering, are those the only possibilities?
I think not.
What about d**khead?
D**chebag?
@ur momisugly$$clown?
I think you are not open to exploring the full range of possibilities to be considered.
Nicholas,
If you are attempting to be gratuitously offensive, it only works if your target can be bothered being offended. I can’t. Why feel offended, insulted, annoyed, bullied, or the like, if I don’t want to?
Most climate crackpots seem addicted to being stupid, and avoiding reality. You wrote – “I think . . .” – possibly over estimating your intellectual capacity.
So, asking you to explain why the hottest parts of the surface (arid tropical deserts) are those places with the least amounts of the supposedly most important GHG, H2O, might be well beyond your ability.
Feel free to try, anyway. If you can’t work it out for yourself, and can satisfy me that you have exerted yourself even a little, I will help you if you cannot understand the physics involved.
Or you could pointlessly try to annoy me, I suppose.
LOL!
Nicholas,
No explanation then?
I thought so.
“Before taking important actions, especially in battle, Romans conducted animal sacrifices to discover the will of the gods according to the information gathered through reading the animals’ entrails”
Like climate science, success in real science got hijacked by those desperate to be somebody. Armies would raid the local livestock near the battlefield. The entrails would be inspected to see if they should battle. Pretty sure that they were looking for worms.
From the article: “So that is the uncertainty in the imbalance … ± 4.3 W/m2. Makes determining the top-of-atmosphere (TOA) energy imbalance somewhat problematic, given that it is less than 1 W/m2 …”
And the people making these claims knew all this to start with.
It looks to me like they are putting out deliberate lies. Easily falsified lies. Well, easy for Willis. 🙂
So no tipping points then?
This will not go over well.
I would think the 14% increase in greening of the earth over the last few decades would cause a change in energy balance
“The observed trend in Earth’s energy imbalance (TEEI), a measure of the acceleration of heat uptake by the planet, is a fundamental indicator of perturbations to climate. Satellite observations (2001–2020) reveal a significant positive globally-averaged TEEI of 0.38 ± 0.24 Wm−2decade−1, but the contributing drivers have yet to be understood”‘
–
Points to stress.
There should not be any TOA imbalance.
Ever.
TOA is defined as where energy in equals energy out
–
What does heat uptake by the planet mean?
Earth’s energy imbalance (TEEI).
It means that contrary to the laws of physics the planet is taking up and storing heat instead of releasing it back to space.
–
In equilibrium this cannot happen.
The planet as a heat receiving object
[Caveat please do not use clouds seas atmospheres or internal heat arguments]
is subject to the normal laws of physics.
–
If it is heated by one candle it emits 1 candle
If it is heated by one sun it emits 1360 W/M2 or whatever the Sun chooses to produce that day.
It does this as a cold rock when it first meets the sun.
It does this if it is Swenson”s cooling magma.
–
It does this as a warm planet as long as the sun is shining.
The heat coming into the earth each second or each year goes out at the same amount and rate.
–
Willis likes examples.
Turn the sun off
What will happen?
The power will go out until the last drop of power coming in from the sun at that moment has gone.
–
The reason why there is so little variation is that what the clever chaps are measuring is there own standard deviation of noise.
–
“It is MEASURED, not calculated but MEASURED, by instruments on a satellite.”
–
Unfortunately we do not have true and accuratedata provided by CERES. Or any other Satellite system.
Willis is right re the data being measured by the satellites.
Elsewhere though we find, either Dr Roy Spencer or Gavin and others that the satellites, despite claiming full global coverage, lack two things.
They find it hard to get consistent data from polar regions.
They are absolutely wrecked in their estimations by any important cloud cover to the point that they actually do estimates rather than observations from such areas.
Consequently all CERES measurements are part observation and part guessed observation.
–
The reason why there is so little variation is that there is nothing to vary.
I have asked people to explain to me why the earth acts differently to any other irradiated object in the universe.
Why when it has a set source of power it is allowed to siphon off and store energy from the sun.
It is not acting as a generator.*
There is no mechanism to hold back the energy, none.
The fact that the earth surface [mm] Ocean surface [metres]
and atmosphere [100 kilometers]
are warm is due to the fact that they are emitting the energy back that they just received.
–
If no one can rebut these ideas I would like to do an article on this.
–
No point in doing so if rebutted
I understand what you saying. However photosynthesis stores energy in the sugars it makes.
Steady State, Equilibrium, and Imbalance for Systems Open to Energy Flows
The Law of Physics of interest is conservation of energy. In the physical domain, conservation of energy is always, at all times and for all spatial locations exactly satisfied.
The local-instantaneous foundational formulation of conservation of energy is never in imbalance; the time rate of change of the energy content is exactly balanced by the results of all the driving potentials acting to change the energy content.
For systems open to energy flows, incoming and outgoing energy at the boundaries of the system is not required by energy conservation to be “balanced” at the local-instantaneous level. None the less, energy is always conserved.
To speak of an imbalance, the macro/meso scale of the <em>state</em> of the system of interest has been assumed/hypothesized to be at some idealized theoretical state. In the physical domain the state of the system is determined by the state of all the sub-systems that constitute and interact with the system of interest. The outgoing energy is completely and solely determined by the physical phenomena and processes underway internal to the system.
The <em>state</em> of the system of interest, including the state of all the sub-systems that interact with the system of interest, at the interface and within those sub-systems, must be fully and completely specified. Including, especially, the physical phenomena and processes that can affect the outgoing energy.
For Earth’s climate systems, the energy states of all the sub-systems vary over wide ranges of time and space scales. Energy is always conserved and the local-instantaneous fundamental formulation of the energy equation is always balanced. Thus, in order to invoke some kind of imbalance, averages over time and space must be also invoked. The time span of the averaging must be specified. Importantly, the effects of the sub-systems that interact with the system of interest over the averaging time span are also required to be specified.
For the case of the response function of interest being an average temperature over the specified time period and the spatial scale of the entire planet of Earth’s atmosphere, the assumed states of all the sub-systems that interact with the atmosphere must also be assumed to be at idealized states, or unchanging. Whatever the case, it must be explicitly stated.
To date, the spatial average is over the entire planet. However, the time-scale over which such averages should be considered is kind of fuzzy, and basically unspecified. Given the extremely massive energy content of Earth’s oceans, and associated effects relative to energy transport and storage, time-averaging might require consideration of a truly long time span.
To determine if the assumed hypothetical system state correctly corresponds to the physical domain it is necessary to show that the empirical time-and-space averaged response function agrees with idealized state of the system. For example, do available data indicate that the idealized conjectural state of Earth’s atmosphere indeed corresponds to empirical data over the averaging time period. But, first of all, exactly what is the span of the time-averaging?
I find that many discussions of an idealized hypothesized <em>state</em> of Earth’s atmosphere are deficient in many of the aspects summarized above. In general, all the assumed/hypothetical properties and characteristics of the effects of all the contents and interactions between sub-systems and the system of interest must be explicitly stated. And most importantly of all, ultimately validated.
ooops, what happened to the <em>s ?
Kindly fix. Thanks
Dan, good to hear from you. Under the new WordPress system, you can’t use inline hypertext. You have to use the “I” button at the bottom.
Also, if you hover over the text, at the lower right of your comment you’ll see a gear wheel. Click that, click “Edit”, and you can fix it yourself.
Finally … thanks for an interesting comment.
w.
Interesting Willis.
I did a crude overlay of the UAH LT data and EEI in your Figure 5.
If you have time, maybe you could post a better version.
Regards, Allan
Both the UAH LT and the EEI are a measure of the energy in the atmosphere. It would be surprising if they did not correlate.
w.
The interesting part is where UAH LT and EEI DO NOT correlate.
My first guess is Pacific Ocean cycles get out-of-phase with EEI and correlation fails.
The major parameters that drive global temperature are the Nino34 Index and aerosols for century-scale volcanoes (VEI6 and some VEI5’s).
So what drives Nino34 – it appears in part to be EEI.
________________________________________
CO2, GLOBAL WARMING, CLIMATE AND ENERGY
by Allan M.R. MacRae, B.A.Sc., M.Eng., June 15, 2019
https://wattsupwiththat.com/2019/06/15/co2-global-warming-climate-and-energy-2/
[excerpts]
This formula works reasonably well back to 1982, which is the limit of my data availability.
5. UAH LT Global Temperatures can be predicted ~4 months in the future with just two parameters:
UAHLT (+4 months) = 0.2*Nino34Anomaly + 0.15 – 5*SatoGlobalAerosolOpticalDepth (Figs. 5a and 5b)
6. The sequence is Nino34 Area SST warms, seawater evaporates, Tropical atmospheric humidity increases, Tropical atmospheric temperature warms, Global atmospheric temperature warms, atmospheric CO2 increases (Figs.6a and 6b).
clear as ink
“PLEASE quote the exact words that you are discussing.”
You ask this every time. I’m curious how often it actually happens?
More often than you might think, less often than I might wish …
w.
Well Willis, the first half of that is slightly encouraging tbh.