Reposted from The Cliff Mass Weather Blog
During the past week, the Pacific Northwest experienced the most severe heat event of the past century.
All-time high-temperature records were broken throughout the region, often by large margins. Many in the media, several local and national politicians, and some activist environmental scientists have claimed that this event was “driven by” or predominantly forced by human-inspired global warming (usually referred to as “climate change”).But such global warming claims are not supported by the facts and our best scientific understanding.

Truth and Rigorous Science About Climate Change is Necessary for Wise Decisions
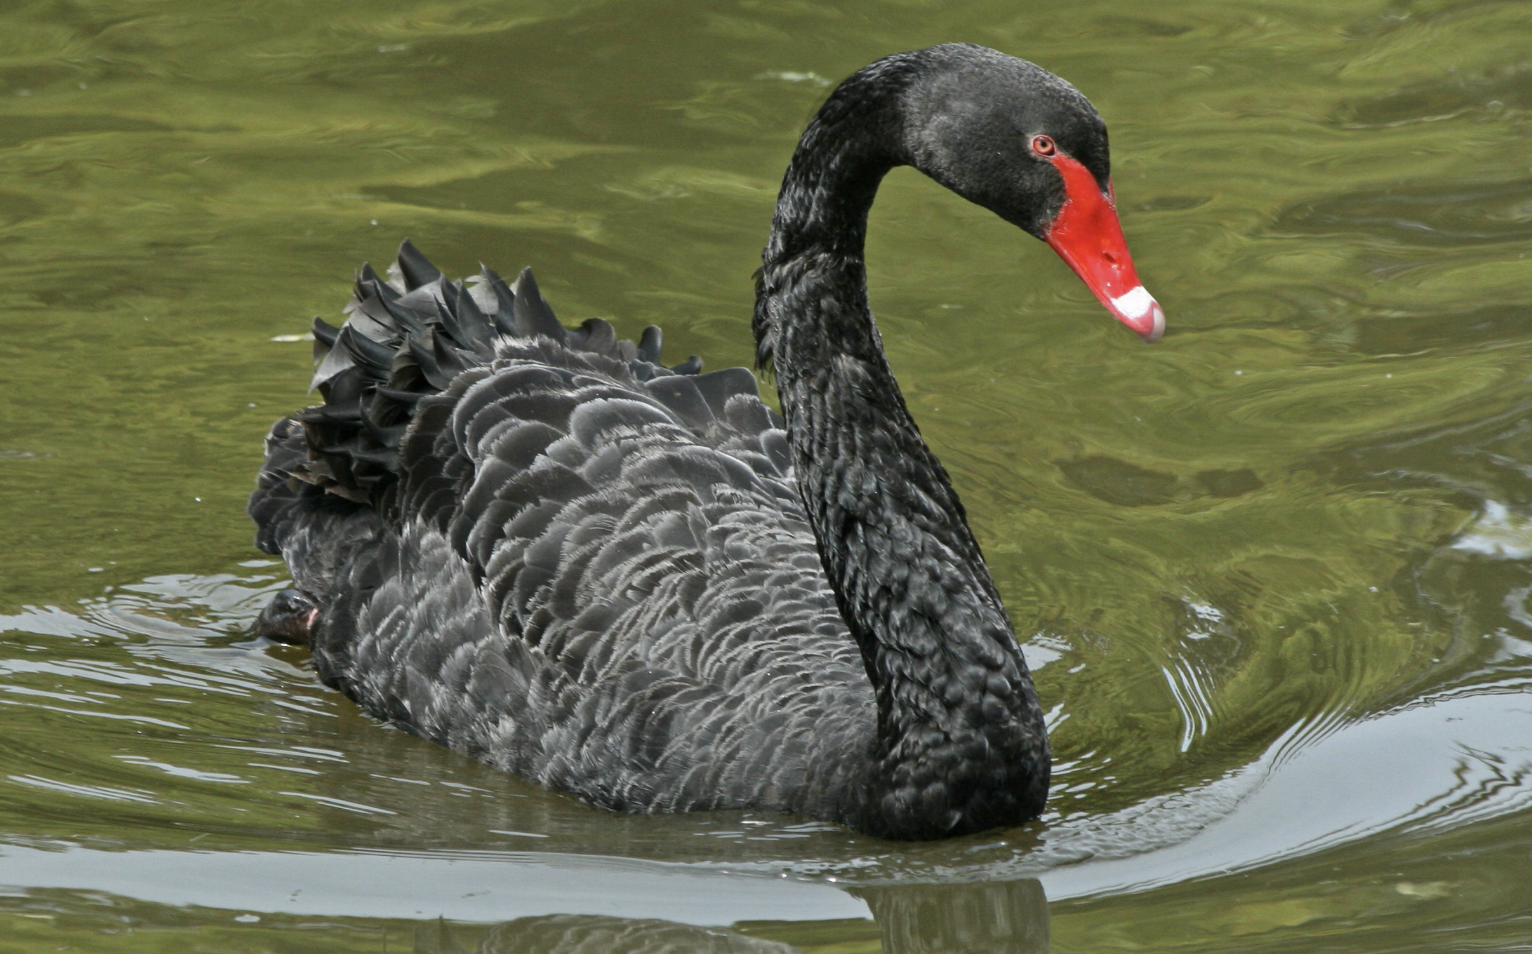
In this blog, I will use observations, modeling, climatological data, and the peer-reviewed scientific literature to demonstrate that human-caused global warming played a very small role in the extreme heat event that we just experienced here in the Pacific Northwest.I will describe the origins of a meteorological black swan eventand how the atmosphere is capable of attaining extreme, unusual conditions without any aid from our species.As you read this, consider that I have actively pursued research on Northwest heatwaves, published several papers in the peer-reviewed literature on this specific topic, and have run both weather prediction and climate models that simulate such events. This subject is in my wheelhouse.
I also discuss the seriousness of misinformation. You and others can not make wise decisions when the information provided to you is not based on truth and science.


This is going to be an extended, detailed blog, a necessity if you are going to truly understand the science and the situation. Superficial, hand-waving arguments will not allow you to comprehend the truth, particularly when so many “facts” communicated in the media and among activists are inconsistent with the best science.
The Event
The maximum temperatures during the heatwave were as high as 30-40 degrees Fahrenheit above normal. Seattle had a high of 108F, 35F above the normal high of 73F. Quilluyte on the Washington Coast zoomed to 109F compared to a normal high of 65 (44F above normal). Throughout the region, all-time temperature records were broken, representing the hottest day on record at many locations.
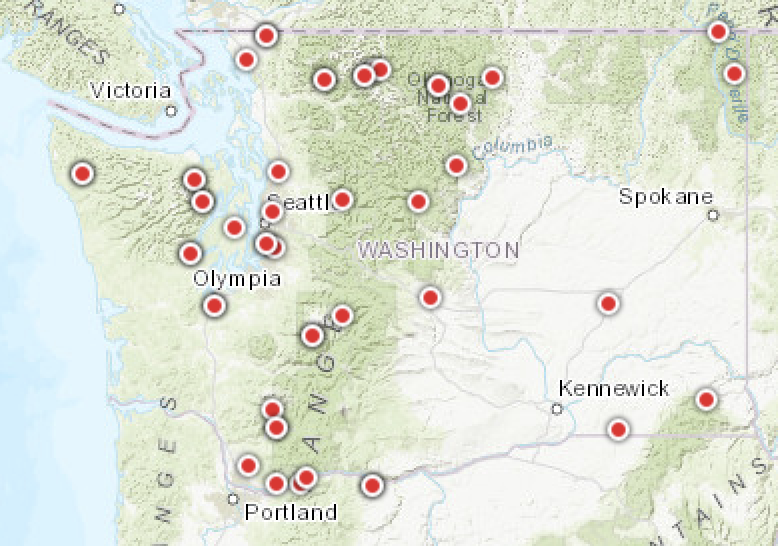
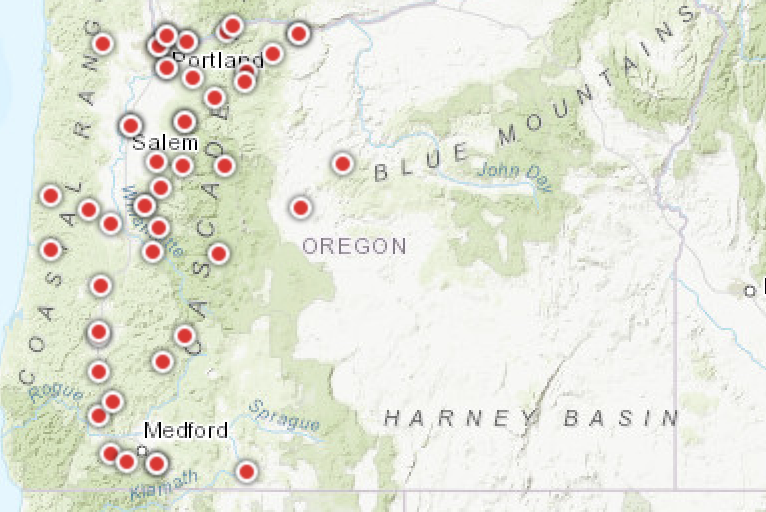
The map below shows where the all-time temperature records were broken, mainly west of the Cascade crest.
These high-temperature records occurred in late June, which is atypically early in the summer, with previous high-temperature records occurring roughly a month later when the Pacific Northwest climatologically is at its maximum warmth.


All-Time Records for High Temperatures Broken In WA/OR (red dots)
The Global Warming Background
The Pacific Northwest is warming and human emission of greenhouse gases is probably the origin of much of it.
To illustrate, the figure below shows the annual average high temperatures for Washington State from 1900 through 2020. About 1.5 F of warming over 120 years. The summer warming is nearly the same.
Let us assume that ALL of this warming is caused by mankind’s greenhouse gas emissions, although some might argue with that assumption. The warming during the past several decades is consistent with human causation, and climate modeling supports this contention.

So if greenhouse gas warming over Washington State is 1-2F, how can greenhouse gases cause a huge heatwave that is ten to twenty times greater? A very good question. Such a ten-times amplification of the global warming signal would require powerful positive feedbacks, which I will demonstrate below are simply not evident. A global warming origin of increased temperature extremes would also be evident in long-term trends of extreme temperatures, but such trends do not exist.But before we get into such things, you must understand the origins of the extraordinarily high temperatures observed earlier last week.
What Caused the Northwest Heat Wave?
A number of factors came together simultaneously to produce the extreme high temperatures over the Northwest observed last week.
The key factor in this and previous regional heatwaves is the development of an unusually strong and persistent area of high pressure over the Northwest. Such high-pressure areas are also called ridges and often extend vertically through great depth (10-30 thousand feet).
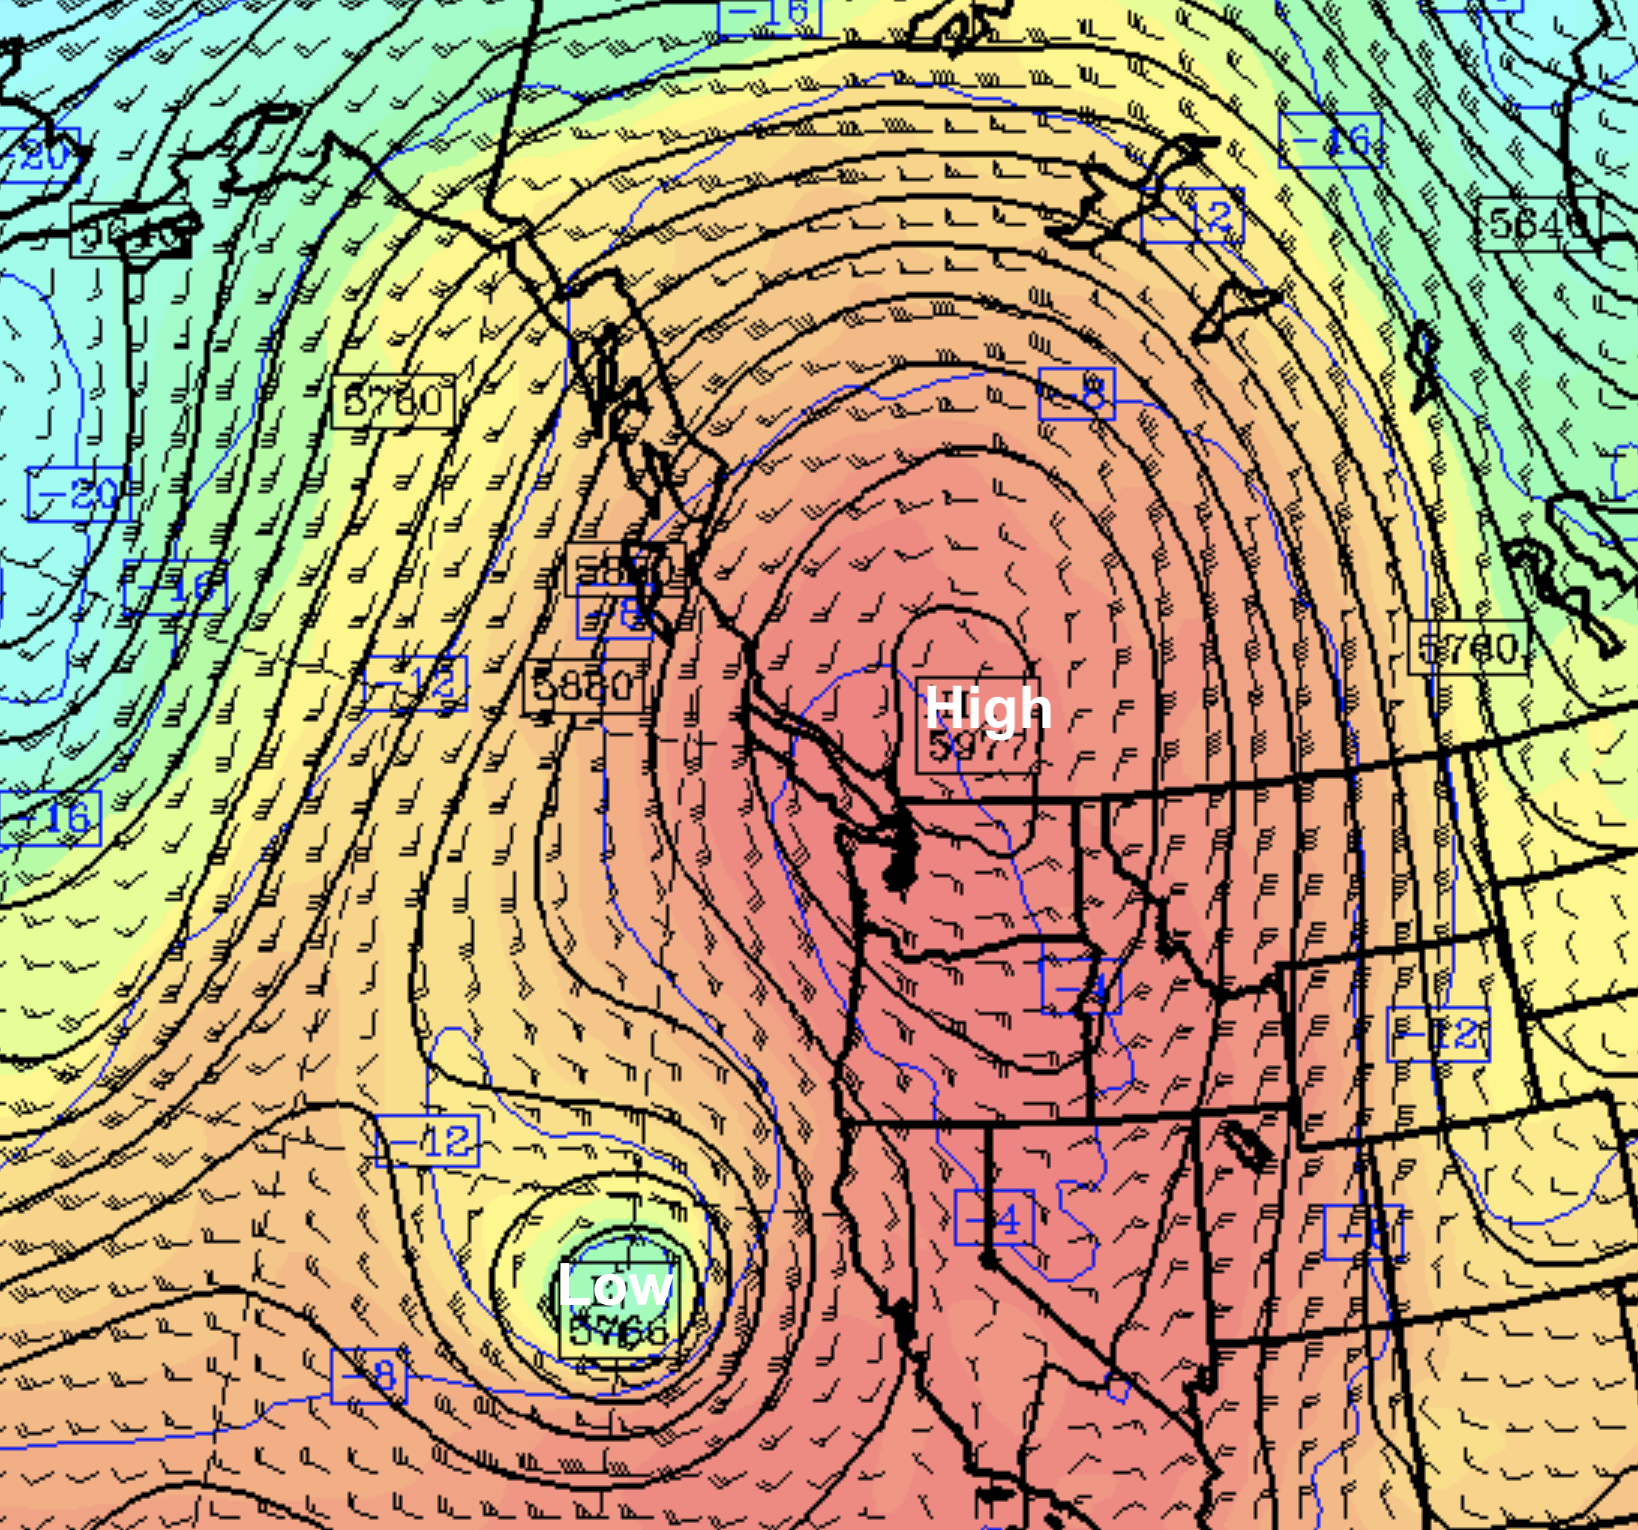
The figure below illustrates what the ridge looked like at 11 AM last Sunday around 18,000 feet above the surface (500 hPa pressure). At this level, the ridge was the most intense ever observed over the region (will prove that later).

Map A
High-pressure areas/ridges are associated with warm temperatures during the summer. First, high-pressure areas possess strong sinking, and sinking causes powerful warming as air is compressed as it descends to the higher pressure that exists at low levels (pressure decreases with height). Your air pump, very warm after inflating a tire, is a good illustration of this mechanism.
Ridges also possess southerly (from the south) flow on their western sides (apparent above), bringing subtropical warmth northwards.
But there is more!
The sinking air in high-pressure areas prevents clouds, thus allowing maximum solar heating (and the sun is near maximum strength now). And on the southern side of upper-level ridges there is often easterly (from the east) wind, which can move down the western slopes of terrain barriers, producing even MORE compressional heating as the air descends the slopes.
It is no accident that every major summer heatwave in our region is associated with a ridge of high pressure. Ridges are veritable heating machines during summer and sometimes are colloquially referred to as heat domes. The media loves this term.
The origin of the intense ridge of high pressure of last week is fascinating.
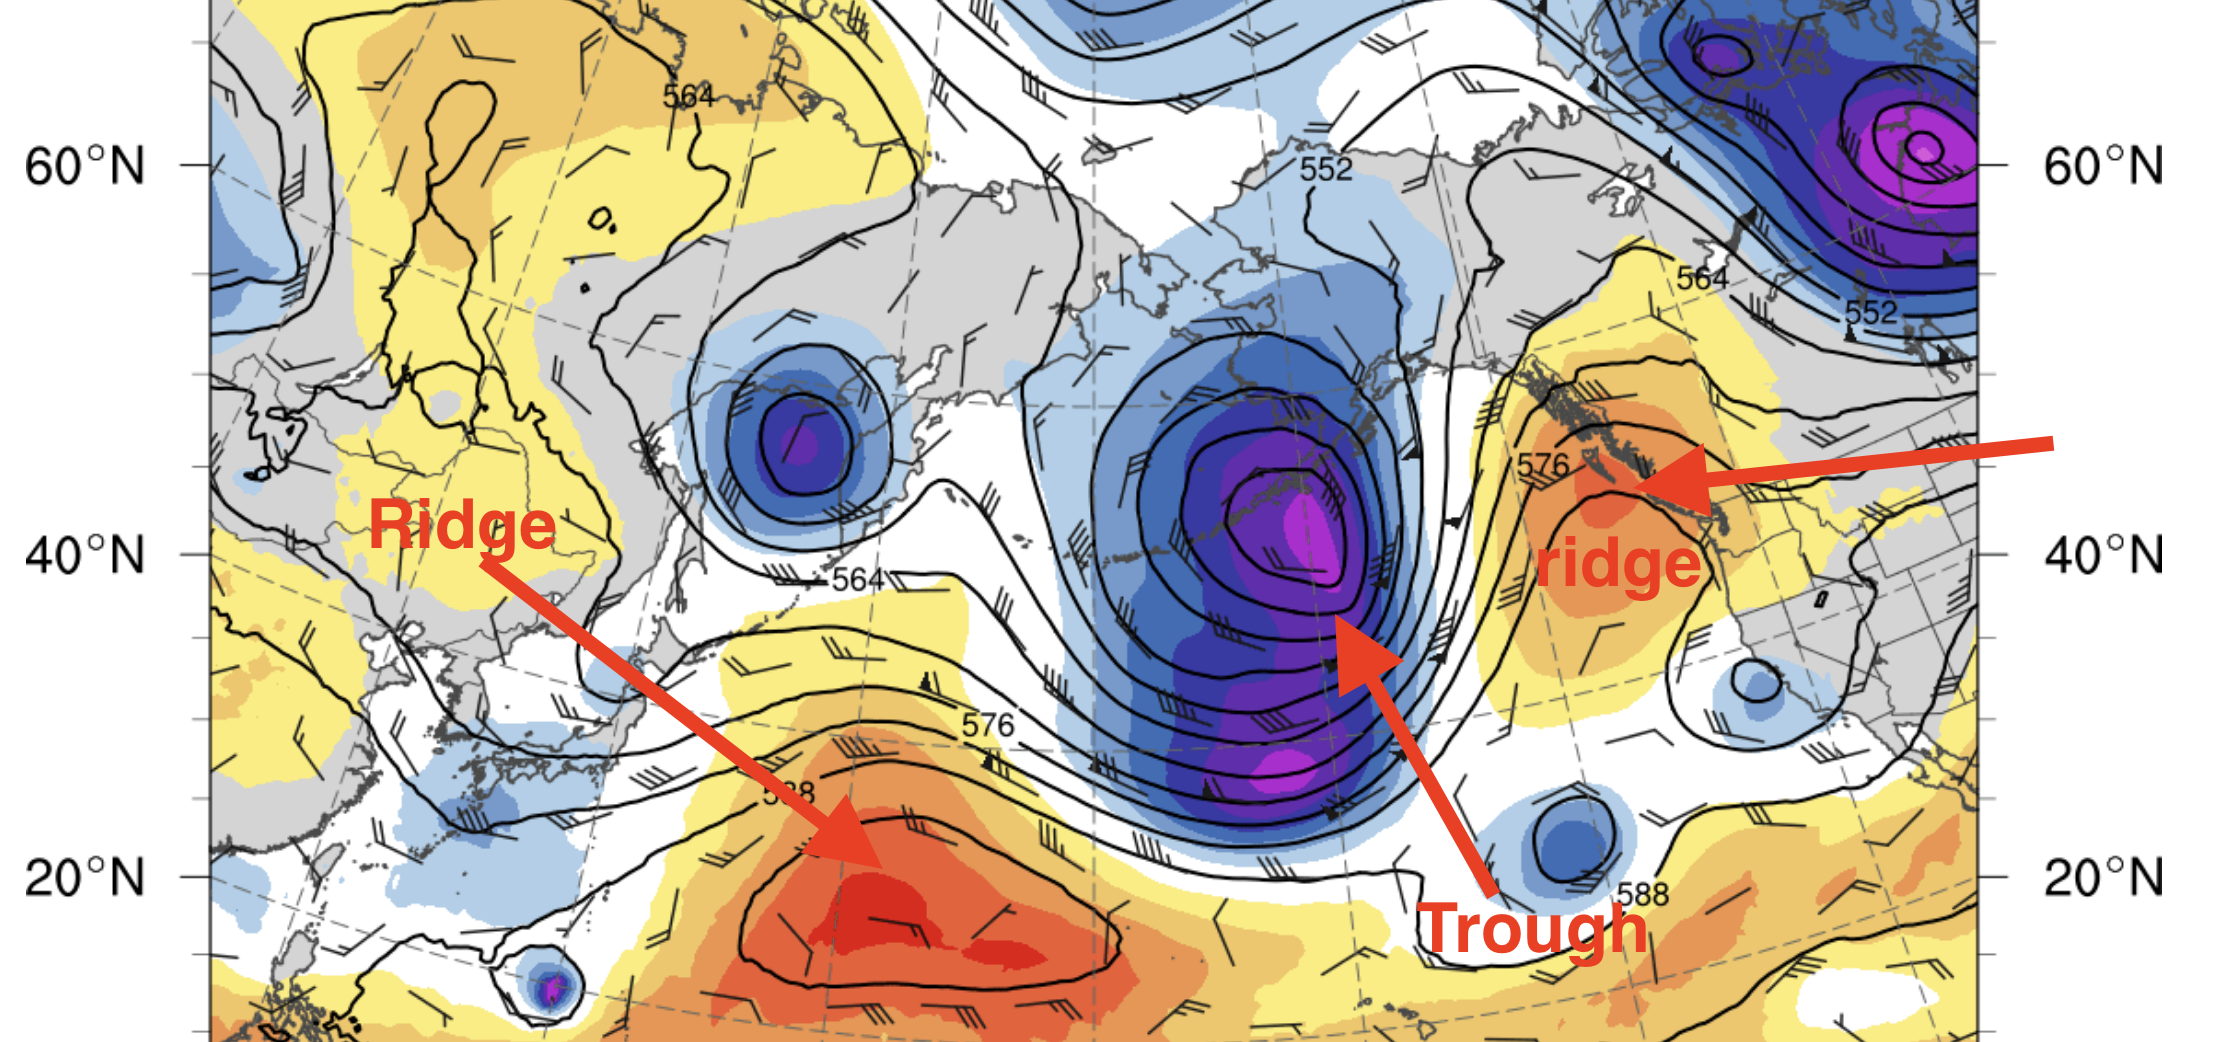
Our ridge appears to have originated in the far western Pacific, where a tropical disturbance rammed into the Pacific jet stream, causing high-amplitude waviness in the jet stream thousands of miles downstream to the east. The result was a strong ridge over the Northwest, with the waviness also producing a deep trough over the central Pacific (see upper-level map on Wednesday, June 23rd, 500 hPa pressure–about 18,000 ft).

Blue and purple indicate much lower than typical pressures (troughs or lows), red indicates above-average values (ridges or highs). You can see the waviness of the atmosphere over the north Pacific from Asia to North America.The Atmospheric Heat Supercharger
In our heatwave, there was a feature that supercharged the warming west of the Cascade crest and the coastal mountains (e.g., the Olympics): an approaching upper-atmospheric low-pressure area (or trough) that was west of northern California in Map A above.

Our high-pressure ridge (“heat dome”) had a potent supercharger. Picture courtesy of Nick Ares.
Between the offshore trough and the ridge over the Pacific Northwest, there were strong southeasterly (from the southeast) winds that pulled up air from the warm desert Southwest. This air subsequently descended the western slopes of the Cascades, where the air was further compressed and warmed.
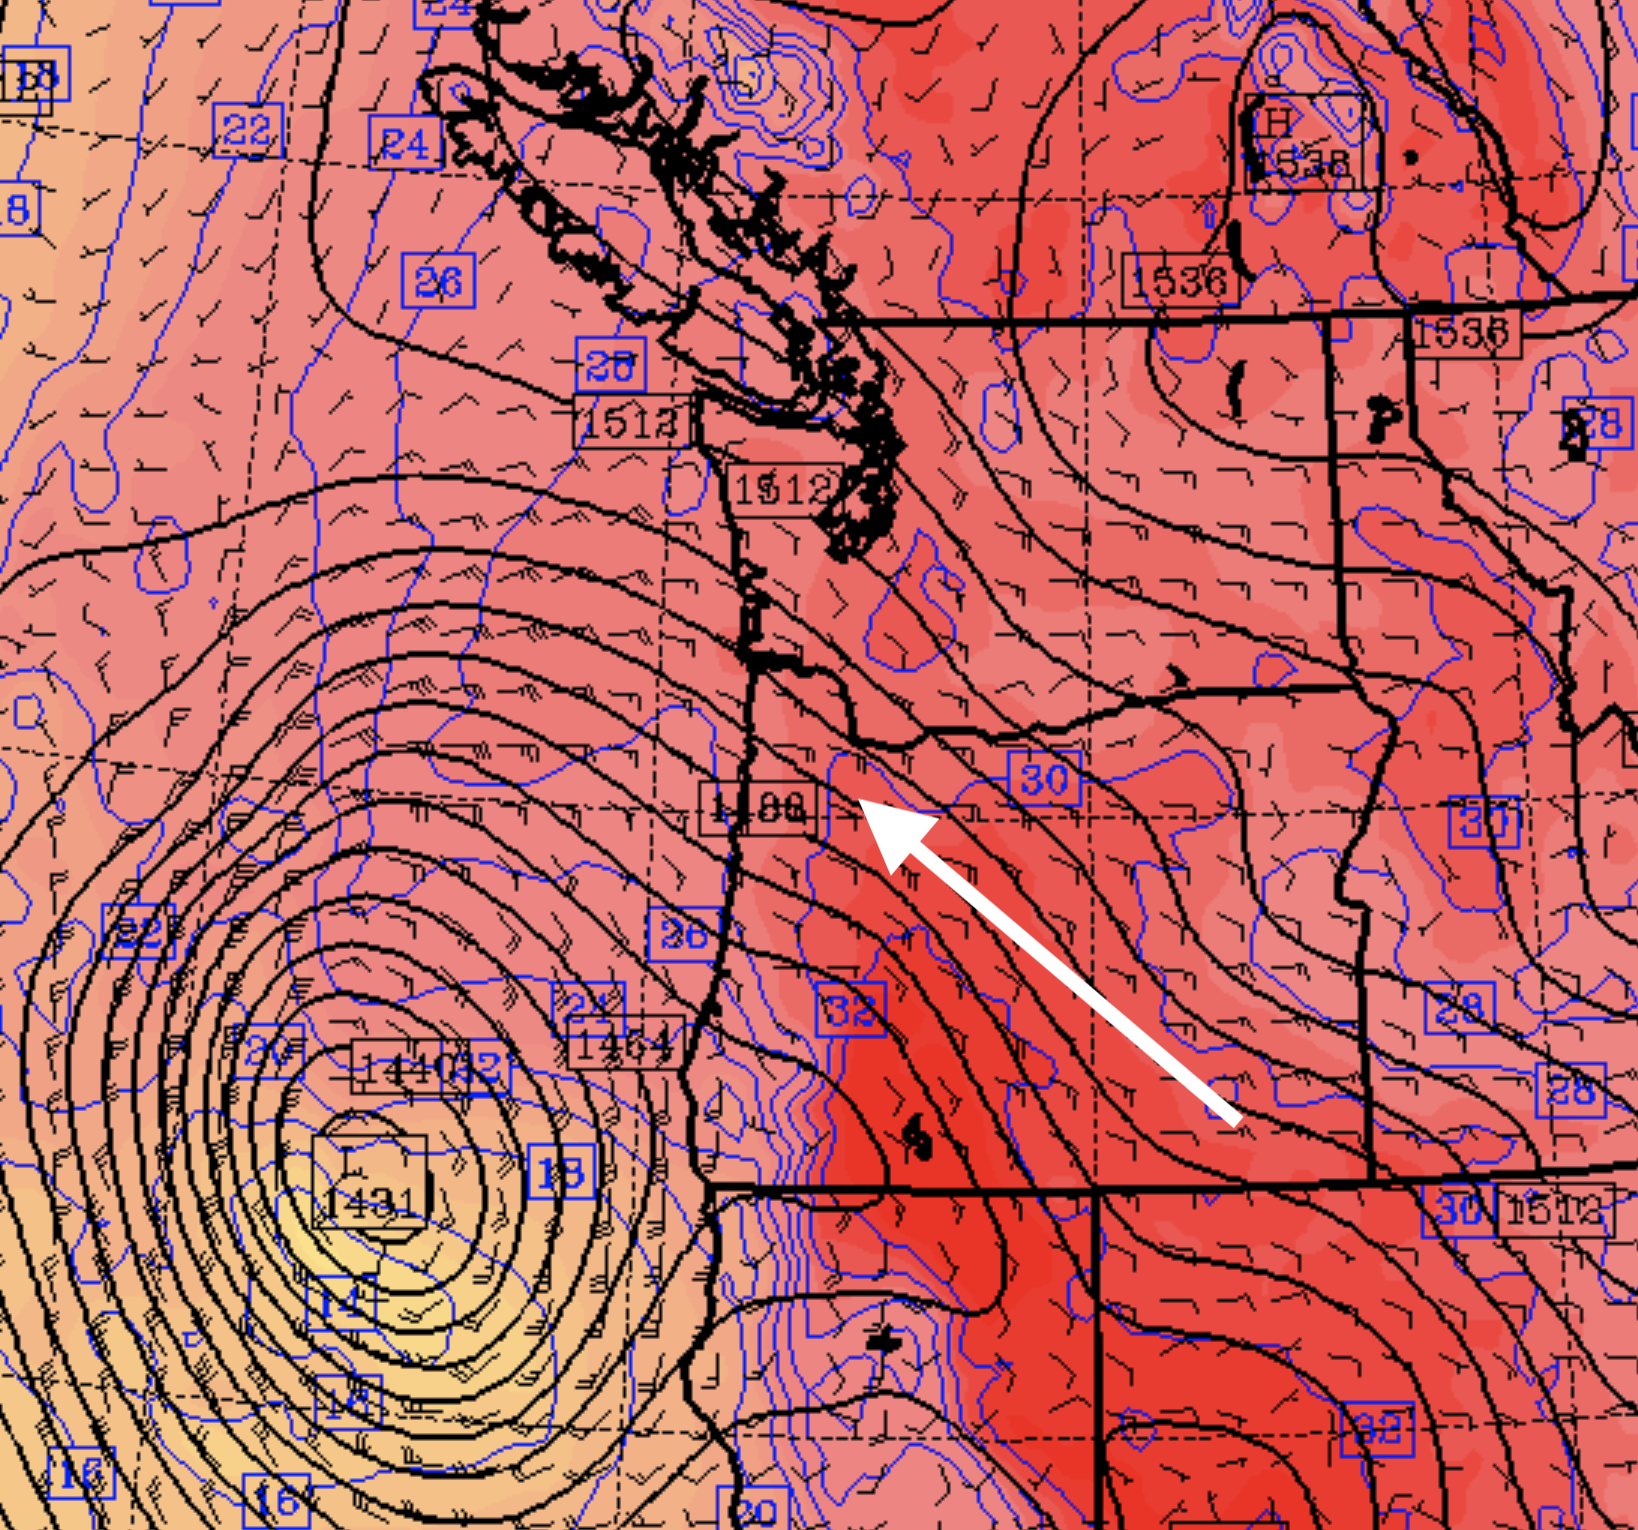
You can see this “supercharger” in action on Monday afternoon in a forecast map valid for around 5000 ft (850 hPa pressure level). The colors indicate temperatures (darker red is warmer) and winds are also shown. You can think of the solid lines as representing the pressure at that level. Note the low offshore and the high to the northeast. The white arrow shows the warm southeasterly flow that descended the Cascade’s western slopes.

And the impact of the supercharger is seen in the super-warm air (brown colors, 104F, and more) found downstream of the Cascades at 5 PM on Monday, June 28.

Everything had to come together just “right” to give us this extreme event.
Record amplitude of a ridge/high pressure over our region, forced by a tropical disturbance in the western Pacific, that produced a downstream “wave train”. An environment that allowed the resulting wave to amplify. The ridge had to be in exactly the right position relative to our terrain. An upper-level trough had to develop in just the right location offshore and move in the optimal direction to cause strong southeasterly flow, fostering the supercharger noted above. We needed a period when the sun was very strong. And a summer stretch without smoke, which has a profound cooling effect.
The meteorological dice had to come up all sixes. And they did.

This concurrence of a number of factors coming together at one place and time was why the extreme heat occurred, with a very small assist from global warming, which added a few degrees to an already extreme event.
It is important to note that the atmosphere comes up sixes regularly, but not necessarily in the same place. The atmosphere is churning with all kinds of variability inherent in the physics of the atmosphere (also called natural variability).
To illustrate this to you, below is a world map of the temperature anomalies (difference from normal) just above the surface (about 800 m in elevation) on Tuesday, June 29th. You can see our extreme heatwave (red colors),\ centered over the northwest corner of Washington. But there are other large temperature anomalies scattered around the world, both warm and cold. Those are overwhelming NOT the result of global warming, but of natural variability. I could show you a similar map for a date, in say, 1940. It would look the same (I checked).
Extreme temperatures happen all the time in a somewhat random fashion. They just don’t happen where YOU are located very frequently, because so many random mechanisms must come together at the same time to do so.

Natural Variability or Global Warming? Dealing with Unsupported Claims
Since global warming is much smaller than the magnitude of the heatwave temperature extremes observed last week in the Northwest, those trying to ascribe the extreme temperatures to global warming must prove that global warming somehow amplifies natural variability.
For example, some have suggested that the key feature of last week’s heatwave– the extreme amplitude ridge of high pressure aloft– had origins in global warming. Others have suggested that global warming dries the soils, resulting in less evaporative cooling and warmer temperatures, thus explaining the extremes.
We will evaluate the plausibility of these various mechanisms for amplifying global warming and will show that they can not explain what happened last week.
Does Global Warming “Drought” and Dry Soils Explain the Heatwave?
One hypothesis starts with global warming causing drought and dry soils over our region. Then they claim that such dry soils warm the air (less evaporative cooling) enough to explain the high temperatures. Others suggest that the drought increases high pressure as well.
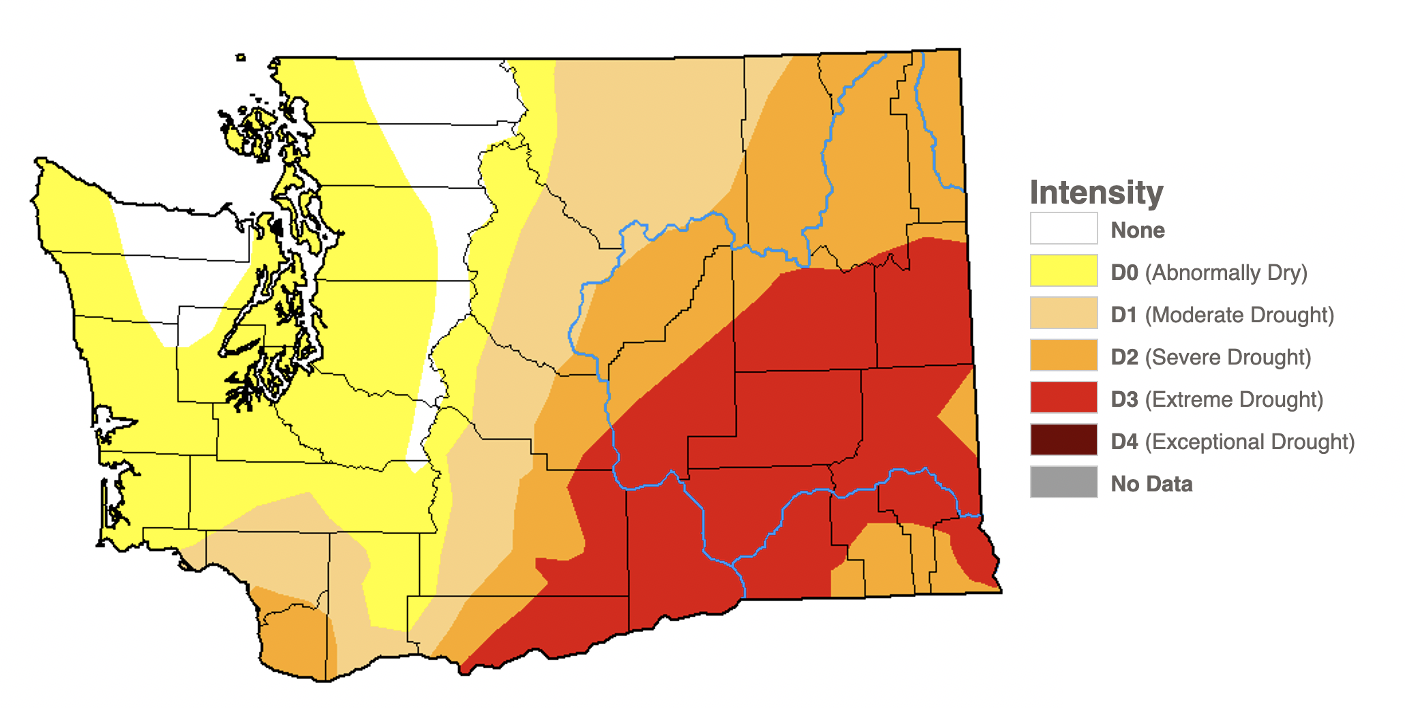
For reference, the NOAA Drought Monitor graphic for June 22nd shows normal or just slightly dry conditions west of the Cascade crest (where the extreme records were broken), but “drought” conditions over the normally dry region of eastern Washington.

The claims that the critical extreme ridge of high pressure was caused by dry conditions east of the Cascade crest are problematic for many reasons, including the fact that the origin of the high pressure can be traced to a large-scale amplification of the wave pattern over the entire North Pacific. Similarly, the claims that dry conditions east of the Cascades were significant in creating the extreme heatwave west of the Cascade crest are also weak. Let me prove this to you.
Model forecasts were stunningly good for this event. Even almost a week out, model simulations correctly predicted the development of an extreme high-pressure area over the Northwest and very high surface temperatures. Modelers like myself can “play god” with such excellent simulations, in this case, by making the soil much moister and seeing what happens. Would the heatwave go away with the absence of drought and under moister soil moisture conditions? You are about to find out.
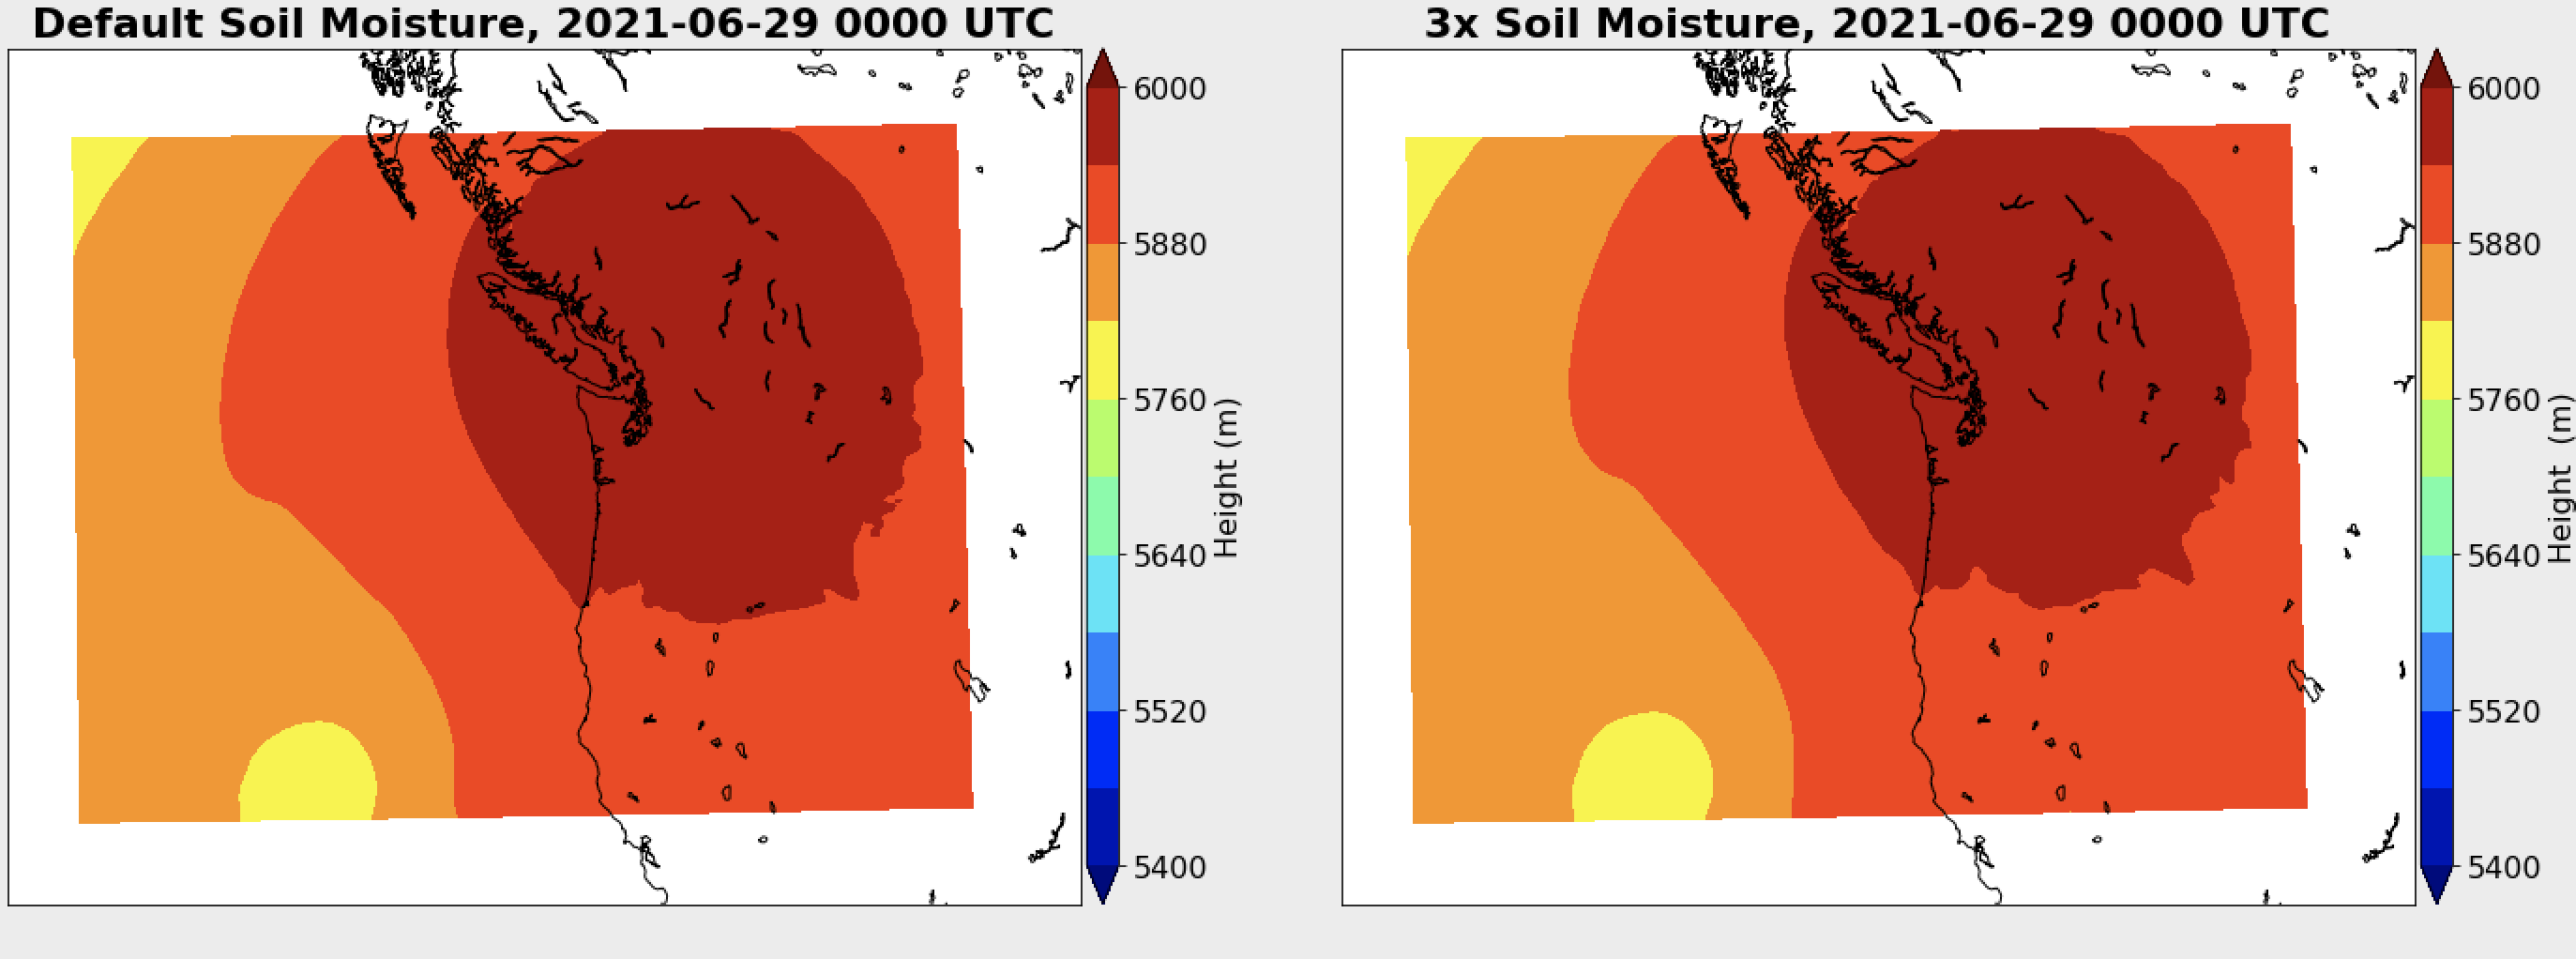
Senior UW graduate student Robert Conrick re-ran the UW WRF weather forecasting model and tripled the soil moisture everywhere. He turned the region into a veritable swamp! And what do you think happened to the ridge of high pressure and the heat dome? Did it disappear? Did the heatwave go away?
The answer: virtually nothing happened to the intense high-pressure area. The heat dome was essentially unchanged. Surface temperatures over BC and western WA hardly changed.
The figure below shows the height of the ridge at 500 hPa pressure (you can think of this as the pressure at around 18,000 ft. The left side uses the actual soil moisture last week, the right side shows the same thing with TRIPLE the soil moisture. Virtually the same heights or pressures.

What about temperatures at the surface? Even with “biblical” moistening of the soil over the entire domain, temperatures over western Washington and British Columbia, where the heatwave was most severe, hardly changed, cooling by about 1 degrees C (about 2F) or less.
The theory of an unusually dry surface produced by global warming “drought” causing the high pressure “heat dome” or greatly warming low-level temperatures west of the Cascade crest appears unfounded.
This makes physical sense for a number of reasons. For example, the lush western side of the Northwest remained relatively moist into the summer. June’s rainfall was well above normal over most of the region west of the Cascade crest. As noted in my earlier blog, the trajectories of the air reaching the surface west of the Cascade crest did not come from the surface over eastern Washington or Oregon but subsided (sank) rapidly from aloft.
But there is something else that essentially puts the silver stake into the heart of the unfounded global warming “drought” theory of this event.
Specifically, there is no observed trend towards “drought” over the Pacific Northwest as demanded by the proposed global warming origin of this event.
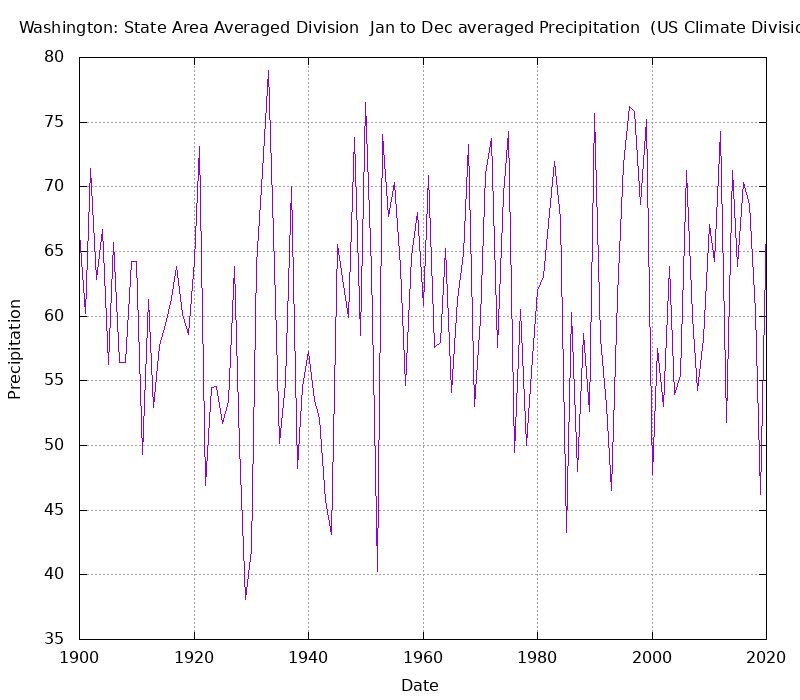
Below is the observed annual precipitation over Washington State since 1900. Our region is NOT getting drier. If anything precipitation has increased a slight amount.

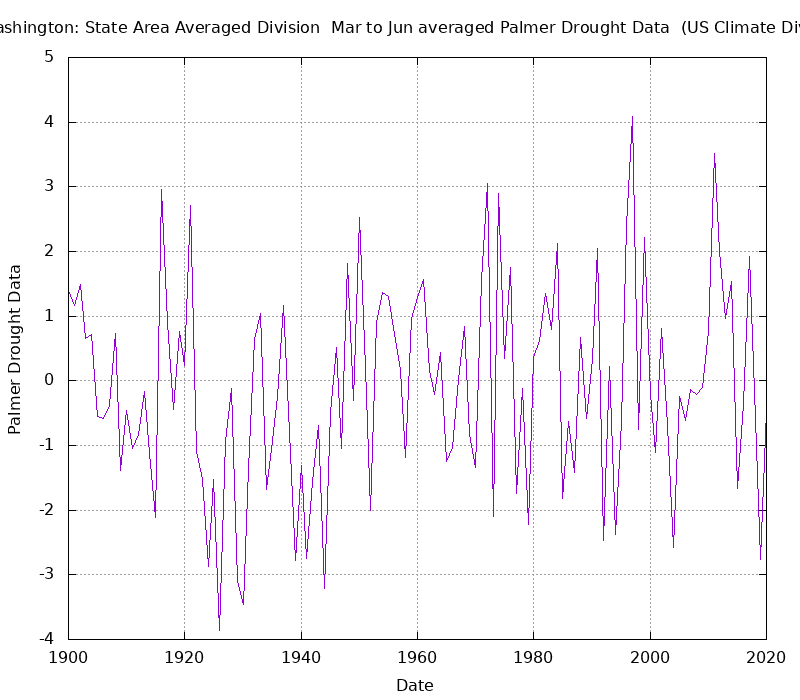
And is spring drought increasing in frequency as suggested by those pushing the global warming hypothesis? The answer is no. Below is a long-period plot of the Palmer Drought Index, which considers BOTH temperature and precipitation. No apparent long-term trend in spring drought…and notice how much worse it was during the 1930s and early 1940s.

So not only does the global warming drought hypothesis for the heatwave fail on a physical basis, but there is no trend in drought, which is a requirement if global warming was the explanation.
Does Global Warming Produce Stronger Ridges of High Pressure?
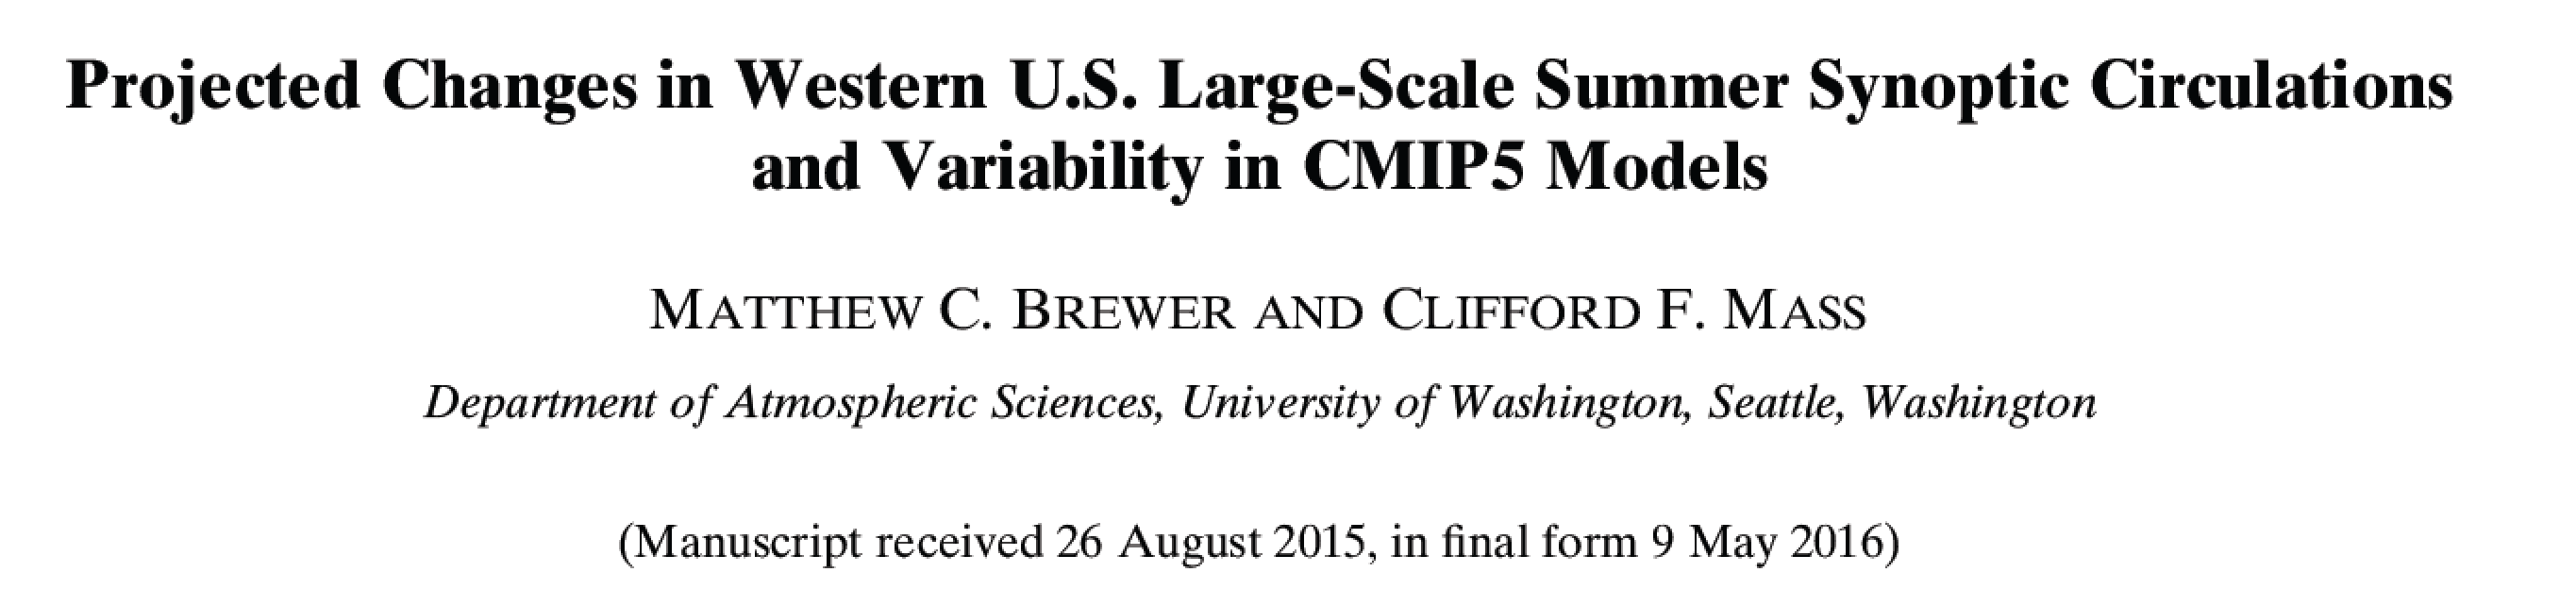
Another claim, provided by Professor Michael Mann of Penn. State and published in the New York Times is that global warming produces a weakened, “lazy” jet stream that forces more wave-like undulations and thus more ridging. This hypothesis has been thoroughly debunked in a number of papers in the peer-reviewed literature (see this article for an example or my blog). But I need not cite others, since I and my students have investigated this very issue in research sponsored by the National Science Foundation and published the research in the peer-reviewed literature.
For example, Matt Brewer and I looked at global climate models driven by rapidly increasing greenhouse gases and found that high-pressure areas like that seen last week will WEAKEN under global warming. Just the opposite of what Professor Mann was suggesting.

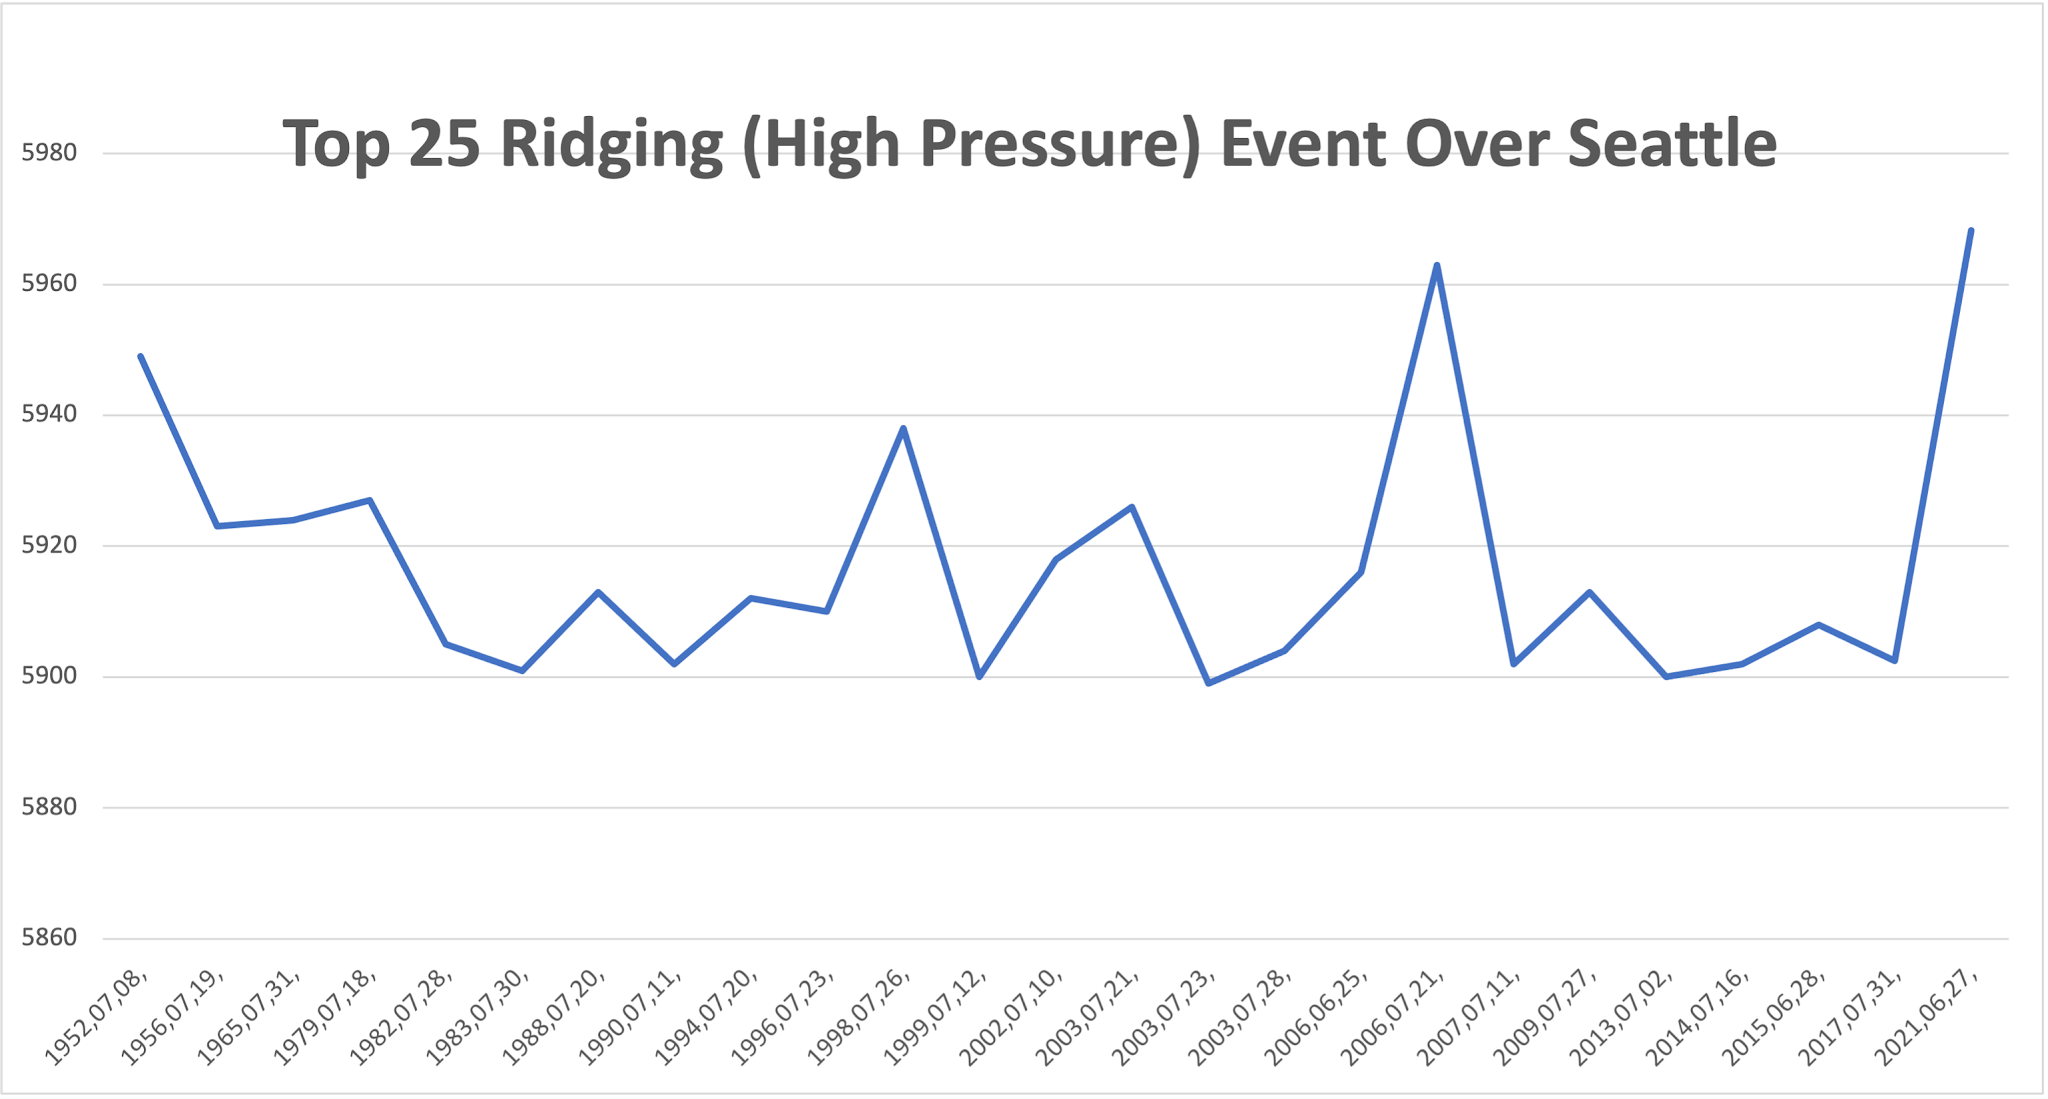
And last week I examined the frequency of high-amplitude ridging over our region from 1948 to today using NOAA reanalysis gridded data. I found no trend in the extreme highs aloft.

As further confirmation, Dr. Joe Zagrodnik of Washington State University examined the radiosonde sounding data (balloon-launched weather stations) at Quillaytate on the Washington coast and found no upward trend in the maximum heights (that is big ridges of high pressure) at 500 hPa (around 18,000 ft) at that location.

Dr. Zagrodnk also did not find any trend in extreme high temperatures in the lower troposphere (around 5000 ft).
Bottom line: none of the claims that global warming increases ridging (high pressure) over time are supported by data or modeling. Unfortunately, Dr. Mann and others continue to push this unfactual narrative.
Perhaps, The Most Compelling Evidence of All
If global warming was producing extreme heatwaves in our region, such as the event last week, there would be a long-term trend towards more extreme high temperatures. A single event does not reflect climate, only a trend or changes in long-term average do.
Well-known climatologist (and the official Alabama State climatologist) Dr. John Christy has run the numbers to determine if there are trends in record-breaking extreme temperatures in Washington State or Oregon.
As shown below, there IS NO INCREASING TREND for more record high temperatures over our region during the past century. In fact, the past decade (2011-2020) had no all-time records. I suspect many of you are surprised at this, but it is true.

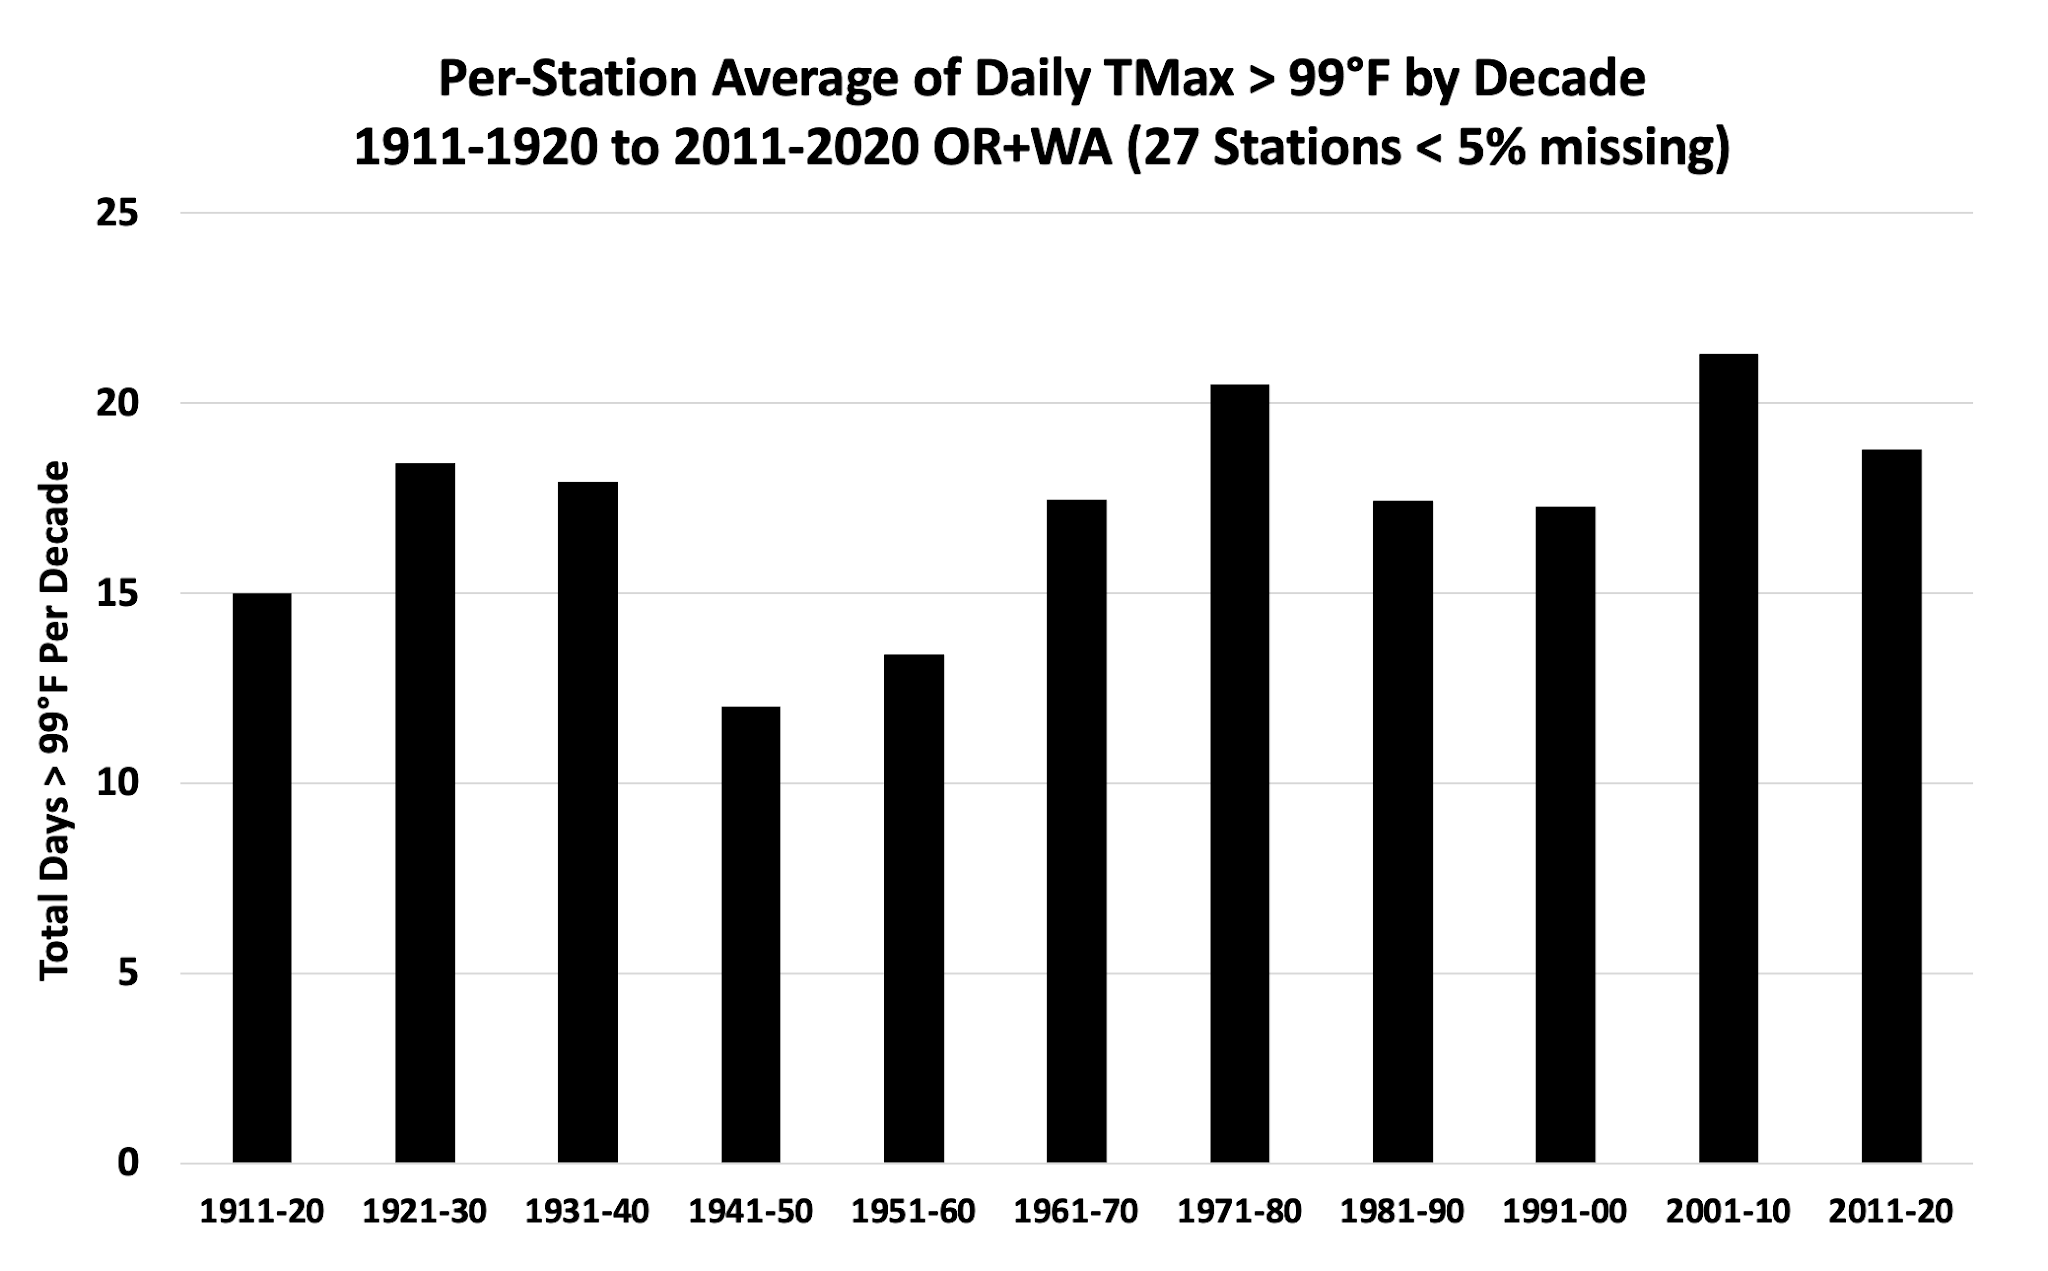
Total number of stations with temperatures about 99F in our region? Also no trend

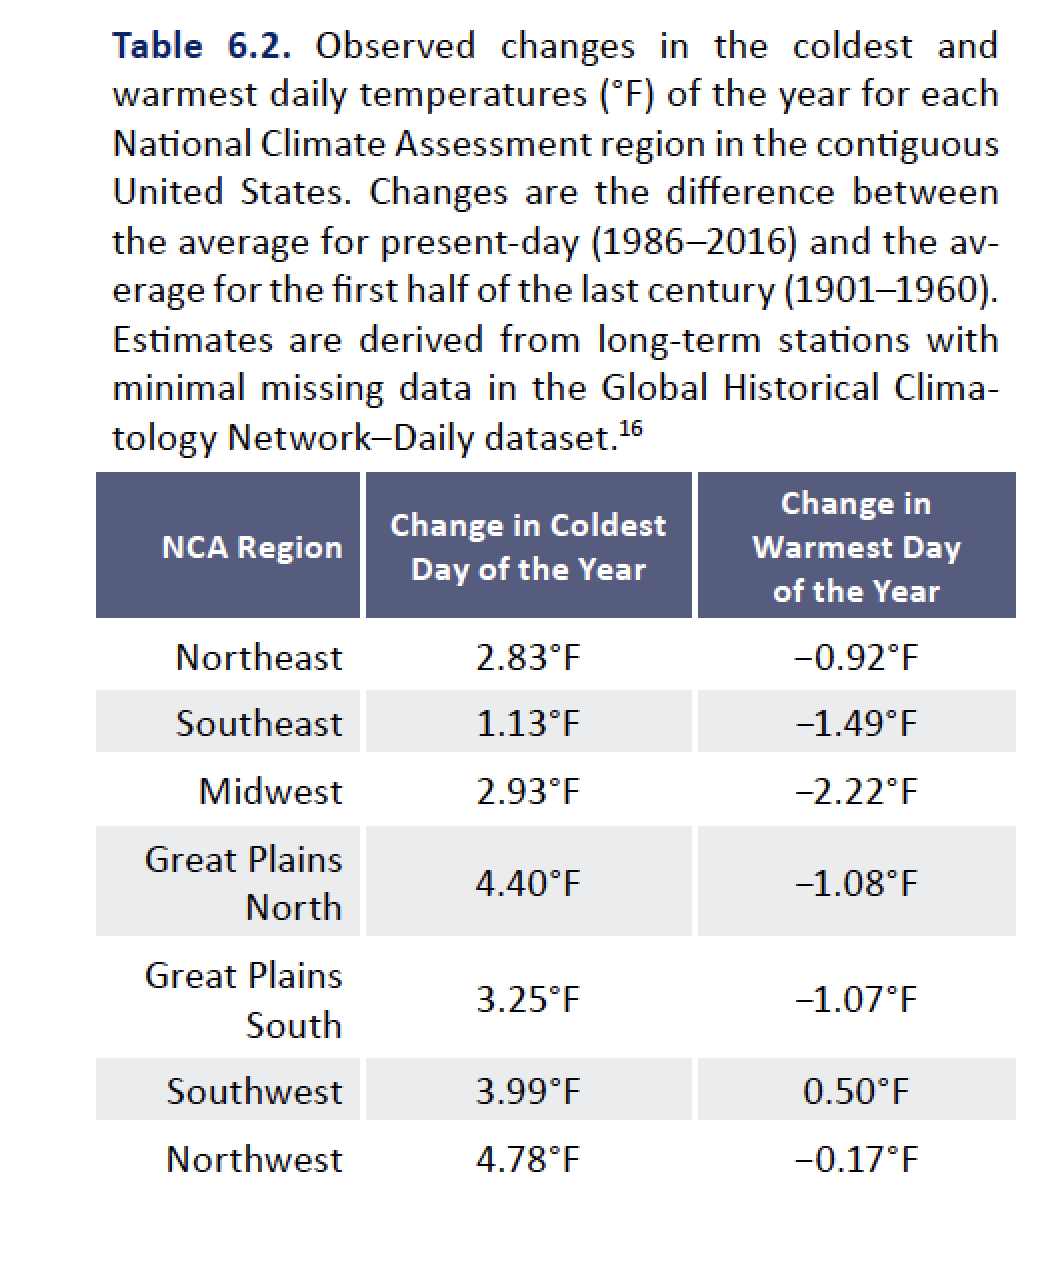
These results are consistent with what others have found. For example, the U.S. National Climate Assessment found the warmest day of the year over the Northwest actually COOLED between a historic (1901-1960) and a contemporary period (1986-2016).

I had a conversation about these findings with Dr. Nick Bond, Washington State Climatologist. He told me he was not surprised, and that he and Associate State Climatologist Karin Bumbaco found similar results, published in a peer-reviewed paper.
You may ask why there is little or no upward trend in record high temperatures even though the region and planet are warming.
There are a number of possibilities. For example, natural variability may be so dominant that a small amount of global warming is hard to notice. Or there may be climate feedbacks that work against extremes in a warming world….at least in our area. I have been researching one of these feedbacks: the tendency of heat-wave producing easterly flow to weaken under global warming and describe it below. And I can think of several more.
Still not convinced? Read on.High Resolution, State-of-Science Regional Climate Models Do Not Suggest A Global Warming Origin of the Extreme Heat
One of my major research projects (with Professor Eric Salathe of UW Bothel and supported by Amazon) has been to run high-resolution climate simulations driven by the most realistic global climate models. And the results are very relevant for this discussion.
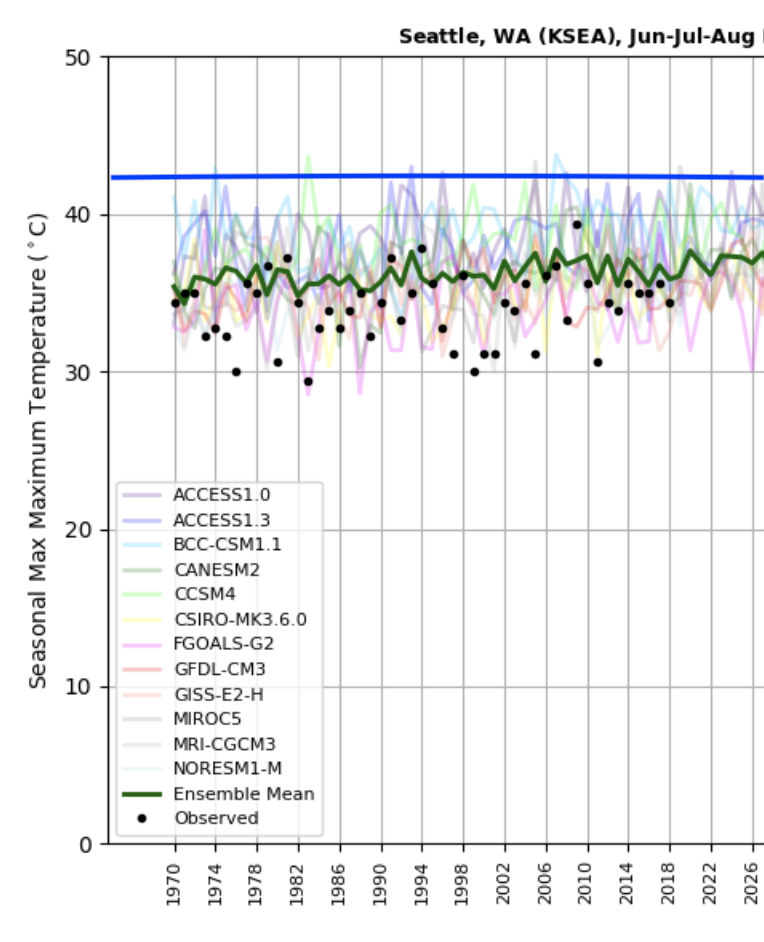
Below is a graphic from this work showing the extreme high temperature each year at Seattle Tacoma Airport by an ensemble of 12 regional climate simulations (12-km grid spacing—VERY high resolution for climate work) driven by a highly aggressive (and unrealistic) increase of greenhouse gas emissions (RCP 8.5). These simulations started in 1970 and each forecast is shown by a different color. The green line is the mean of the regional forecasts and the observed highs are shown by black dots. I have indicated SeaTac’s high temperatures this year (108F, 42C) by the blue line.

You will notice two important features of these regional climate projections.
First, and of great importance, there is little upward trend in the extreme high temperatures.
Second, the most extreme temperatures of the ensembles over the entire period climbed to about 42C (108F). To do so, required rare, but possible, combinations of several factors. Improbable, but possible. You might also notice that the climate model was typically about 1-2C to warm. I believe that reflects the inability of even my very high-resolution simulations to properly simulate the effects of a narrow, improperly resolved cold Puget Sound.
Could Global Warming REDUCE Heat Waves West of the Cascade Crest?
Most people assume that global warming can only increase our high temperatures, but it can do the opposite as well. The Northwest’s mountains and nearby cold water paradoxically might reduce heatwaves over the populated areas west of the Cascade crest under global warming.
Global warming preferentially warms the interior of western North America compared to the Pacific coast (land warms up much more quickly than the Pacific Ocean). The heating results in enhanced pressure falls over the interior (warm air is less dense than cold air), which strengthens cool, onshore flow and lessens warm easterly (offshore) flow. Bad for heatwaves!
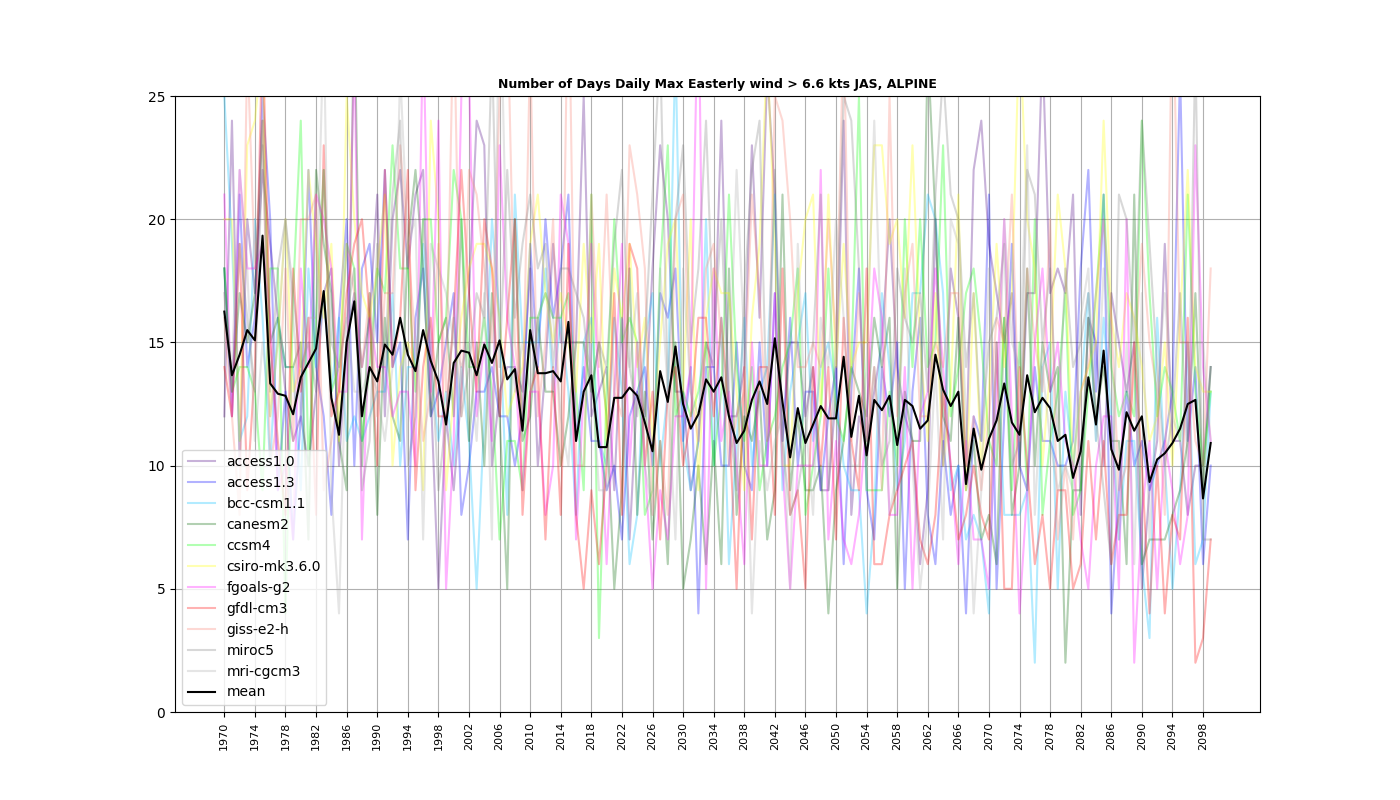
All the great heatwaves west of the Cascade crest occurred under strong easterly flow. Both global and regional climate models have shown that global warming lessens heatwave-producing easterly flow. To illustrate this, consider the figure produced by the research done by my group with Dr. Eric Salathe of UW Bothell. This plot shows the maximum easterly flow each year simulated by an ensemble (many forecasts) of high-resolution regional climate models. Importantly, the mean strength of the strong easterly flow (black line) goes DOWN under global warming, working against the kind of heatwave we had last week.

The Evidence is Overwhelming
As I described above, the natural origins of the “black swan” heatwave we experienced last week can be demonstrated in a number of independent ways, from examining the origins and frequency of the ingredients (such as the high-amplitude ridge of high pressure), considering the statistics of warm temperatures (the lack of trend in extreme high-temperature days), and through high-resolution climate modeling.

The evidence for a predominantly natural origin of the high temperatures records of last week is compelling, with global warming marginally increasing the peak temperatures by perhaps a few degrees. Without global warming, we still would have experienced the most severe heatwave of the past century.
Politicization and Miscommunication of Science
The inaccurate information being distributed about the origins of this heatwave is very disturbing.
Some of this is being done out of ignorance or laziness, but a few individuals are deceiving the public deliberately. Science journalism is only a shadow of what it was decades past, and a number of scientists now see social activism as more important than the determination and communication of truth.
Our nation has made costly mistakes when the truth was twisted for political reasons, such as for the Iraq war, when our nation spent trillions of dollars and initiated a war that killed hundreds of thousands of people based on misinformation about non-existent weapons of mass destruction.
We are now making similar mistakes with global warming, with politically inspired misinformation slowing realistic and life-saving steps, such as thinning our forests and restoring natural fire, or proceeding rapidly with nuclear energy. Hyping global warming puts unrealistic and unnecessary fear into the hearts of our fellow citizens. Unconscionable. Global warming is an issue we can deal with, but only if truthful, factual, and science-based information is provided to decision-makers and the nation’s citizens.
I have spent my life trying to understand the weather and climate of our region and it is so frustrating that the media (e.g., KNKX public radio, the Seattle Times, the Seattle Stranger) and local politicians (such as our governor) have placed such a low priority on providing accurate information regarding climate change and other environmental challenges.
They have put political agendas ahead of truth and we are all the worst for it.

From the article: “The Pacific Northwest is warming and human emission of greenhouse gases is probably the origin of much of it.”
There is no evidence that human-caused greenhouse gases are the origin of a one to two degree increase in temperatures.
You can say you believe CO2 is causing some warming, but you cannot say how much.
It warmed just as much from 1910 to 1940 as it has warmed from 1979 to the present, and the high temperatures were comparable, and in the case of the United States, the high temperatures of the 1930’s were as much as 0.5C warmer than today.
So in order to claim CO2 caused the current warming, you first have to explain why the reason for the 1910 to 1940 warming is no longer in effect, since even the IPCC says CO2 was a minor factor during that period of time.
The current warming could be just as natural as the 1910 to 1940 warming, and you can’t say it’s not, since you have no idea how much warmth CO2 adds to the atmosphere and you have no idea of the negative feedbacks that might come into play.
So you are making unsubstantiated assertions when you say with some confidence that Human-caused CO2 “probably” is the cause of one or two degrees of current warming. There’s no way you can know this with the information currently available.
And is that Washington State temperature chart from the raw (unmodified) data, or has it been adjusted?
I have noticed that our Climate Change Data Manipulators have taken to modifying even regional surface temperature charts, trying to turn them into Hockey Sticks, and when they get done, they always seem to have that little highpoint right at the end that puts the temperatures just above what they were in the past. They look a whole lot like the Washington State chart you supplied.
Raw or Bastardized?
Other than that, I thought your explanation of the circumstances around this high temperature event were right on the momey.
Just leave CO2 out of it, please.
I posted this fine post a few hours ago at a forum and the warmist/alarmist group are going crazy, while completely avoiding the content of Dr. Mass presentation totally.
HERE
It is hilarious!
I saw several articles yesterday that claimed the Northwest heatwave proves human-caused climate change/global warming is real and is here.
Cliff Mass just proved them wrong with this article.
People! I was there! I survived the Great Heatwave of 2021.
So did my cat, and my wife, and all my neighbors, and the deers, turkeys, squirrels, and other critters, and my garden, which is magnificent and burgeoning, possibly the best ever. I mean I’m harvesting tomatoes! In July! In Oregon! It’s a miracle!
Given all the hype, you’d think the buzzards would be circling all the carcasses lying in the burned-out vegetation, but it’s not like that at all. The warmth (it never got over 100°F at my house) was a little uncomfortable, but Ma Nature came through it in great shape.
I’d like to complain, play the Victim Card, but there’s nothing to complain about. We’re living the dream here. Sorry if your world is discombobulating, but the weather in mine is delightful.
The folly of denialism is now plain for everyone to see.
Yep-the folly of denying that natural variability trumps the magic molecule every time.
I say we sack all the climastrologists and rely on cutting edge machine learning-
Human activity influencing global rainfall, study finds (msn.com)
https://www.bbc.co.uk/news/world-us-canada-57729502 Roger Harrabin’s take on it.
https://www.bbc.co.uk/news/science-environment-57742482 and the general BBC view 😒
“So if greenhouse gas warming over Washington State is 1-2F, how can greenhouse gases cause a huge heatwave that is ten to twenty times greater? “
This feels like a misleading question, and worse, an ineffective line of argument.
I live in a suburb north of NYC. The all-time high temperature is less than 100 degrees. In fact, the weather services tell me the all-time high for NYC is less than 100 degrees, whatever Spike Lee and my childhood memories tell me.
I’d bet 90%+ of the American population has never lived anywhere temperatures get more than a couple of degrees over 100.
Except in the Pacific Northwest. Those temperatures were shocking 108 degrees! One place hit 115 degrees!
More shocking, to me, were the previous records in those places. That place that hit 115 degrees last week had a previous record of 109 degrees. One place that hit 108 degrees had a previous record of 104.
Emphasize those numbers if you want to calm people down. Get them to understand that temperatures far above any other part of the country are uncommon in the Pacific Northwest, but do happen.
Because those temperatures don’t happen anywhere on the Atlantic coast. Without that context, people look at 115 degrees and think the end of the world is coming for them.
The media don’t seem to understand how much an outlier this was. Super extreme events aren’t caused by climate change. Climate change doesn’t cause nearly 40 deg deviation from normal. It’s as if Chicago hit 123F (normal 83F), Atlanta 130F (Normal 89F), Dallas Texas 136F (Normal 94F), or Pheonix 155F (Normal end of June high 110F). At Berkleyearth.org it was pointed out when PDX’s temps reached 112F on Sunday (Monday’s temperature was 117F) that this was the most severe heatwave ever recorded in North America, possibly the world, as measured by departure from normal temperatures. I’m thankful that in the rest of my lifetime or even in my grandchildren’s lifetime none of PDX’s temperatures will get within 10 deg F of that record. (In the 150+ of Portland’s records it hit 107 only 4 times. Once in 1942, 1965, and twice in 1981). Because of our proximity to the Pacific Ocean, even those temperatures are very hard to reach.
> It’s as if Chicago hit 123F (normal 83F), Atlanta 130F (Normal 89F), Dallas Texas 136F (Normal 94F), or Pheonix 155F (Normal end of June high 110F).
No, it’s not like that at all. It’s as if those cities exceeded their pre-warming record highs by a few degrees.
This was an unusual event for that area, maybe a little bit stronger than previous occurrences, but not unprecedented at all.
You don’t understand. I took the new record temperature and the normal high converted them to Kelvin and divided the normal into the new record and found that the new record was 1.0725 (7.25%) higher than the normal. I then took those cities’ normal high temperatures for the same date, converted them to Kelvin and applied the same ratio, and then converted the result back to F, thus comparing apples to apples. Our new all-time high temperature was 7.25% higher (based on degrees K) than our normal for the day. Our new record is 5.39% higher (based on degrees K) than our old record of 107F. Beating the old record by over 5% is no everyday occurrence. I won’t be around to collect but I believe that this record will stand for at least the next 200 years. All the global warming predicted (which the actual data says isn’t going to happen) would, over the next 100 years only bring the all-time max to 109F.
I re-did the calculations using Excel (see below) and I admit I was a degree high on my hand calculations but still it shows how extraordinary this heatwave was.
Science says yes: heatwave impossible without climate change
Climate change: US-Canada heatwave ‘virtually impossible’ without warming
Climate change: US-Canada heatwave ‘virtually impossible’ without warming – BBC News
“Science says yes: heatwave impossible without climate change”
Ridiculous, Griff. I’m assuming by “climate change” that you mean human-derived CO2 warming. Correct me if I’m wrong.
So, you are saying there were no heatwaves before humans started putting CO2 in the atmosphere?
Do you see how ridiculous that is?
UHI will almost certainly guarantee that heat waves will be worse each decade in urban areas.
Yes, you are right. In fact, the ‘global warming’ that people are feeling, and that we are mostly measuring, at least in urban areas, is due to the UHI. To the people that live in Manila, Bangkok or Calcutta, it is up to 10 degrees hotter in the city. And stays hotter and longer all night. This is mostly where the myth of global roasting/frying comes from. But at at best, urban areas are only a few percentage points of the entire planet if that, and are not representative of the entire globe.