Reposted from Inside the Eye, Official Blog of the National Hurricane Center
Chris Landsea and Eric Blake [1]
An Incredibly Busy Hurricane Season
The 2020 Atlantic hurricane season was extremely active and destructive with 30 named storms. (The Hurricane Specialists here at the National Hurricane Center use the designation “named storms” to refer to tropical storms, subtropical storms, hurricanes, and major hurricanes.) We even reached into the Greek alphabet for names for just the second time ever. The United States was affected by a record 13 named storms (six of them directly impacted Louisiana), and a record yearly total of 7 billion-dollar tropical cyclone damage events was recorded by the National Centers for Environmental Information (https://www.ncdc.noaa.gov/billions/time-series/US). Nearly every country surrounding the Gulf of Mexico, Caribbean Sea, and tropical/subtropical North Atlantic was threatened or struck in 2020. Total damage in the United States was around $42 billion with over 240 lives lost in the United States and our neighboring countries in the Caribbean and Central America.

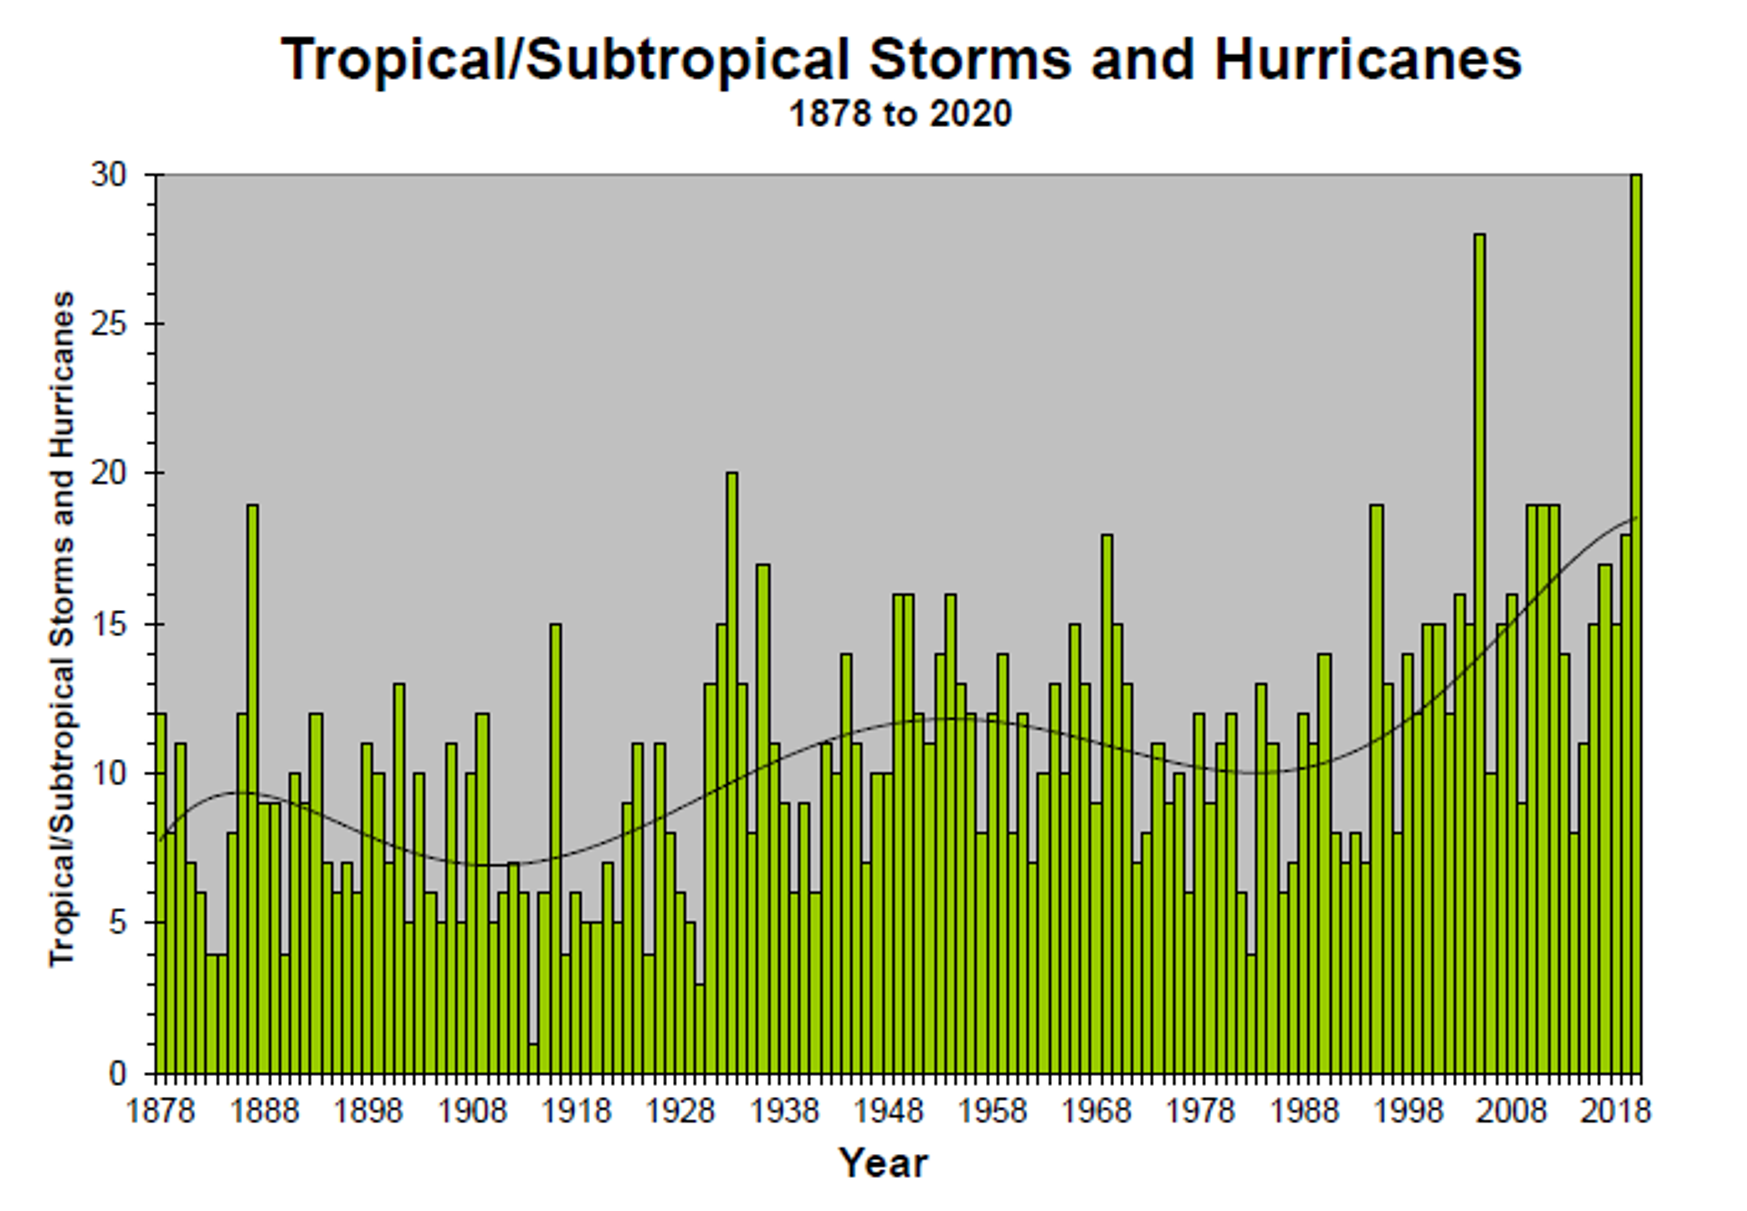
The 30 named storms in 2020 sets a record going back to the 1870s when the U.S. Signal Service (a predecessor to the National Weather Service) began tracking tropical storms and hurricanes. The only year that comes close is 2005 with 28 named storms. It’s also apparent that a very large increase has occurred in the number of observed named storms from an average of 7 to 10 a year in the late 1800s to an average of 15 to 18 a year in the last decade or so – a doubling in the observed numbers over a century! (The black curve in the figure below represents a smoothed representation of the data that filters out the year to year variability in order to focus on time scales of a decade or more).
However, the number of named storms is only one measure of the overall measure of a season’s activity. And indeed, for the 2020 season, other measures of Atlantic tropical storm and hurricane activity were not record breaking. For example, the number of hurricanes (14) was well above average, but fell short of the previous record of 15 hurricanes that occurred in 2005.
For overall monitoring of tropical storm and hurricane activity, tropical meteorologists prefer a metric that combines how strong the peak winds reached in a tropical cyclone, and how long they lasted – called Accumulated Cyclone Energy or ACE[2]. By this measure, 2020 was extremely busy, but not even close to record breaking. In fact, with a total ACE of 180 units, 2020 was only the 13th busiest season on record since 1878 with seasons like 1893, 1933, 1950, and 2005 substantially more active than 2020. One can also see that while there is a long-term increase in recorded ACE since the late 1800s, it’s quite a bit less dramatic than the increase seen with named storms. There also is a pronounced busier/quieter multi-decadal (40- to 60-year) cycle with active conditions in the 1870s to 1890s, late 1920s to 1960s, and again from the mid-1990s onward. Conversely, quiet conditions occurred in the 1900s to early 1920s and 1970s to early 1990s.

Technology Change and Named Storms
So why would the record for named storms be broken in 2020, while the overall activity as measured by ACE is not even be close to setting a record?
The answer is very likely technology change, rather than climate change. Today we have many advanced tools to help monitor tropical and subtropical cyclones across the entire Atlantic basin such as geostationary and low-earth orbiting satellite imagery, the Hurricane Hunter aircraft of the U.S. Air Force Reserve and National Oceanic and Atmospheric Administration (NOAA), coastal weather radars, and scatterometers (radars in space that provide surface wind measurements). In addition, the instrumentation and measuring techniques used by the satellites, aircraft and radars are continually improving. These technological advances allow us at the National Hurricane Center to better identify, track, and forecast tropical and subtropical cyclones with an accuracy and precision never before available. This is great news for coastal residents and mariners, since these tools help us provide the best possible forecasts and warnings to aid in the best preparedness for these life-threatening systems.
Such technology, though, was not available back at the advent of the U.S. Signal Service’s tropical monitoring in the 1870s. Without these sophisticated tools, meteorologists in earlier times not only had difficulty in forecasting tropical cyclones, but they also struggled in even knowing if a system existed over the open ocean. In the late 19th and early 20th Centuries, the only resource hurricane forecasters could use to monitor tropical cyclones were weather station observations provided via telegraph. Such an approach is problematic for observing – much less forecasting – tropical cyclones that develop and spend most of their lifecycle over the open ocean. Here’s a timeline of critical technologies that have dramatically improved tropical meteorologists’ ability to “see” and monitor tropical cyclones:

The upshot of all of these advances in the last century is much better identification of the existence of tropical cyclones and their strongest winds (or what meteorologists call “Intensity”). So, the further one goes back in time, the more tropical cyclones (and portions of their life cycle) were missed, even for systems that may have been a major hurricane. This holds for both counting named storms back in time as well as integrated measures like ACE. Our database is incomplete and has – as statisticians would say – a severe undersampling bias that is much more prominent earlier in the record. HURDAT2 – our Atlantic hurricane database – is an extremely helpful record which is a “by-product” of NHC’s forecasting operations, but it is very deficient for determining real long-term trends. (It’s important to point out that many data entries in HURDAT2 for intensity and even the position of the named storms are educated guesses as opposed to being based on observations before the 1970s advent of regular satellite imagery). To be able to examine questions about any impact from man-made global warming (aka climate change) on long-term changes in the number of named storms, for example, one must first account for the massive technology change over the last century.
Fortunately, to help address this issue, researchers at NOAA’s Geophysical Fluid Dynamics Laboratory (GFDL) – (Gabe Vecchi and Tom Knutson in 2008’s Journal of Climate) have invented a way to estimate how many named storms were missed in the pre-geostationary satellite era (before the 1970s). This was done by comparing the population of tracks and sizes of named storms that have occurred versus the density of observations from ships that were traversing the ocean. If there were ships everywhere all of the time back to the 1870s (and these ships didn’t try to avoid running into tropical cyclones, which they certainly did), there would be very few named storms unaccounted for. But the reality is that much of the Atlantic Ocean, Gulf of Mexico, and Caribbean Sea was sparsely traversed by ships from the late 19th Century until the middle of the 20th Century. (The plots below indicate the amount of shipping traffic and weather observations from those ships – Orange/Red are numerous, Green/Yellow are moderate, Gray are few, and White are no measurements).

In addition to the issue of named storms that were previously missed, due to the lack of ability to observe them, technological improvements also have effectively allowed the standards for naming a storm to be refined resulting in better identification of weak (near the 39-mph/63-kph threshold) systems. Tropical warnings for many of the weak, short-lived named storms in past eras were not issued, and thus these systems were not automatically included into the HURDAT2 database. In the cases when forecasters in earlier years were either 1) not sure that the system possessed the required 39-mph/63-kph winds, 2) assumed that it would be too short in duration, or 3) thought that the system was non-tropical (i.e., with a warm to cold gradient of temperature across the system’s center), they usually did not issue named storm advisories, and therefore these systems did not get added into the historical database[3].
In research that the lead author had investigated (Chris Landsea and company in 2010’s Journal of Climate), we discovered that weak, short-lived (lasting less than or equal to two days) named storms – aka “Shorties” – had shown a dramatic increase in occurrence over time. There were only about one a year in HURDAT2 up until the 1920s, about 3 per year from the 1930s to the 1990s, and jumping up to around 5 per year since 2000.

Of the 30 named storms in 2020, seven were Shorties and a few more were just longer than two days in duration. Of these seven Shorties, four are very unlikely to have been “named” before around 2000: Dolly, Edouard, Omar, and Alpha. (Of the remaining Shorties, Bertha and Kyle may have been named, while Fay likely would have been named). These and other weak, short-lived systems since 2000 have been observed and recognized as tropical storms due to new tools available to forecasters including scatterometers, Advanced Microwave Sounding Units, the Advanced Dvorak Technique, and the Cyclone Phase Space diagrams. The Hurricane Specialists here at the National Hurricane Center then are able to issue advisories on these named storms in real-time and then include them into the HURDAT2 database at the end of the season.

From a warning perspective for mariners and coastal residents, it is very beneficial that the National Hurricane Center is now naming (and recording) these Shorties. But without accounting for how technology affects our records, one can come to some unfounded conclusions about true long-term changes in named storm activity. In addition, it is worth pointing out, but perhaps not too surprising, that it has been shown by the researchers at Princeton University and at GFDL (Villarini et al. 2011, Journal of Geophysical Research) that the observed increase in Shorties has no association with any environmental factor known to influence named storms including man-made global warming. It is therefore reasonable to conclude that the dramatic increase in the number of these Shorties is simply due to better observational technology.
An “Apples-to-Apples” Comparison of the 2020 Long-Lived Named Storms with the Past
So how can we come up then with a more apples-to-apples comparison of how the number of named storms has actually changed over the last 100 years plus? Here are the steps that were performed in the 2010 Journal of Climate paper, about Shorties, updated for data through the 2020 hurricane season:
(1) Start with the original HURDAT2 database of named storms from 1878 onward:

(2) Remove all of the Shorties from the original database, leaving just the long-lived named storms:

(3) Add in the best estimate of the number of missed long-lived named storms before geostationary satellite imagery and the Dvorak technique became available:

The resulting final time series shows tremendous variability, with highest values of 23 in 2020 and 20 in 1887 and 2005, and lowest values of 2 in 1914, and 3 in 1925, 1982, and 1994. Overall, there remains a modest upward trend in the database over the entire time series superimposed with quasi-cyclic variations seen in the ACE data as was discussed earlier: higher activity in the late 1800s, mid-1900s, and from the mid-1990s onward, but lower activity in the early 1900s, and in the 1970s to early 1990s. These cycles of higher and lower activity have been linked to a natural phenomenon called the Atlantic Multidecadal Oscillation (AMO) (see paper by Stan Goldenberg, Chris Landsea, and colleagues in 2001’s Science). Recent controversial research, however, is calling into question whether the AMO actually exists (see paper by Michael Mann and company in 2021’s Science). Regardless of the validity of the AMO, the bottom line is that the doubling in the number of named storms over a century is very likely due to technology change, not natural or man-made climate change.
(4) And finally, add in the uncertainty to these estimates with the reasonable largest number of missed long-lived named storms. This represents the 95% method uncertainty value, or in layman’s terms, the largest reasonable number of missed systems.

Note that after adding on the uncertainty to the missed number of long-lived named storms (blue coloring), we can conclude that 1887 and 2020 may be just as busy for the number of long-lived named storms.
The New “Normal” for Named Storm Numbers
With the completion of the 2011 to 2020 decade, climatologists are updating records to provide a new “normal” (or average) to compare against new weather. The previous 30-year based climate period to decide if a weather event or season was unusual or expected was 1981-2010. For weather phenomena around the world, we’re now changing the years to compute normal conditions to 1991-2020. (The 30-year normal concept is designed to provide a long enough time period to obtain relatively stable statistics, and to also have the time period reflect the most recent weather experienced over a human generation. Thirty years is a good compromise between these two aspects.) It might seem odd to non-meteorologists to change the definition of “average” every ten years, but meteorologists/climatologists do so because climate is never stationary, i.e., the climate is always changing. The climate has both natural variations (like El Niño/La Niña, effects from volcanic eruptions, and the Atlantic Multidecadal Oscillation) and man-made changes (like urban heat island, land use changes, and greenhouse gas emissions) that affect what’s been observed around the last three decades. These revisions of new averages are done around the world in conjunction with the World Meteorological Organization. Thus NOAA is updating the average of temperature, precipitation, and other meteorological parameters to reflect what has been observed.
This shift in the period used for the 30-year climate standard changes the definitions of average (or “normal”) levels of tropical cyclone activity to the following for the Atlantic Ocean, Caribbean Sea, and Gulf of Mexico (see this report by NOAA for more details):
| System Type | Old 1981-2010 Average | New 1991-2020 Average |
| Named Storms | 12 | 14 |
| Hurricanes | 6 | 7 |
| Major Hurricanes | 3 | 3 |
Comparison of the number of named storms, hurricanes, and major hurricanes in the Atlantic basin using the old 30-year (1981-2020) averaging period with the new 30-year (1991-2020) averaging period.
These changes, therefore, reflect that most of the new 1991-2020 climatology period is within an active period that began in 1995 and includes the impact of the technology changes discussed above that have led to the National Hurricane Center more accurately diagnosing and naming more systems in the last couple of decades.
Take Aways
The answers and conclusions to “Was 2020 a Record-Breaking Hurricane Season? Yes, but…”:
- Doubling in the number of named storms over a century is very likely due to technology change, not natural or man-made climate change;
- 2020 set a record for number of named storms, but given the limitations in our records it is possible that other years (such as 1887) were just as active for long-lived named storms; and
- The boost in average or “normal” conditions from 12 to 14 named storms is due to a combination of a busy era that began in 1995 as well as the ability of the National Hurricane Center to observe and accurately diagnose more weak, short-lived named storms than had been done previously, mostly due to technology advancements.
A follow-on blog post, putting these observed changes of the number of named storms into context of what may be expected to occur in the future, is expected to be published in the near future.
[1] Christopher W. Landsea is the Chief of the Tropical Analysis and Forecast Branch at the National Weather Service’s National Hurricane Center in Miami, Florida. Eric Blake is a Senior Hurricane Specialist at the National Hurricane Center. It should be noted that the following discussion is Chris’ and Eric’s opinions only and does not represent any official position of NHC, NWS or NOAA in general. Various scientists within NOAA have differing opinions about global warming’s impact on hurricanes and there is no official NOAA policy on the topic. Varying ideas on an issue often mean that it is a science in progress with no definitive answers. That is certainly the case with regards to global warming and hurricanes. Helpful comments on an earlier version of this writeup were provided by Neal Dorst, Stan Goldenberg, Robbie Berg, and Mike Brennan.
[2] Accumulated Cyclone Energy is calculated by squaring the named storm’s intensity – maximum sustained surface winds (expressed in knots) – for every six hours that the system had at least a 39-mph (63-kph) intensity.
[3] There is on-going research into updating and revising the HURDAT2 database for the seasons of 1851 to 1999 in order to improve and make more complete the records that currently exist. This is done by obtaining the original named storm observations from ships, weather stations, Hurricane Hunter aircraft, radars, and satellites and using today’s best meteorological analyses to revise the positions, intensities, and statuses in the database. This work also adds in newly discovered named storms that were not identified as such at the time. Currently, the reanalysis project has added 35 years (1851 to 1885) to our official records and has revised the 1886 through 1965 hurricane seasons.
HT/Mumbles McGuirck
A cnn insider was videotaped undercover and recorded saying cnn defeated Trump and now will concentrate on climate change….fear sells.
With the advent of the super resolution GEOS satellites, every little spin in the clouds seems to turn up as a named storm, whether it is warm or cold core. I will say though watching the spinning mostly cloudless patch of sky off the South Carolina coast hit the Gulf Stream and explode into a Tropical Storm in just hours last week was pretty amazing. In the old days, that one may or may not have made the TS list.
A pod of whales catches a cold and the resultant sneezing outbreak gets a name. That is certainly going to up the alarmists averages. The Powers That Be have total control of the process. To your point tropical depressions have been given names in anticipation only to fizzle out. Add 1 to the total. Never so much as an “Oops! Never mind.”
As the old saw goes “figures lie and liars figure.”
Absolutely, they’ve begun naming Bird flatulence and butterfly belches even winter rainstorms
“It might seem odd…to change the definition of “average” every ten years, but…climate is always changing.”
That is precisely why the 30 year average doesn’t make sense. Throwing out good data every ten years results in an average that gives a false impression of lack of variation.
It is because you keep throwing out data that there is an impression of “climate changing” rather than variation in the normal weather.
The only actual climate change is the alternation between glacial and interglacial. Within an interglacial you are observing variation in the stable normal NOT “climate changing.”
The entire field of “climatology” is a misnomer because it is not studying how the planet alternates between glacial and interglacial but is treating normal variation of the stable interglacial as “climate changing”.
The old data do not disappear.
Rolling averages are used to monitor phenomena that are changing or expected to change continuously. This is routine. The authors and NWS are perfectly justified in using 30 year rolling averages since they and we know that the climate is always changing, and always will change.
Anybody who denies that the climate changes at all is an ignorant idiot. The argument has always been over the cause, not the fact, of climate change, and over what, if anything, mankind should do regarding climate change.
One can keep a rolling 30-year average but also a set of statistics over the entire data set that allow a cyclical trend to be spotted from an upward trend. If we are going to argue over long term climate change then perhaps we should not just look at the last 30 years?
Climate Change – it isn’t just the cause but the degree. I am perfectly willing to believe that adding CO2 to the atmosphere could cause additional and even measurable warming, but to what degree compared to the natural change already occurring and what are the consequences. Both the amount of CO2 induced climate change and it’s consequences are greatly exaggerated. This is where the debate should be occurring.
The 30 year reference period is about half of the 60-70 year cycle seen in the data. When the UN IPCC CliSciFi gang can explain that cycle (and any secular warming from the Little Ice Age), we may begin to get into actual climate science.
I have been studying this since ALGORE came out on all the national morning shows to declare “The Debate is over” and The science is settled.” At the time I had to pick myself up off the floor after a fit of hysterical laughter, because that is the type of thing that an ignorant fool would say.
Or something an evil politician or bureaucrat or a silent partner in a futures venture to trade carbon credits for fun and profit or someone who wears all 3 masks might say. Read the last as a nefarious central authoritarian plan to control the worldwide use of fossil fuel..
In reality Duane in the 30 years that I have been researching AGW (or end of days CAGW as it is presented to the children), and debating the threat posed to the planet by human kind burning fossil fuel for energy, the only people I have ever encountered that “denies that the climate changes” are people who claim that there are people who deny that the climate changes.
Seems folk who believe that the world is ending 8, 12, 50 or 100 years from now in a CO2 induced fiery death are the ignorant fools for confusing a scientific study of the roll of natural variability in an every changing climate with denial of climate change.
An interesting discussion that adds detail to what many people probably suspected — that better detection technology reveals a bias in the record.
A simple increase in the number of ships using the same basic technology will do the same.
It would be helpful to see a concise description of the methodology used to trigger the 35 knots/40mph tropical storm designation which seems so common and persistent. Current Atlantic storm Elsa is moving at 22knots/25mph and one wonders about newly formed storms cohesiveness, if that is the right word.
Well, this will certainly get the authors cancelled! For the crime of practicing science instead of politically correct ideology.
According to some warmunistas that I know, the logic goes like this.
We know that global warming is going to kill people.
We could solve global warming, except these skeptics are making it hard to get the laws needed, passed.
Therefore these skeptics are killing people and should be prosecuted for murder.
Considering the plot of where ships were travelling. I notice that the plot is all ships over the years listed.
I strongly suspect that had those plots been broken out by hurricane season vs the rest of the year, they would find that especially in the early years, ships would have deliberately avoided the areas where hurricanes were likely to be during hurricane season.
Today’s ships are bigger and faster, and with constant monitoring it’s easier for them to avoid hurricanes, so the risk of traversing the areas of high hurricane activity are lessened.
This is so alarming for the new generation! We should be aware of the adverse effect of climate changes. Many developed countries have been trying to control the climate issues, but unfortunately, we can not control it. We should work together for the betterment of the environment.
What? New generation? We have used the Public School Systems, Children’s books, sesame street, cartoons, movies and the news media to attack the amygdala of the past two generations, millennials and GenZers. We have scared them, from infancy, into believing the world was going to not only end soon but catastrophically and then told them that the world can be saved if they abandon their quality of life to try and live off environmentally damaging wind turbines and solar farms with incongruent and inadequate battery storage technology that further enslaves the poor and degrades the environment long term. Is that the kind of work we should we do together?
Maybe we should work toward the betterment of human life with fossil fuel and nuclear energy. We can do both and still respect the environment. We should start by telling them the truth that this Global Warm…ahh we really meant climate change all along is a hoax created by the Faceless Cultural Elite wealth holders to preserve reliable fossil fuel energy for their private planes and multi-million dollar yachts and the McMansions that their fossil fuel driven transportation moves them and their richie rich kids back and forth to and from. “Hey kids, It’s South of France Friday!”
This is so alarming for the new generation! We should be aware of the adverse effect of climate changes. Many developed countries have been trying to control the climate issues, but unfortunately, we can not control it. We should work together for the betterment of the environment.I like flirtymania plus as a great source of entertainment across the world.
Spambot
I thought it was griff. 😉
Obviously did not actually read the article.
Is pushing a web site that it wants all of us to visit.
Yup, spambot.
New to the business, too – forgot the spam link the first time.
“a very large increase has occurred in the number of observed named storms”
In the 1980s, Dr. Neil Frank made the point that the increase in our ability to observe storms was driving increased annual storm counts rather than an increase in actual storms.
This analysis reinforces that view. Nice to see the National Hurricane Center doing real science.
Perhaps they’ll get around to calling them cases and come up with scary sounding names and themes.
“Hurricane Mike Tyson has entered the Gulf. Promises to pack quite a punch.”
“The developing storm case, Naomi Oreskes, looks to be real ugly for everyone in its line of sight.”
Name the storms after demrats….destructive waste like Piglosi….Joey the Clown….Schiffty….NoNadsNadler….Schemer…
Sorry, mate, but Clement Wragge beat you to it:
https://www.nytimes.com/1997/06/07/opinion/l-when-cyclones-were-named-for-politicians-507369.html
https://www.history.com/news/why-do-hurricanes-have-names
The only consistent recording in the late 1800’s was the number and strength of hurricanes as they made landfall, and even that has some gaps as parts of the southern U.S. were sparsely inhabited. To claim a record since 1880 using data outside that scope is not just biased by technology, but intentionally deceptive.
Yes, NHC, when you slap a name on every 1/2 assed organized bunch of clouds over an ocean it will be a “record breaking” season. Good for raising your budget each fiscal year, too.
What really matters is the Accumulated Cyclone Energy. Does the smoothed average of the ACE allow prediction of the next year? In other words, if the smoothed average indicates a period of enhanced activity is the next rear likely to be a year of increased activity too? The answer is not really. There are many examples of a high activity year occurring near a lull in the smoothed average as well as low activity year occurring near a peak in the smoothed average. There’s a test done in Monte Carlo analysis called the next trial test – how would the average respond if the next trial (next year in this case yet to be sampled) would be the highest previously observed vs. the lowest. That tells you if the average is a statistically meaningful number. What can you conclude from the smoothed average of ACE with any statistical accuracy? Not much. Can’t conclude that the shape of the average curve is meaningful as the yearly data is far too variable.
In the future, every year will be the “highest, worst, hottest, coldest,…” ever. No thinking about it.
(The black curve in the figure below represents a smoothed representation of the data that filters out the year to year variability in order to focus on time scales of a decade or more).
Are we allowed to know what kind of filter was applied and how you padded the data to get to the end points?
Yes, I’m very suspicious of that “filter”. The peak near the end is centred on a trough in the data and then it dives downwards when the data if fairly flat. The early peak seems equally odd. The WWII trough in the data is not reflected in the “filter”.
Two things I don’t like about this article: no data source and no proper description of this “filter” which seems to be behaving oddly.
Here’s a lighter gaussian filtered version I did a few years back on Climate Etc

https://judithcurry.com/2016/01/11/ace-in-the-hole/
Great article. A lot of people just do not think about how the measurements, technology, or just convention changes, therefore they get sucked into a false conclusion. Same with tornadoes, the advent of both Doppler radar and storm chasers has affected the number of tornadoes recorded.
Science is often this way – you grow interested in some phenomenon and start looking for it and it turns out to be more frequent than you thought. This is not a trend in the phenomenon, it’s just improvements to observation. (or in the case of named storms, also a change in what is named)
I don’t see the slightest link to any DATA here.
‘Subtropical’! Com’on man. We’ve had dozens of subtropical storms in Ontario alone this year. We’ve even had more subsubtropical storms, sometimes called scotch mist.
Now if Global Cooling was the meme again, the proximate cause would be six years of cooling making a larger T differential between tropical and northern temperate zone air masses. Actually the real ‘record’ of 2005 was following 6 yrs of cooling. Hmmm.
Why wasn’t there a curve fit for the last figure……….. hmm maybe because the hockey stick at the end goes away…..
I’ve been visiting this site for some time now, and after reading the many posts and comments like what I see here, I’m in no doubt that there’s something seriously wrong with climate change ‘science’, and that politicians are using it as an excuse to force a radical change to our freedoms and way of life upon us.
All I really want to know now is how to fix it. Politicians simply ignore facts, lie, tell us we have no choice but to wreck things, and the few who do call out the bullshit are shouted down.
Vast numbers of the public have an annoying habit of trusting politicians, so they actually believe the lies and keep voting alarmists back in. Here in NZ, our ‘green’ party (which is actually red) has _growing_ support despite continually showing us they’re seriously insane. Hell, even some of the supposedly right wing governments (Boris) buy into it.
Seriously, how do we fix this? Do we simply have to wait for the destruction to take its toll before people wake up?
I would like to see an “opposite” comparison for confirmation.
Given the 1878-1910 and 1910-1945 observation networks, how many of the 2020 (and other recent seasons) storms would have been named/major, etc.? We should be able to do that with lower uncertainty than estimating how many we missed back I the day.
Well, that’s a good question. As a lifelong blue water sailor, I keep an eye out for this stuff. Nowadays, anything north of 40mph is a “named storm” Well hell, 30 knots is a nice sailing day down in the trades of the Caribbean, so 40mph is, well, maybe put in a reef or two. Otherwise, eh.
In the North Sea, 40 MPH is just another day at the beach. So yeah, the numbers are inflated, BIG TIME!
The definition of a tropical storm or cyclone involves two conditions:
1) A defined center of circulation with low central pressure … meaning it excludes all frontal storms, and any single cell thunderstorms
2) Sustained winds of 39 mph or more.
Most storms on the planet have no center of circulation, regardless of the wind speeds.
How sweet, every cloud has its own name now. Very romantic.
Gaslighting is everywhere. Yesterday the UK Met Office was warning Poms of searing heat. How searing you might ask? This searing: 25C in London and low 20’s everywhere else.
It’s always good to see that our cousins on the other side of the pond are still able to keep a stiff upper lip in the face of adversity. Never surrender! and all that. Oh MY GOD! TWENTY-FIVE degrees Celsius? You’re all going to be incinerated. You’ll need to remove your overcoat and maybe even your sweater.
The definition of a tropical cyclone hasn’t changed in hundreds of years. What has changed is the ability of humans to detect and track such storms.
Adjusting the old storm data is ok then, but not the old temperature data
Those that object to the idea of 30 year “normals” do not understand this:
“… and to also have the time period reflect the most recent weather experienced over a human generation. ” (from the post)
This concept was thoroughly discussed in the 1930s, then in 1935 accepted for the purposes of having a comparative time period a living person could relate to. Note this was before modern computers and before James Hansen and Al Gore.
I suggest we could use all the data going back to the beginning of the Younger Dryas. I remember that very well. {invoke Poe’s Law}.
This is why only landfall hurricanes should be used as data, since we know how many there were in the past. And if you do the numbers are not increasing.
The latest “evidence of climate change”: TS Elsa, because (get this) it’s the earliest 5th named storm on record. We’re doomed.
The ACE graph makes clear there is no significant change. End of story.
The data seems to support something that I have been talking about for years. Emails , twitter etc.. If you think the sun plays a role in tropical development- enhancement. And the CM has a relationship with solar – space weather activity. Then we should be able to see a cycle pattern. Years crossing near the solar limb, and near the 9 o’clock area . 1887-88, 1932-33, 1968-69, and 2004-05. Coincidence? Yes need forcing mechanism. Spin orbit coupling? I recently emailed a leader in this field about this and some other things. Not heard back.
With more than 26 named storms we need more letters in our alphabet. The easy solution for naming storms is to switch to Cyrillic, and start using Russian names for storms.
The hurricane center has determined that the 2020 hurricane season was record breaking but they did not attribute that to AGW.
According to those guys, attribution of tropical cyclone activity to AGW requires data from all six cyclone basins over a long study period more than 30 years. Therefore, one extraordinary year in one cyclone basin is worth writing about but not the evidence for attribution to climate change.
Please see
https://tambonthongchai.com/2019/11/14/hurricane-obsession/