By Andy May
The concepts and data used to make temperature and climate reconstructions, or estimates, are constantly evolving. Currently, there are over 100,000 global weather stations on land and over 4,500 Argo floats and weather buoys at sea. This is in addition to regular measurements by satellites and ships at sea. The measurement locations are known accurately, the date and time of each measurement is known, and the instruments are mostly accurate to ±0.5°C or better. Thus, we can calculate a reasonable global average surface temperature. However, the farther we go into the past the fewer measurements we have. Prior to 2005, the sea-surface measurements deteriorate quickly and prior to 1950 the land-based weather station network is quite poor, especially in the Southern Hemisphere. Before 1850, the coverage is so poor as to be unusable for estimating a global average temperature. Prior to 1714 the calibrated thermometer had not even been invented; the world had to wait for Gabriel Fahrenheit.
Is the global average temperature a useful climate metric? How do we compare today’s global or hemispheric temperature to the past? Modern instruments covering the globe have only been in place since 2005, plus or minus a few years. If we have accurate measurements since 2005, how do we compare them to global temperatures hundreds or thousands of years ago? The world has warmed 0.8°C since 1950 and 0.3°C since 2005, that doesn’t sound very scary. This two-part series will investigate these questions. We will propose a solution to the problem in a second post that should be up in a day or two.
Attempts to construct hemispheric or global temperature records that extend back 1,000 or more years are unconvincing so far. These statistical reconstructions combine various temperature proxies, such as tree ring measurements, oxygen isotope measurements from ice cores, Mg/Ca ratios in fossil shells, various organic paleothermometers, like Tex86, borehole temperature surveys, or other temperature related measurements from lake or ocean floor sediment cores, into a single temperature record of the past. There are numerous problems comparing these records to the present global temperature record.
- All present temperature records, at least since 2005, are to an objective standard temperature, they are daily, well-timed measurements, and the location and elevation of each measurement are known precisely. The global coverage on land, sea, and from satellites is good.
- The various proxies used in the reconstructions all have biases and their relationship to surface temperature is often seasonal. Summer temperatures often change at a different rate than winter temperatures.
- All proxies have other influences that affect them, tree rings are affected by precipitation, wind speed, and CO2, for example (National Research Council, 2006, pp. 45-52). Ice core records are affected by elevation, cloud height, and precipitation rates (Vinther, et al., 2009). Proxies lose temporal and temperature accuracy with time.
- The statistical methods used to create the temperature reconstructions are inadequate for their purpose and flawed (Wegman, Scott, & Said, 2010). The methods produce a quantitative result, but they do not “guarantee physical meaning” or “physical reality” (Soon, Baliunas, Idso, Idso, & Legates, 2003b).
Longer-term natural climatic changes affect Earth by latitude; thus, the Southern Hemisphere is often out of sync with the Northern Hemisphere, further the mid-latitudes in the Northern Hemisphere (30°N to 60°N) have more temperature extremes than the rest of the earth, due to the concentration of land area there, as shown in Figure 1.

Bo Christiansen and Fredrik Ljungqvist (Christiansen & Ljungqvist, 2011) have shown that the various spatial regression techniques used in the past, generally some form of principal component analysis, significantly suppress both long-term and short-term temperature variability. Their “LOC” method is similar in concept to the method used to make Figure 1, but more sophisticated. They produce local reconstructions at the site of each temperature proxy. Each proxy is tested for significance versus modern local instrumental temperatures and rejected if the proxy fails. Local reconstructions are performed and then averaged over the extra-tropical (>30°N) Northern Hemisphere. By keeping the process simple, more variability is preserved, but even these reconstructions do not have the variability of modern temperature records and cannot be directly compared to them, the proxy locations are too sparse. Further, all local proxies are calibrated with modern instrumental temperatures, there is no check on the validity of the calibration of pre-instrumental proxy derived temperatures.
Renee Hannon has compared the best ice core temperature proxies from Greenland and Antarctica and found a similar relationship to the one shown in Figure 1. Figure 2 compares the polar temperature records to the total insolation received at 65°N in June and 65°S latitude in December due to Earth’s orbital characteristics.

Even accounting for changes in insolation (see right-hand scale), the swings in the Northern Hemisphere are much more dramatic than those in the Southern Hemisphere. Hannon explains that the difference in extremes is probably due to the Arctic Ocean being surrounded by land and the Southern Ocean surrounding Antarctica. There are also orbital and other natural characteristics, that affect our climate. All these influences are not incorporated into the insolation curves in Figure 2. They are explained well by Javier Vinós here and here.
CO2 records from Antarctica and Greenland ice cores do not match one another, which is odd because CO2 is normally considered to be a well-mixed gas. Greenland ice core CO2 measurements mostly run higher than Antarctic CO2 estimates and are more variable. Most researchers believe the Greenland measurements are contaminated and don’t use them; they rely only on the Antarctic measurements. This view may be flawed as Renee Hannon concludes here.
Further, as Hannon points out, Antarctic long-term temperature reconstructions correlate well with Antarctic CO2 ice core measurements, but Greenland temperatures have a negative correlation with Antarctic CO2 concentration. Greenland CO2 measurements correlate better with Greenland temperature reconstructions than the Antarctic CO2 record. Because CO2 is well-mixed, it should have a global effect on temperature over the long-term, or periods of more than a few years. Why does CO2 have a positive correlation with the South Pole temperatures and a negative correlation with North Pole temperatures? This would seem to preclude CO2 as a dominant climate influence, at least over the long-term. The negative correlation strongly suggests that temperature is driving CO2 concentrations, in both Antarctica and Greenland, and not the other way around.
Like polar climatic events, the Medieval Warm Period and Little Ice Age are not spatially or temporally synchronous everywhere (Soon, Baliunas, Idso, Idso, & Legates, 2003b). The problems with hemispheric and global averages become very apparent when we recognize that local weather and climate vary dramatically around the world. Climate and climate changes are local, not global, or even hemispheric.
Short-term variability is lost when mixing proxies of different temporal resolutions. Long-term variability is lost through standardization techniques meant to correct for non-climatic biases, but unfortunately, also remove climate extremes. Proxy bias, which can be due to a seasonal bias or other environmental bias, is systematic and not included in the confidence intervals provided with the reconstructions (Christiansen & Ljungqvist, 2011). The “confidence intervals” assume the errors are random and that short-term trends fluctuate around a mean that is close to the correct temperature. Systematic errors can move the long-term trend away from the true value, thus the name.
Global or hemispheric climatic changes, like the Little Ice Age or the Medieval Warm Period, only cause smoothed anomalies of 0.5 to 1.5°C, but local, yearly changes are much larger (Soon, Baliunas, Idso, Idso, & Legates, 2003b).
The final weakness of all hemispheric and global reconstructions is the sparseness of the data. The reconstructions used in Figure 1 are based on very few proxies. The Antarctic and Southern Hemisphere reconstructions only have three suitable proxies each. The tropics and Northern Hemisphere reconstructions are based on seven proxies each. The Arctic has nine. This coverage cannot be legitimately compared to the modern record, which has over 100,000 weather stations, with very precise readings (relative to proxies) that are precisely located and timed.
We need to stop this farcical attempt to compare modern instrumental temperatures over entire hemispheres or the globe to proxy-based temperatures for the past millennium or longer. Yet many pursue this Sisyphean task. It seems likely that the upcoming AR6 document will try and make direct comparisons of the modern era to the PETM (The Paleocene-Eocene Thermal Maximum), 56 million years ago!
Talk about temporal resolution problems. There are only seven CO2 estimates, that include some rate data, between 55 Ma (million years ago) and 56 Ma, as shown in Figure 3. Yet Philip Gingerich claims rates of “carbon” emissions today are 9-10 times higher than in the PETM. Seriously, how does he know that with only seven measurements in one-million years (Gingerich, 2019)? Gingerich’s “carbon” (he means CO2) accumulation rates are computed over very roughly estimated periods of 3,000 to 20,000 years, hardly relevant to today’s detailed record since about 1950.

As noted in Figure 3, on average, CO2 was just a little higher than today during the PETM warming, and three estimates are lower than today. The blue line in Figure 3 is today’s average atmospheric concentration. During the PETM, sea surface temperatures (SST) near Denmark reached 33°C. But significantly higher CO2 concentrations were not reached until a million years later. They were also higher three million years earlier. How do you compare this period to today when we have daily measurements of both temperature and CO2? It is not possible.
Climate and climate change are regional, regardless of the cause. As already discussed, insolation affects the globe by latitude. Changing ocean currents, such as ENSO, and shifts in atmospheric phenomena like the ITCZ (Intertropical Convergence Zone) are regional. If CO2 dominates climate change, why aren’t the changes global?
Willie Soon, Sallie Baliunas, Craig Idso, Sherwood Idso, and David Legates were way ahead of their time when they published two critical papers in 2003 on this subject (Soon & Baliunas, 2003) and (Soon, Baliunas, Idso, Idso, & Legates, 2003b). They recognized the conceptual flaws in Mann, Bradley, and Hughes’ various proxy-based “hockey sticks” very early. Later the statistical techniques and the proxies used to generate the hockey stick were shown to be invalid by Steve McIntyre and Ross McKitrick (McIntyre & McKitrick, 2005), as immortalized by Andrew Montford in his monumental work, The Hockey Stick Illusion. We often focus on Mann’s hockey stick, but the same problems exist in all regression-based proxy temperature reconstructions, including Moberg’s, Marcott’s and many more (Moberg, Sonechkin, Holmgren, Datsenko, & Karlen, 2005) and (Marcott, Shakun, Clark, & Mix, 2013).
Ice core data for the past 2,000 years has an annual resolution since annual layers are typically recognizable in cores that young. Recent tree ring and coral record dates are also often accurate to the year. Historical records, such as the position of glaciers are sometimes accurate to the day. Proxies older than one to two thousand years or other types of proxies typically have dates that are much less accurate. The proxy temperatures estimated from tree rings, ice cores, and corals are affected by wind speed, elevation changes, cloud height, and other environmental factors. Large scale surface temperature reconstructions prior to 1600 AD have low confidence primarily due the lack of precise dates for most or all the proxy samples. Older proxy temperatures are also suspect due to the short length of the instrumental record used to calibrate them. It is recognized that the temperature-proxy relationship might change with time (National Research Council, 2006, pp. 19-21). The lack of early-time temperature calibration data causes the potential systematic error to increase the further we go into the past.
These sources of error, especially the dating errors, precludes combining most proxies into one temperature record. If the proxy temperature error were random and not systematic due to bias, one might consider combining them, even allowing for dating problems. But, even then, the resulting record would have such a coarse resolution that no warming rate could be computed comparable to modern instrumental warming rates. The idea that current warming rates or current temperatures are extreme relative to the past is without foundation (National Research Council, 2006, pp. 20-21).
Regarding the questions at the beginning of the post:
Is the global average temperature a useful climate metric? This metric only applies to global forces. CO2, whether man-made or natural, might be a global force, but we have yet to see any evidence that it is large enough to be detected or measured. The CO2 influence has been modeled, with unvalidated models, but you can do anything with a model if you don’t have to prove it works. See here for a deeper look at climate model problems. Natural climate influences are regional. Prior to 2005 for surface data, or 1979 for satellite data, global coverage was poor, leaving us with an exceedingly short, but accurate global temperature record. It is too short to detect global differences, due to CO2, as small as the IPCC models estimate today, roughly +3.4 W/m2 over the past 150 years (IPCC AR5, pp 817-818).
How do we compare today’s global or hemispheric temperature to the past? We don’t. Adequate data do not exist, either in the instrumental record or in proxies. The best solution is to compare individual proxies to locally measured modern temperatures.
Using the data we have; the world has warmed a paltry 0.8°C since 1950 and 0.3°C since 2005. It varied much more than that yesterday in Texas. There are good proxy records that go far into the past; and we have global instrumental coverage of surface and ocean temperatures today. Why try and make a global temperature from sparse and inaccurate proxies? Why not pick a proxy and compute a modern temperature for that location? I’ll show some examples in the next post.
Download the bibliography here.
“Using the data we have; the world has warmed a paltry 0.8°C since 1950 and 0.3°C since 2005. It varied much more than that yesterday in Texas.”
The world cooled about 6°C going into the last glaciation, and warmed by the same amount coming out. I’m sure it changes often by that much during a Texas day. But changing the global average had a drastic effect.
It’s true that 0.8°C is less than 6°C. But warming 0.3°C in 15 years means that it would take just 300 years to warm 6°C, provided that at least we can stop the acceleration.
Gee Nick. It might even get warm enough for trees to grow in the Arctic Tundra where they flourished during the mid-Holocene. Now how was it so warm there back then where today it is still far too cold for trees to grow? Sure bet it was not from anthropogenic CO2.
Nick,
You are assuming several things that you cannot know.
Since when has climate change been linear???
You have devolved into rampant speculation.
“Since when has climate change been linear???”
I don’t expect that it will be. I think that unless we do a lot to stop it, the rate will accelerate. But you have to first look at what would happen if the current rate continues.
What acceleration?
On Andy’s figures
“the world has warmed a paltry 0.8°C since 1950 and 0.3°C since 2005″
That is acceleration.
It hasn’t. Some places have warmed, some have cooled, some have remained relatively static.
What is much more important is where on the planet temperatures have risen, not the average over the entire planet. In a place where the average annual temperature is well below freezing a few 10ths or even a full degree of warming is meaningless. The entire notion of averaging temperatures over the whole planet is just politics, not science.
++
Didn’t it do the same thing at the beginning of the last century.
Was that also acceleration?
Was the 0.3 since 2005 a monotonic rise in temperature to match th CO2 rise or was it due to step changes from el ninos?
The UAH tempetures have dropped 0.7C since 2016, 0.14C/year, at that rate we could be 3.5C colder in 30 years, heading for a full blown Ice Age.
Isn’t it a good thing that climate change isn’t linear.
Ah, yes, but we fought a couple of world wars in order to stop the acceleration in the beginning of the 20th century! Lucky we were that our efforts worked that time.
”0.3°C since 2005″
And precisely zero since 2003. Also probably zero since the end of WW2. The ”climate” is not really warming or cooling is it. What you are looking at is long term weather oscillations.
Hogwash! See here:
http://temperature.global/?fbclid=IwAR1mhZfsFG7WnZYOjTznx_Yvy-_MguXETmvV-cioDlJGGsEqNoWppwAMrUo
Global temperature measurements shows last 6 years are all at or below the 30 year average!
The recorded global temperature for previous years:
2015 average: 0.98 °F (0.54 °C) below normal
2016 average: 0.48 °F (0.27 °C) below normal
2017 average: 0.47 °F (0.26 °C) below normal
2018 average: 1.33 °F (0.74 °C) below normal
2019 average: 0.65 °F (0.36 °C) below normal
2020 average: 0.00 °F (0.00 °C) below normal
Temperature.Global calculates the current global temperature of the Earth. It uses unadjusted surface temperatures. The current temperature is the 12M average mean surface temperature over the last 12 months compared against the 30 year mean. New observations are entered each minute and the site is updated accordingly. This site was created by professional meteorologists and climatologists with over 25 years experience in surface weather observations.
Data SourcesNOAA Global METARs
NOAA One-Minute Observations (OMOs)
NBDC Global Buoy Reports
MADIS Mesonet Data
“Global temperature measurements shows…”
Nobody measures global temperature. People calculate it. You have cited a completely anonymous site, who give no indication how they calculate it. No credibility at all.
Two data points make a trend?
Nick, I’ve never been impressed by your scientific integrity, however that’s a new low.
Again, I’m just quoting Andy May. But they aren’t data points. They are trends.
Andy was smart enough not to take two data points and try to extend them into the future.
To bad you are being paid to make a fool of yourself.
I just said that Andy’s trend from 1950 and then from 2005 shows an acceleration.
Nick likes to ignore reality. Short term trends are significantly influenced by noise. The average global temperature for March, April and May 2021 is about the same as it was in 2001 with a similar ENSO forcing (coming out of La Nina). No evidence of any warming since then let alone 2005.
Hi Nick
What measures have you taken to stop it as regards your lifestyle choices?
tonyb
I point out that warming is a problem for the world. The world will have to figure out what to do about it.
For my part, I don’t drive. I don’t fly. My main indulgence is sitting well-clad in my barely heated room typing comments on my desktop.
Good grief Nick, you sound as if you are a poverty stricken artist sitting in a draughty garret!
Hmmm. Surely you wouldn’t need a barely heated room at this time of the year anyway?
tonyb
Tony, it is a day or two after the winter solstice.
But I have redirected most of the draughts toward the wind turbines.
Oh God. You really do temp one.
Finally we learn that you are shut in. You must be fun at parties 😜
At least they allow a computer in the jail cell.
Nick you flaming hypocrite, you are a virtue signalling leftist like all the others.
Tony asked. In fact, he’s been asking rather persistently.
With your extraordinary talent for predicting the Earth’s future climate I’m amazed you haven’t made a fortune on the Stock Market.
The first step to wisdom is knowing that you don’t know. As Dirty Harry explained in the film “Magnum Force”:
“A man’s gotta know his limitations.”
Once upon a time, a very wise old man with much experience of humans correctly observed:
“Humans are behaviorally predisposed to inaccurately extrapolate cyclical, non-linear phenomena in a non-cyclical, linear manner.”
Nick,
“The rate will accelerate …”
Fundamentals:
distance, position, displacement, velocity and acceleration.
There is a concept of accelerated rate, but I am unaware of its practical meaning as well as its sci-fi name. Geoff S
Common usage Geoff. Yes, increase is more correct.
“Think”??
The illusion of knowledge when it is wrong is worse than knowing nothing and acknowledging that ignorance.
We do not understand the causation of millennium scale warm periods, yet we (the IPCC and climate dowsers) “think” we know the causation behind the current Modern WarmPeriod (anthro emissions).
Hubris. Pure and simple hubris
I love how Nick tries to pretend that 100% of the warming since 1950 is due to CO2.
He also tries to get us to ignore the many well known climate cycles.
Even if all of the warming since 1950 was anthropogenic, it has barely warmed us up from “The Ice Age Cometh”…
Of course man contributes to global warming. You can’t boil millions of gallons of water, even if by the kettle full, with out contributing some heat to the atmosphere.
You can’t cook hundreds of millions of meals, or heat tens of millions of meals whitout generating some heat.
You can’t run hundreds of millions of ICE heat engines, again without adding a little something to the planet’s atmospheres temperature.
All together the result of using any fuel, solar wind or fossil generated must add to the planet’s heat budget, but so little to be, like that added by CO2, lost in the noise of estimate.
Of course man contributes, but man contributes to both heating and cooling. Hot cities radiate far more heat to space than cool farm lands. The ‘heat budget’ is not fixed, but varies in input based on the sun’s radiation, and reflection from clouds, and also varies based on the radiated heat rate, proportional to the fourth power of the local temperature, also moderated by clouds.
Relax and enjoy global warming. Besides, if it gets warm enough, we may even achieve a climate worthy of the Garden of Eden … https://www.youtube.com/watch?v=iBQs1Jk4aUE
That explains the FKK crowd – they are preparing!
LOL!
Why would you think that you are going to (or at a minimum at least try) stop the acceleration ? This is a well worded statement you made (not reverse the trend, but at least stop the acceleration). Stay at these levels ? The US and whole else ? Are you being monitored by the green powers for your comments on this site ?
How to do ?
Stopping the trend of increasing C02 generation by the extra warm bodies, right born every day on earth ?
Cut back on things like consumption of electronics, ATVs, jetboats, PUI trucks, jets, airplanes, hot air balloons, cruise ship excursions, train travel, NASCAR, and in general, dampen the use of non-essential stuff and extra events that need energy as it generates dangerous CO2. Even folks headed to large sporting events are wasting energy and creating CO2, and you think all of this is some sort of shame ? Also, things like boat docks and slips, sport fishing, RVs, camping, sports cars and clothing, cargo shipping, highway building, all hurting the earth’s climate.
Why let Elon Musk mess around with rockets headed to the moon ? A joy ride of epic (CO2 generating) proportions. Never have so few converted so much.
Just read books (e-books), play the guitar, and dance. Dang Nick. People will join the military for free just to do cool stuff.
More people are headed our way right, but we will STOP generating more CO2 in proportion to the population anyway. Will will bend the trend, right ? Why ? This is why some people don’t start families, etc.
It is depressing to listen to your drumbeat, and its not even proven to be right.
You are in it too far to even consider that maybe warming is causing the C02 to increase.
If in your mind you aren’t planning to make US and EU consumption reductions significant enough to offset growth in China, India, and Africa, then you aren’t sincere about this really. We can lead by example ? That is not sincerely honest talk either.
“Why would you think that you are going to (or at a minimum at least try) stop the acceleration ?”
I think we’ll have to do more than that. As said, with that achieved, we could expect a rise of 6°C in 300 years. That would probably wreck us. But even if not, it wouldn’t stop there, without us doing something.
”…we could expect a rise of 6°C in 300 years”.
Nick is wrongly assuming technology won’t change for 300 years.
Nick is wrongly assuming that CO2 affecting temps is something wilder than the log fade Because we do know this, his claim is false.
6 degrees in 300 years is not a problem. It a blessing since the Tropics will not change the only thing we might get back to a time when Tundra did not exist and Mammoths roamed the far north. Oh by the way where I grew up 20,000 years ago the land was covered by a mile of ice. Than God for global warming.
If we get 6 degrees the inhabitants of this planet will be in serious trouble.
Because the inhabitants of this planet haven’t survived a warm planet before?
That’s very anthropocentric of you.
“Because the inhabitants of this planet haven’t survived a warm planet before?”
If you are talking humans….Not 6 degrees warmer.
Humans survive from the poles to the equator.
6C is nothing.
This guy is unbelievable, totally down the pipe for the watermelons.
Another very insightful comment from you Mark. So tell me, how are we going to feed upwards of 10 billion people when we remove (it will be under water)a large chunk of the planets quality cropping land. And at the same time, change the growing seasons and weather patterns of the land that is left? I get there is some debate as to whether we will warm to that degree, and personally I think it highly unlikely, but if we do, it is hard to see how we would not be in serious, serious shite.
David Attenborough claims that 50% of the species of life are to be found in the 1% of the Earth called the tropics. Currently, large quantities of corn and soybean are grown in the Amazon Basin.
There are some areas of the world where the local people depend on deltas to grow rice. They could emulate the Netherlands to preserve their agriculture. However, for most of the other grains that the world depends on, they are grown well above sea level and your concerns about flooding are misplaced.
If the Earth warms significantly, even if the oceans rise proportionately, there will be new agricultural opportunities at higher latitudes.
I’m amazed that those like you are so narrow minded that you think that the only way things can be is to be as they currently are.
1) It will never reach 10 Billion.
2) How the heck is 6 to 12 inches of SLR going to flood “a large chunk of the planets quality cropping land”?
3) If the growing seasons change, not that a few tenths of a degree is going to do that, then farmers will change what they plant. (Apparently farmers are a lot smarter than the average liberal, they know how to adapt to changing circumstances)
4) We will only be in serious shiite if we follow the advice you are selling. Billions of people will die from lack of reliable power.
1) It will never reach 10 Billion. That is your opinion, which to date has not been particularly accurate.
2) How the heck is 6 to 12 inches of SLR going to flood “a large chunk of the planets quality cropping land”? If we hit 6 degrees of warming there is no way in hell your 6 to 12 inches(who talks in inches anyway?) is going to be even close.
“3) If the growing seasons change, not that a few tenths of a degree…” Keep up Mark we were talking if we had 6 degrees. That will change everything when it comes to what grows where.
4) We will only be in serious shiite if we follow the advice you are selling. Billions of people will die from lack of reliable power. Opinion again. See number one.
1) It’s more than just my opinion, it’s the opinion of those people who actually study demographic trends. I could add that 10 billion is nothing more than your opinion and your opinions have never been accurate.
2) Ok, if the utterly impossible happens and we get an increase of 6C, we might get a foot or two of ocean rise. The vast majority of Greenland and Antarctica are not going to melt from a mere 6C rise.
3) Actually, very little will change. The areas where growing plants will expand northwards. Those areas near the equator won’t change. A few farmers may have to change which crops they grow. Over all, no big deal. Perhaps if you studied a little you might have already known that.
4) That billions will die from lack of power isn’t an opinion. It’s a fact.
Reply to S Simon.
You have nailed it this time and are now showing your superior intellect ?
The sea is rising at less than 1.5 millimeters a year and despite the doom sayers and the useful idiots it is not accelerating.
In 100 years time it might have risen 15 centimeters ,Simon that’s a whole lot around 6 inches .
Sea levels have been much higher than at present and that is a well proven fact.
100% of arable land is above a meter of high tide except those areas protected by dykes as in Holland .
The constant attack on food producers by activists and greens will ,if not countered strongly lead to food shortages around the world.
Even if the world does warm another degree (there is no proof that it will)agriculture will move further north in the Canada, Europe and Asia and all that land is well above sea level.
It is a well know fact that as countries lift their living conditions and their populations out of poverty their birth rates drop .
If the UN was genuinely worried about global warming they would put all their effort into on lifting every country in the world out of poverty .
Instead billions of dollars are wasted on trying to control the climate.
Gwan
“S Simon” Sensible Simon?
One can only hope!
Simon if science is correct an humans came out of Africa I would say you’re wrong. Europe is especially northern parts are cold than the equatorial Africa. So human easily survived 6 degrees.
Look at how technology has developed in the last 100 years. The Wright brothers made the first flight in December 1903. Now we are able to send spacecraft across the solar system and beyond and man to the moon.
We now have technology that would have been regarded as magical in the early 20thC and no real conception of what our technology might be like in another 300 years.
We are resourceful and will adapt to the situation if and as it develops over those years.
However there is absolutely no evidence to support any such silly assumption. If frogs had wings they wouldn’t bump their ass so often.
You people have run out of qualifiers … if, perhaps, maybe, could, might … are the basis of ALL AGW papers. That isn’t science. That’s sooth saying. Your science needs nothing more than a deck of Tarot cards and a Ouija board.
My reply was directed at Mal who thinks 6 degrees is no problem. I wasn’t the one making the assumption.
6 degrees over 300 years would unlikely cause many problems, considering how those temperatures are calculated at present. An average of 4 degrees increase at the poles wouldn’t even be noticed. The other 2 degrees is nothing. The Younger Dryas recovery saw an increase of ~10 degrees in under 50 years. Humans and all other life survived it.
Your assumption that 6C will mean big trouble isn’t an assumption?
I’ve always been fascinated by the ability of liberals to redefine words on the fly.
Especially since Man’s evolution and history proves that mankind has repeatedly handled warm temperature increases, well over 6°C.
That is not an assumption. It is proven.
Silly’s panicking and screaming that doom comes with 6°C increase, is pure assumption and religious belief.
No facts, all opinion and emotion.
As is typical of silly, silly projects prejudice, fears, fright and dooms based on goofy belief.
Never mind that all of the climate doom claims are solely based upon personal prejudices, not history as mankind repeatedly experienced over millions of years.
Alarmists have joked about their specious temperature dooms whether their false temperature limits are scary enough to frighten people to sacrifice civilization.
As if that is not a silly enough reason, alarmists demand populations give up inexpensive household heating, inexpensive dependable travel, grocery stores full of food and modern living and guaranteed freedoms in favor of despotic tyrannical socialism.
Alarmists blame mankind for all the temperature increases, without proof; worse without having any clue why.
Nor do alarmists know how to achieve their specious temperature reductions.
Simple Simon,
Do you mean like the last few times that the planet was 6 degrees warmer? I believe if you look at the geological record of those eras you will find that life was flourishing, just as the highest levels of biodiversity are our tropical forests and seas, like the Coral Triangle!
What do you have against abundant and vigorous life? Is this some sort of twisted Calvinistic bent in your cult beliefs? Maybe you are like the religious groups that are against dancing because it can lead to sex!
For the sake of the planet you probably should!
“Simple Simon,” Childish put down. I win.
And that’s the only win you’re ever likely to hope for, even when you really look hard … as you just did.
An accurate description, and you never answer a question! What is different about life forms now? Are you claiming they are all evolved for Ice Age conditions?
Your lack of adult behavior only makes my nickname for you more apt, and telling!
Now that you have received your participation trophy, why don’t you just go home and celebrate.
What is your prize?
This?
https://recordsetter.com/world-record/smallest-trophy/5761
Don’t sneeze!
No! Not a childish putdown. You earned that nickname. Through refusal of all legitimate knowledge; rejected all facts; relied repeatedly on the same idiotic links; and nonsensical thread bombing.
Matter of fact with Stokes recently crowding you in making specious claims, your absurd inanities have gone well below pedantic ignorant.
You’ve officially earned the lower case sobriquet “silly”.
Lol…serious like Russia colluuuusion 😉
Just ask Rachel Madcow about this…
Like tax evasion….
Yet another lie being pushed by Simon.
Total BS, but who cares, we have a policy to push.
Triple-S! How you feelin’ about yer guy Dementia Joe these days?
6 degrees in 300 years is fantasy. Navier Stokes systems can not be meaningfully predicted more than a few days. Any global warming fantasy that requires lengthy prediction of the future can be safely disregarded.
MAL,
Six degrees of warming does get us back to the Phanerozoic average temperature of 20 degrees. So, it may be a blessing.
No-one tried to feed 7 billion people in the Phanerozoic. Maybe its possible, maybe not.
All the evidence show that plants loved the Phanerozoic. Not surprised that you didn’t know that.
A little more heat means longer growing seasons and an expansion of the areas where growing food crops is possible.
Add to that the extra growth made possible by more CO2, and food supplies should expand dramatically.
Nick, Life was much more abundant when temperatures were warmer, plus there was far more arable land and precipitation. We live in a very cold time geologically. That is why it is called “ice house.”
Errrr……at the moment we are in the Phanerozoic so what ever the world’s population is we are feeding it fairly well.
In areas where people aren’t fed well it’s generally due to management problems [a bit of war or terrorism or bog standard government corruption] rather than climate problems.
I have to wonder what kind of low grade troll would downvote a comment like this one and the three below.
Stokes groupies.
Feeding people will never be an issue. With increased CO2 and warmth (always a benefit to plant growth) this planet will continue to be bountiful. As the world’s populations continue to improve their economic condition, birthrates will drop. Already China is well below replacement birth rate. Others will follow. The solution is now and always has been; access to affordable energy.
You need to abandon whatever sources you’re getting your flawed information from.
Hey Nick ,you seem to be very clued up .Here is a Question for you to show off your knowledge .
What caused the warmth in the Phanerozoic ?
And then tell us why it did not runaway once the temperature rose that high .
You alarmists believe that will will happen if we don’t destroy our civilization NOW.
In that highly unlikely situation I suppose we might eventually find the cause. However, until we do find some empirical evidence for the warming to date that can’t be explained by natural variation, your proposal is ludicrous. So far all available evidence, on geological time scales, indicates the planet has been cooling steadily since the Holocene Thermal Optimum. Your whole argument is unpersuasive and based solely on failed models, very fragile conjecture and bad science supported solely by statistical tricks.
You need to get off that leaking boat you’re furiously paddling. You’re looking more and more like a fool with each stroke.
Hey Nick, lets get back together in 300 years and see if you are right!
Nick,
You linearly extrapolate 16 years of good data? The AMO and PDO oscillations are much longer than that. That is barely one solar cycle. You are truly a candidate to lead the IPCC.
Nick is an expert sophist and is willing to use whatever argument supports the position he has been paid to support.
Will dowsing still work in this +6°C hothouse?
“You linearly extrapolate 16 years of good data?”
It’s an existing trend. It might decrease, might increase. You need to deal with the possibility that it may continue. Of course, something may turn up. Or not.
You also have to deal with the possibility that the planet will get hit by a massive asteroid tomorrow and all life will die.
There isn’t a shred of evidence to support the belief that most, much less all, of the recent warming is being caused by CO2.
And no, computer models aren’t evidence.
Really!? May continue!?
How many small weather cycles last for centuries?
Answer, none.
Pathetic nonsense bleated out to support a specious absurd implied doom.
Thanks for confirming that you are completely clueless. But we knew that already.
On the other hand, back when the earth’s atmosphere held over 3000 ppm of CO2, we had an ice age or two.
It really didn’t seem to stop coal being produced from tropical life at the pole or at Svalbard.
Tropical climate at the pole, who would have thought the world would survive that?
By living in a city, one contributes to the ‘heat island’ of the city, and that heat island radiates far more heat to space than a cool farmland. That effect will increase as the world urbanizes.
Nick, as the reationship of co2 concentration to temperature is logarithmic, you only need to change exponential co2 growth into linear growth, and that is already happening. The world is right on track of the mild SRES A1T pathway.
Nitpick Nick don’t do non-linear, only linear fits for him!
The Earth has cooled 0.1C since 2016 which means it will cool by 2C by 2100.
There you have it. Proof positive!
I wonder if Nick will complain about linearly extrapolating short term trends?
Nick,
I’ve said this before: The whole concept of a global average temperature is iffy.
We can measure a local temperature every second of the day, every day of the year, and come up with an average local temperature, but it is meaningless.
The average temperature in Accrington on June 21 may well be 18C and on December 21 the average temperature may be 4C. To then average out every temperature measurement for 365 days and declare the average temperature in Accrington is 9C is completely meaningless.
Compounding the problem by averaging the temperature for 100,000 stations and declaring the average global temperature is 14C is the height of folly.
Follow that up by averaging sparse data from across the globe for 1000 years or more and declaring the earth is burning up is insanity.
“declare the average temperature in Accrington is 9C is completely meaningless”
Well, if I mention that the average in Melbourne is 16.2C, there is information there. You might even want to move.
But in fact CliSci generally works with anomalies. That tells you whether the year was warmer than average or not. Many people find that meaningful.
“declaring the average global temperature is 14C is the height of folly”
and deprecated by CliSci. Again, anomalies.
“average or not”
…but that average is calculated from a very short period of time, less than 150 years.
The Medieval warm period lasted 300 years, similar periods of time for the Roman warm period, not to mention the Little Ice Age.
Just how meaningful is the latest anomaly from the average?
I have a chart showing that the little ice age was the coldest the earth has been in over 6,000 years.
Maybe 8.000 years. Without any doubt, the Little Ice Age was the coldest climatic period of the Middle to Late Holocene Epoch.
However much warming humans may or may not be responsible for since the 1800’s, the starting point was fracking cold.
Nick, I’m curious about your view on the use of 30-year window for anomaly calculation verse a more standard seasonality adjustment typically used in time series analysis. I find the the whole anomaly approach extremely ad hoc.
I write a lot about that – see here, for example, or more extensively here. I think there is a better way – least squares fitting of a statistical model – which requires no fixed interval, and that is what I use in TempLS. But a fixed interval is OK. The main reason for seeking as long as 30 years is to avoid month to month noise, which is bad if you build it into the anomaly base.
How is knowing an anomaly of a meaningless average giving us information that is meaningful?
And averaging averages still does not remove the inherent uncertainties in the actual sanded-over temperature measurements.
Never has, never will.
Your tenths and hundredths of a Kelvin are noise.
“Many people find that meaningful.”
And many people believe in the Tooth fairy or Santa Claus. So what?
It’s like consensus science. You don’t need actual data, you just have to believe what you are told to believe.
You can choose to find no meaning in it. That is just you.
Santa Claus brought me GI Joe’s… I think the best the Tooth Fairy ever brought me was an occasional quarter. Santa Claus was meaningful… Now, I’m fairly certain that Easter and Halloween were the reasons the Tooth Fairy was such a cheapskate… 😉
Hey! You can average the temperatures of Capetown S.A. and Novosibirsk Russia and get a “proxy” for the entire globe!
No-one does that. Use anomalies.
A deceptive term in and of itself.
UAH use anomalies for their various global temperature series. Is Roy Spencer being deceptive?
Nick,
I gotta give you credit for hanging in there… 🙂
It is his job, after all.
Nicky,
As you’ve determined that human source CO2 is responsible for our “climate emergency,” the only responsible thing for you to do is get completely off the grid; maybe homestead in Antarctica, I hear that the land there will soon be in great demand, so you can get in on the ground floor! Be sure to send pictures of your endeavors, as we all look forward to being enlightened by you! Of course, the internet is FF powered, so use snail mail!
Even better, why not take the emergency exit! It’s got to be right around here somewhere! Be sure to take all your little friends along; we’ll just have to party along without you, as the Earth greens and warms slightly! Without all you hysterical religious nuts throwing a wrench in the works, we can get back to some REAL science; like studying the solar and oceanic cycles that actually drive climate change! Maybe if we stop wasting money on paranoid fantasies generated in computer models, we can do something important; like figuring out how to prevent the continuation of our planet’s descent into a ball of ice, or stopping the looming suffocation of plant life as CO2 drops below 150ppm in the next few million years! Maybe we can even get up out of the gravity well permanently, with habitats on the Moon, Mars or the moons of Jupiter! There are endless possibilities if we just stop wasting time and money on junk science and paranoia!
Think of the children!
It is odd how Nick uses a computer
Nick,
Please stop being sloppy. There is no great confidence that the world cooled 6C going into and out of the last glaciation, as Andy May has just explained.
What drastic effect was had by the alleged change of 6C around the Ice Age? Do we really know what went on in central Africa, for example?
“Stop the acceleration …”. What acceleration? By conventional measurement, the globe cooled 0.5C 1940 to 1970 – if that had continued we would have been roughly 1.5C cooler than 1940, globally. Oh, the gorror of cherry picking dates!
Are you feeling crook from a Covid injection? You are usually more tight with your discussion of numbers than in this effort.
As I type this at 7:20am EDT, sea level in Portland, Maine is rising at the alarming rate of about 58cm/hr, which has been accelerating since 5:30am EDT, a pre-deluge period when sea levels were unchanging.
At the current rate, all of New England, including its highest peak, Mount Washington will be inundated within 138 days, provided that at least we can stop the acceleration.
Please send me a lifeboat!
The water continues its relentless unprecedented rise! The acceleration after three hours, 6.5 minutes just keeps getting worse! Half the beach has disappeared under the waves! We must act quickly!
With the help of EurekAlert! I have studied the seaweed and crustaceans that are now inundated by the onrushing Atlantic. No one can tell if these species are able to adapt to this sudden change. We estimate that 105% of the species in the oddly-named intertidal zone are likely to be extinct by this afternoon, if we don’t act immediately to implement world-wide communism.
Never mind. It looks like the ocean is now disappearing at an unprecedented rate. If this keeps up what will the fish do?
This ocean weirding must be caused by fossil fuel burning!
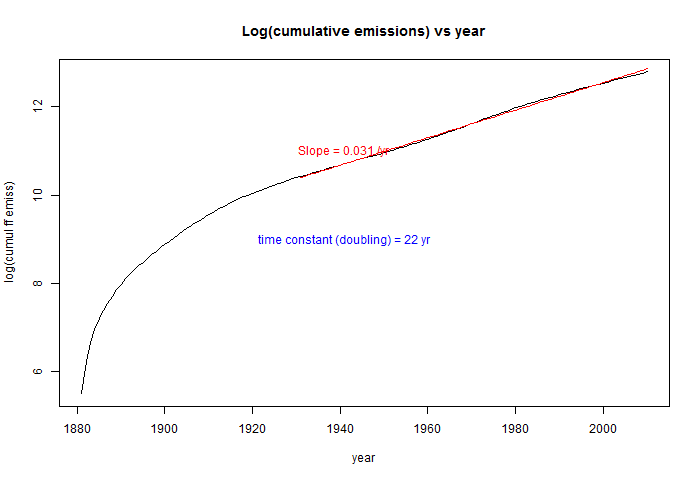
Nick, you are knowingly lying and we know that you know that you’re lying. How do we know that you know that you’re lying? Even if the recent warming is all anthropogenic, and there’s cause to doubt that, the effect of the CO2 concentration on temperatures is known to be logarithmic, and you know that. We know that you know. The next increment of CO2 will have less effect than the last (equal) increment. So by intentionally ignoring what’s known to you that invalidates your non-credible alarmist claim, you are knowingly lying. The real question is why are you lying, Nick?
Scientists almost always refer to Climate sensitivity as in degrees per doubling. The log effect is well understood. But the thing is, our cumulative emissions have been increasing exponentially. Here is a plot of cumulative emissions on a log scale
Better loosen whatever you have bundled around your neck to ward off the Oz winter, Nick! The blood is not getting to your brain.
First you’re extrapolating a 60-yr cyclical trend out 300 years off the up trend, then you’re concerned that an effect that is already long ago approaching an asymptote is going to be a catastrophe if we hasten toward the asymptote a bit faster.
Some suspect that you’re more clever than that. I’m willing to believe that you’re not lying, just having an ischemic moment.
Now you’re lying in a (feckless) attempt to dig yourself out of the hole that you’ve dug for yourself by lying in the first place. You’ve plotted cumulative emissions, NOT CO2 concentration. Temperature DOES NOT scale with cumulative emissions, it scales with the CO2 concentration which is NOT growing exponentially now and will NOT grow exponentially over the next 300 years. In fact, almost all of the CO2 concentration models used by the IPCC have the CO2 concentration starting to flatten in the next ~50 years.
https://www.ipcc-data.org/observ/ddc_co2.html
There are two things you should know:
1) No physical process grows exponentially for more than a short period. There are limitations to growth. I suspect that you know this.
2) You will not be able to climb out of a hole you dug for yourself by standing on your own shit. You’ll just sink in and drown in it. You clearly don’t know this.
You didn’t answer my question, why are you lying, Nick?
You are getting very shrill.
You’ve been caught out in a lie and your only response is to whine about getting called on it. Learn, Nick. Your B.S. isn’t going to fool anyone.
Our emissions are increasing exponentially?
Nick, is there any lie that is beneath you?
If out emissions of CO2 were increasing exponentially as you are paid to say, then it should show up in how fast CO2 is increasing in the atmosphere. Yet the facts show that the rate of CO2 increase is linear and has been for many decades.
Reality hasn’t been kind to you today, has it?
Here is the plot of increments. Not so constant
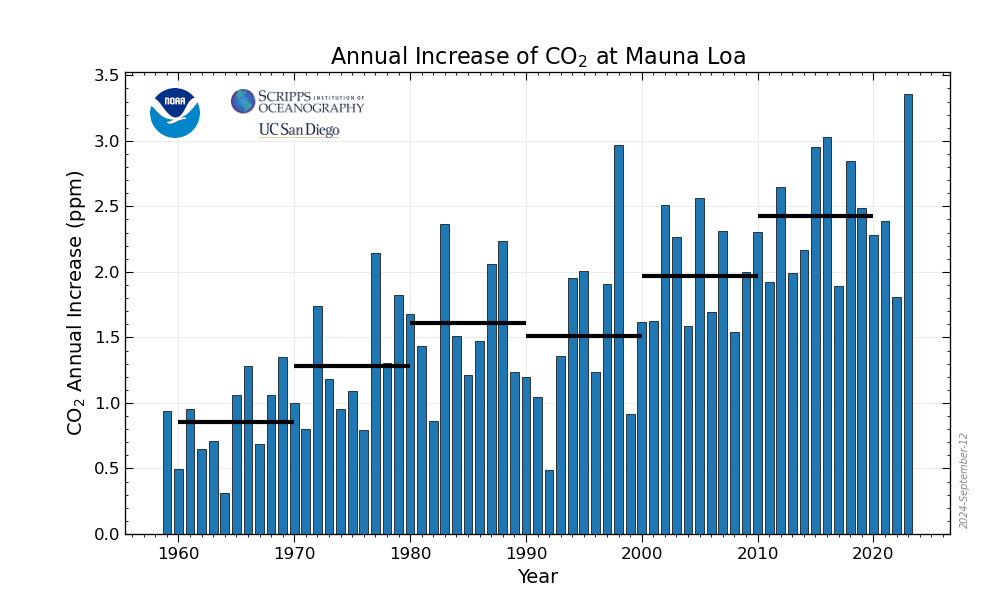
And here is the Keeling curve itself. Not linear

In 2006 I was on a ship in Glacier Bay, Alaska. We were given charts showing the melting of the 65 mile long glacier which occupied the bay about 1750, per charts made by mariners mapping the coastline. Further charts documented the melting of that glacier, which started prior to 1800. Most of it was gone by 1900, prior to the invention of the airplane and the mass production of the automobile. If we caused the melting of that glacier, explain how we would have stopped it prior to 1900, given the population back then plus the lack of CO2 from autos and airplanes.
Nick,
That’s not exponential, and you know it. Why? The highly variable growth rate that you, yourself posted. An exponential isn’t even the best fit to the Keeling curve. A quadratic, for one, is a better fit. And the quadratic turns over, just like almost all IPCC models for the CO2 concentration which are more sophisticated than your skewed eyeball.
You’re obviously a fool for posting stuff that actually refutes your bogus claim.
It’s a lot closer to linear than it is to exponential as you claimed.
Thank you for once again demonstrating that changing the subject is your highest intellectual skill.
Nick.
Really sorry you have to contend with the other GHE fanatics.
😝
👇✌
cheers
Provided your linear projection held true for those 300 years.
Yes, that is the default calculation. Could work out better. Or worse.
Or somewhere in between! You really haven’t said anything worth taking note of. Think of all the little electrons you have wasted to say nothing/
Where is the acceleration? Show it!
Ask, Andy… Will you silly!
Newest and flattest of them all …
LMAO … Nick Stokes has now become invent a fact stupid. Nick you probably need to go see a doctor.
I think this is already superfluous. A little more respect, friends!
More recent …
ICU.
The Northern Hemisphere versus Southern Hemisphere, same paper.
Fig 2a and 2d are of the polar regions only actually.
Interesting that the rise in average temperature over the past 70 years is slightly more than the accuracy of individual instruments.
Not really. What would be more interesting is if 10000 individual instruments all had their error change in the same direction as needed to provide this warming.
What do you think GISS did?
I know what GISS did. I myself calculate the global average anomaly every month using unadjusted GHCN data and different methods, and I get very similar results.
What is the justification for a “global average anomaly”?
It is a good measure of whether the world is warming.
And it is what Andy is writing about.
No, it is a measure of whether the world has warmed. You can’t meaningfully predict Navier Stokes systems.
Well, THAT explains it then. No wonder things have gotten so out of hand. You produce a completely meaningless set of numbers every month, then apply failed conjecture to it. Hurrah for you.
It’s the “and different methods” that worries people.
“It’s the “and different methods” that worries people.”
You can read about them here.
Why would I want to do that? I already get enough comedy relief reading what you post here.
Hi Nick. Once again, you reminded me of the Black Knight from Monty Python: https://youtu.be/A86wo12na8M
“Have at you … you shall not pass!”
Having all the errors go in one direction is normal for climate science.
According to Berkeley Earth the 5yr centered mean in 1948 is -091 +/- 0.098 and in 2018 is +1.000 +/- 0.024. That is a change of +1.091 +/- 0.101. You are right though…this change is about as accurate individual instruments. But that is also misleading because it isn’t the uncertainty of individual instruments that makes or breaks the statistical significance of this result. It is the uncertainty on the result itself which as published works out to +/- 0.101. That is 1/10 the change.
You actually think that -0.091 +/-0.098 is meaningful data? It implies that the distribution is non-Gaussian and the true value has at least a 68% probability of being positive or negative. Rounded off appropriately it would be -0.1 +/-0.1
It says nothing about it being Gaussian, and whether it is positive or negative is of no consequence. It is on a 1951-80 base. The point is that the increase is 1.091. That is far greater than the uncertainty.
Hiding true uncertainties again, how typical.
That is 2-sigma. So the probability of it being negative is 96.8% and the probability of it being positive is 3.2%. I’m not sure what difference it makes though whether it is positive or negative since it is an anomaly.
“Later the statistical techniques and the proxies used to generate the hockey stick were shown to be invalid by Steve McIntyre and Ross McKitrick (McIntyre & McKitrick, 2005)”
No, they weren’t. M&M griped endlessly about the construction of the first principal component in MBH98, but that is not the hockey stick. In fact in 2005 (Energy and Env) they did what should be the prime exhibit – a full reconstruction using what they consider to be proper methods, and got this result:

The top is by Mann’s method, which they regard as faulty; the bottom is with that, and a data issue, corrected. There is virtually no difference.
Of course, since then many other reconstructions have been made, using many other methods. The results are always hockey sticks.
How do these results, even Mann’s worst case scenario compare to mid-Holocene temperatures?
Mann’s work went back 600, then 1000, and then much later 2000 years.
You did not answer my question. In fact, it was a pathetic attempt at a complete dodge.
Nick is known for his skill at not answering the question he was asked.
“Nick is known for his skill at not answering the question he was asked.”
Mark, assuming you have a shred of integrity, I am wondering how you could possibly say that. Nick answers a load of questions and most replies are a very specific to the question asked.
Poor Simon, he actually thinks that he’s made a valid counter argument.
I didn’t say that Nick never answers questions.
When you have figured out the difference, I will accept your apology.
“Nick answers a load of questions and most replies are a very specific to the question asked.”
Nick dodged my question entirely. I wonder why.
“Nick answers a load of questions and most replies are a very specific to the question asked.”
And then, after popping that particular pus blister of a post, he is accused of “nitpicking”. These posts are supposed to bolster denial overall, as the repliers tell Nick, so any criticism of their bases is “nitpicking”.
Nick has a long history of answering questions in the best tradition of a sophist. He provides an answer that best defends his position, even if it is a strawman, red herring, or unconventional interpretation.
And of course the usual sycophants then show up to applaud him and assure him that he is the smartest person on any board.
McIntyre & McKitrick, 2005 was in GRL. McIntyre & McKitrick, 2003 was in Energy & Environment. The figure you posted is in neither paper.
Figure 1 from MM 05…

Figure 7 from MM 05…
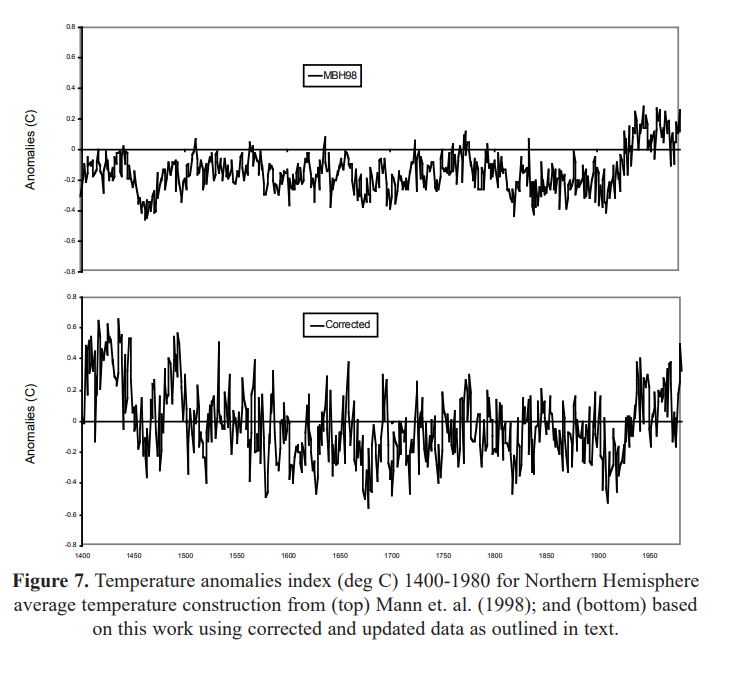
Figure 1 from MM 03…

Figure 3 from MM 03…

It is figure 1 in this 2005 E&E paper
“THE M&M CRITIQUE OF THE MBH98 NORTHERN HEMISPHERE CLIMATE INDEX: UPDATE AND IMPLICATIONS”
Journal page here.
The abstract…
They were comparing MM 03 to Mann’s correction of the Hockey Stick.
From page 70…
“completely reconcile the differing results of MM03 and MBH98″
Yes, they did that in Fig 1. And the answer is that if you look at the actual recon, rather than the first principal component PC1, the supposed errors made very little difference.
MM 05 in E&E was not addressing MBH 98/99. It was addressing Mann’s 2004 corrigendum (correction) of MBH 98/99. The archived data from the corrigendum made the 20th century about the same as the 1400’s.
MBH 98 had the late 20th century significantly warmer than the 1400’s.
MM 05 (E&E) figure 1 has 3 panels. In the top panel they emulated what Mann outlined in his 2004 corrigendum, the middle panel is Mann’s archived Gaspé version and the bottom panel is the archived centered PC version.
The archived centered PC version had the late 20th century slightly cooler than the 1400’s. This is why M&M wrote:
Abstract…
From page 70…
Yes, McIntyre’s arbitrary discarding of the 1400-1450 Gaspe cedars data left very little remaining in that section, with unreliable results. But the argument about methods was about a supposed artificial hockey stick in the modern period. Here (from here) is a plot of the top and bottom panels, superimposed.
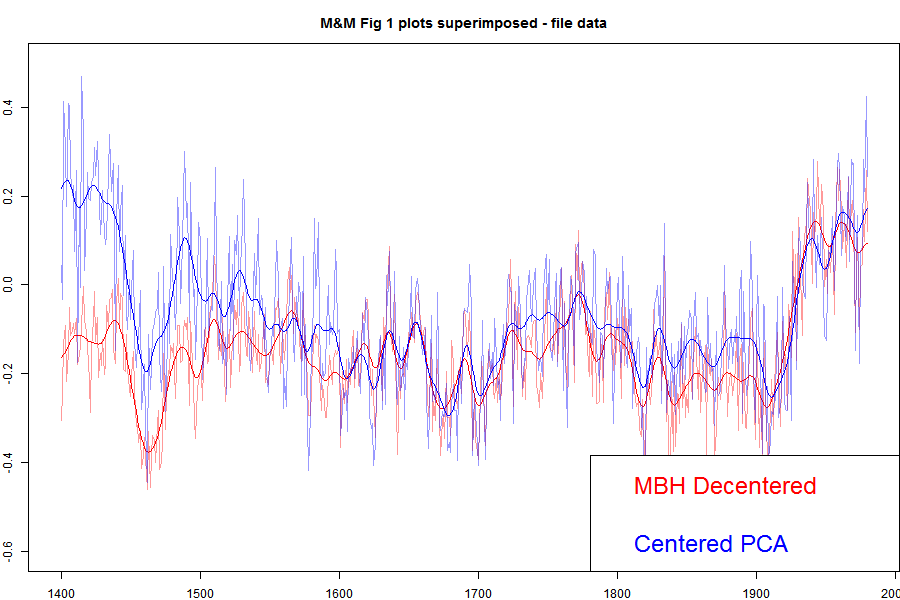
The only real difference is in the 1400-1500 period, caused by the Gaspe omission. There is no real difference in the last two centuries. If anything, the original MBH version gave a slightly cooler late LIA.
He should keep invalid data, just because it was the only data available?
The data was valid. The M&M objection was that it started in 1404, not 1400. So they ditched, not 4 years, but 50.
Nice spaghetti, what is the sauce?
“The archived centered PC version had the late 20th century slightly cooler than the 1400’s.”
An irony here is that MBH98, which covered 1400-1980, was originally bashed for its failure to show a MWP. Then a few years later, even sceptics seemed to embrace the notion that the MWP ended before 1300. The M&M no-Gaspe recon, with warm 1400s, is out of line with just about everything that has been found since. MBH98 had it right. Here is the AR4 plot of later recons (Fig 6.10)

The title of MM05E&E was
“THE M&M CRITIQUE OF THE MBH98 NORTHERN
HEMISPHERE CLIMATE INDEX: UPDATE AND
IMPLICATIONS”
It is directly addressing MBH98. They say
“However, we believe that we have sufficient information in hand to:
(1) completely reconcile the differing results of MM03 and MBH98;
(2) establish the non-robustness of MBH98;
(3) reject the temperature reconstruction in MBH98.”
Mann correctly says that the corrigendum did not affect the results. McIntyre made it affect the results by using the four missing years of Gaspe data to omit the entire section 1400-1450, which then leaves very little data. That is why that early section then rises to modern levels.
Nick,
All serious reviews of Mann’s work came to the conclusion their statistical methods were flawed:
Nick, I can’t believe you admitted that! The results are always “hockey sticks” because the method Mann used always creates hockey sticks! His method creates hockey sticks from random red (Brownian) noise! This has been confirmed by everyone who has looked into it. Mann’s methods are crap.
“ His method creates hockey sticks from random red (Brownian) noise!”
With the aid of a lot of sleight of hand by McIntyre. He fed in red noise, but then selected, without telling us, a subset of P1 which looked most like hockey sticks. Then from that he selected some to graph.
In any case, it is talking about the first principal component, P1, which is all he ever showed except for this lapse in the E&E paper. When you recombine the components to make a recon, that all sorts itself out.
The reason that people since got hockey sticks is that, that is the reality. They weren’t using the centering methods that M&M criticised.
“The reason that people since got hockey sticks is that, that is the reality.”
WUWT meets a hockey stick.
https://tinyurl.com/rkrfpzys
The mere fact that the data doesn’t support your religious convictions will never impact your opinions.
And did you bring this up on Climate Audit at the time?
I wrote about it here. And there was extensive discussion at CA, to which I contributed. I am featured in this thread, from which you can follow links to earlier.
Thanks for pointing me to “Sliming by Stokes.” It is quite good and I’ve not seen it before.
https://moyhu.blogspot.com/2014/09/what-steve-mcintyre-wont-show-you-now.html
Yes. Steve McI does not take kindly to people pointing out his chicanery.
Nonsense. The reality is a whole lot of statistical jiggery-pokery wildly short on empirical evidence. The raw data basis for MBH98 is laughable. Trees do not make very good thermometers even as proxies. There are far better proxies for temperature and doing historical reconstructions using a composite of many different kinds of proxies from many locations around the whole hemisphere produce nothing like a “hockey stick”.
If whatever “data” you’re using, combined with the conjecture you rely on, is giving you the poor results that combination is getting (regular failed predictions); don’t you think it’s time to stop doing it? Constant failure has got to be demoralizing.
Nick,
What you are saying is nonsense. Mann only used the top three or five principal components, depending upon the paper. The National Research Council and the Wegman Committee confirmed M&M and provided the code and proof. Wegman (a famous statistician, now retired) even explains precisely why Mann’s method is flawed.
Most who have studied all this, including me, do not think Mann understood what he was doing. There was probably no fraud, except later when he hid his techniques. I think he read M&M and the other critiques, like Soon, et al., realized he had made a serious error, then tried to hide it.
But fraud or not, what he did was crap, and his thesis advisor should be fired. A true statistician should have reviewed his thesis. And why the IPCC bought it without checking it?? I don’t have enough expletives, and if I used those I know, Charles would ban me.
Nick,
A couple of more points.
Mann’s method was decentered, a quick read of his papers confirms this.
Because his calibration period had a rise at the end, the first few PCs always had a rise at the end. Mann only used the top PCs.
Wegman did not plagiarize anything, Bradley’s book was referenced in the text and the figures, that claim by Bradley was red-herring BS.
Extract from textbook Paleoclimatology: Reconstructing Climates of the Quaternary by Raymond Bradbury.
Extract from the Wegman Report.
While Wegman does cite Bradbury’s book correctly where it is quoted elsewhere in the report, this and other sections from other sources, including wikipedia are simply copied with minor edits and no attribution. This is plagiarism pure and simple, it would have been sufficient for the text to fail any decent review, but then it never was peer-reviewed. It is sloppy scholarship and speaks to a lack of relevant domain knowledge.
John, total BS, sorry. This was investigated more than once, everyone, on both sides of the debate, agreed there was no plagiarism and everything was properly referenced. Drop it, it is a lie, pure and simple.
You are defending the indefensible. But here goes – show me how a reader could discover that the text above originated from Bradley and not Wegman.
I’ll wait.
everyone, on both sides of the debate, agreed there was no plagiarism
Not quite everyone.
“An influential 2006 congressional report that raised questions about the validity of global warming research was partly based on material copied from textbooks, Wikipedia and the writings of one of the scientists criticized in the report, plagiarism experts say.
Review of the 91-page report by three experts contacted by USA TODAY found repeated instances of passages lifted word for word and what appear to be thinly disguised paraphrases.”
https://www.usatoday.com/weather/climate/globalwarming/2010-11-21-climate-report-questioned_N.htm
The GMU whitewash amusingly redefined the copying as ‘paraphrasing’. Whatever. But then when Wegman and co-author Yasmin Said published a paper based on the Social Networking portion of the Wegman Report (that would be the bit they got from wikipedia, amongst other unattributed sources), it had to be retracted because ‘it contain portions of other authors’ writings on the same topic in other publications, without sufficient attribution to these earlier works being given.‘ and Wegman received an official reprimand from GMU because of, um, plagiarism.
https://www.sciencedirect.com/science/article/pii/S0167947307002861
Nothing to see here, move on. 😉
Here is WUWT at the time. There was massive plagiarism. Here is Climate Audit.
Nick, There is a lot of misinformation about this out there, probably due to liberal bias and bad reporting, this is the result of the investigation at George Mason University, which I believe:
The charges are total BS, no writer references every paraphrased quote, nor is it expected. These are charges that are a smoke screen to hide the substance of the Wegman Report, which is devastating to the hockey stick.
The public letter is here:
http://i.usatoday.net/communitymanager/_photos/science-fair/2012/02/22/GMU-STATEMENT-WALSCHx-large.jpg
Andy,
Like McIntyre, you always divert to Bradley’s complaint that his work was plagiarized. That was bad, but only a small fraction of it. The really gross stuff was the lifting of the social network analysis from wikipedia and elsewhere. That was a large slab of the report, and led, by inclusion in a later paper, to the retraction of that paper and the reprimand from the University.
There was also a plagiarizing of the statistics. He even, when he said he had reproduced McIntyre’s results, just plotted numbers from McIntyre’s files. You can tell because they are the red noise plots which should have been uniquely randomly generated. They are identical.
The GMU whitewash did not find there was no plagiarism in the Wegman Report, they somewhat remarkably characterised word-for-word copying as ‘paraphrasing’ and then decided that this did not rise to the level of misconduct. Before going on to determine that an academic paper substantially based on a segment of the report deserved an official reprimand for plagiarism. Go figure.
I’ve quoted two nearly identical passages above, I am content to let people judge for themselves whether this constitutes passing off another’s work as one’s own. Seems pretty plain to me.
As to ‘devastating to the hockey stick’. What planet are you on?. Wegman was tasked with evaluating whether the M&M criticisms had merit. Some did, to be fair, but the impact was negligible (I may have mentioned this once or twice). But Wegman (like McIntyre) never took the next logical step of evaluating the impact of the flaws. We know this because he was specifically asked at the Congressional hearing
“Does your report include a recalculation of the MBH98 and MBH99 results using the CFR methodology and all the proxies used in MBH98 and MBH99, but properly centering the data? If not, why doesn’t it?”
“Our report does not include the recalculation of MBH98 and MBH99. We were not asked nor were we funded to do this. We did not need to do a recalculation to observe that the basic CFR methodology was flawed. We demonstrated this mathematically in Appendix A of the Wegman et al. Report. The duplication of several years of funded research of several paleoclimate scientists by several statisticians doing pro bono work for Congress is not a reasonable task to ask of us. “
In other words, while they identified the potential for decentered PCA to bias the results, they never actually got around to quantifying the size of the bias. Hmmmm.
“Wegman had been tasked solely to evaluate whether the McIntyre and McKitrick (2005) (MM05) criticism of Mann, Bradley and Hughes (1998) (MBH) had statistical merit. That is, was their narrow point on the impacts of centering on the first principal component (PC) correct? He was pointedly not asked whether it made any difference to the final MBH reconstruction and so he did not attempt to evaluate that. Since no one has ever disputed MM05’s arithmetic (only their inferences), he along with the everyone else found that, yes, centering conventions make a difference to the first PC. This was acknowledged way back when and so should not come as a surprise.
But, and this is where the missing piece comes in, no-one (with sole and impressive exception of Hans von Storch during the Q&A) went on to mention what the effect of the PC centering changes would have had on the final reconstruction – that is, after all the N. American PCs had been put in with the other data and used to make the hemispheric mean temperature estimate. Beacuse, let’s face it, it was the final reconstruction that got everyone’s attention. Von Storch got it absolutely right – it would make no practical difference at all.
So what would have happened to the MBH results if Wegman and his colleagues had been consulted on PC centering conventions at the time? Absolutely nothing.”
https://www.realclimate.org/index.php/archives/2006/07/the-missing-piece-at-the-wegman-hearing/
Nick,
I must have told you a million times not to exaggerate. Only 35 out of 91 pages were plagiarised.
https://deepclimate.files.wordpress.com/2010/09/strange-scholarship-v1-02.pdf
“Because his calibration period had a rise at the end, the first few PCs always had a rise at the end. Mann only used the top PCs.”
No, the effect was to create some rise in PC1, with a corresponding reduction in other PCs. PCA simply shifts the same data to a different set of axes. It makes no difference until you restrict to the top few PCs, which contain the non-noise part. When you put them back together, the effect disappears, as M&M inadvertently demonstrated by actually doing a full recon with centered mean.
“Wegman did not plagiarize anything”
Wegman in fact retired under something of a cloud, having been reprimanded by his university when a paper that he submitted based on his report had to be retracted for improper acknowledgement.
In fact, almost the whole of his featured section on social network analysis was lifted from Wikipedia. Wegman blamed a student who was uncredited in the original report. It turned out that they had assigned her the task because she had done a one-week course in SNA, and so counted as the expert.
“All serious reviews of Mann’s work came to the conclusion their statistical methods were flawed”
Translation: I only like the reviews that found flaws and I will ignore the negligible effect those flaws had on conclusions. Wahl & Ammann 2005 showed that the effect of PCA is minimal, and Mann’s choice of proxies was completely justified. You mentioned the NRC report, they did indeed bring up the problems with decentering and wrote this
“As part of their statistical methods, Mann et al. used a type of principal component
analysis that tends to bias the shape of the reconstructions. A description of this effect is given in Chapter 9. In practice, this method, though not recommended, does not appear to unduly influence reconstructions of hemispheric mean temperature; reconstructions performed without using principal component analysis are qualitatively similar to the original curves presented by Mann et al. (Crowley and Lowery 2000, Huybers 2005, D’Arrigo et al. 2006, Hegerl et al. 2006, Wahl and Ammann in press).”
So PCA is moot – as has been shown here before.
The ‘hockey stick from red noise’ canard is also endlessly repeated. It ain’t true. As Nick Stokes said, the type of red noise used had an unrealistically high degree of persistence, the ‘sticks’ produced were small in magnitude and half pointed down not up. M&M then data mined their output for the top 1% most HS like. The hockey stick is highly significant compared to realistic random noise. This was first pointed out 14 years ago.
And while Wegman did cite the source of some of the dendrochronology material in the Report, there were many occasions when he lifted whole sections without any attribution. Then of course there was the copy-pasting from wikipedia….
https://deepclimate.org/2009/12/17/wegman-report-revisited/
And I see you’re still a fan of Soon and Balliunas 2003, a paper so poor half the editorial board resigned in protest at the failure of the review process.
Black is white on Planet May.
The astonishing thing is that, in spite of the obvious, May will be shamelessly trotting out the same bs next month – as if he’d read none of this.
It’s the darn certainty expressed by the alarmists, from Greta to Uncle Joe, that is so damn frustrating. It truly is cult-like. And SO unscientific.
Even newer and flatter …
But Nick S. sez 6 degrees is going to make us all die!
That is a really cool paper. For those interested you can get the preprint here. It has been submitted to the journal Nature. The Osman et al. 2021 results are mostly consistent with the Kaufmann 2020 results. One difference is that Osman shows almost no bump at 6500 BP that is present in other reconstructions. Even Kaufmann shows elevated probabilities of a bump during this era. Anyway, that is quite the hockey stick being shown here. It is a 1.1C rise in 170 years or about 0.65C/century. This compares with the 6.8C rise in 8000 years or 0.085C/century for the interglacial ascent.
Overlooking the major flaw with the “climate change” so called science. Temperature, by itself, is not a useful descriptor or predictor of “climate”. This is especially true of “average temperature”, whether it be average daily temperature or average yearly temperature. A paragraph describing local or regional “climate” would include daily and seasonal variations in humidity, precipitation, wind velocity, and even local flora and fauna, as well as, importantly, variations in temperature– not average temperature. Back when CAGW was the rage, “global temperature” had some meaning, and the hunt was on for the proper location for the rectal thermometer. However, once the focus shifted to “climate science” and “climate change”, any value that had been attached to minute changes to the global average of the annual average of the monthly average of the daily average of the temperature in selected localities was lost.
Andy, I’ve always appreciated your posts.
Just the spatial error and uncertainty belie the use of the word “global” in this discussion.
“Thus, we can calculate a reasonable global average surface temperature.”
No, we can’t. Well, we can calculate one, but it will be physically meaningless. Intensive properties.
Rather like calculating the mean of a Cauchy distribution from a sample. You can do it, but since the mean of a Cauchy distribution is ‘not defined’ all your effort is meaningless.
https://youtu.be/-OWSEzZ-C6w
And? I saw no mention of problems with most of those weather stations being impacted by the urban heat island effect which artificially increases temperatures which Anthony has detailed at length. Nor was it mentioned that the Argo buoys are not stationary, have a limited lifetime of a few years, and the time series only goes back 20 years, and the data is sparse in the first few years because there were far fewer buoys. There is no time series from Argo that has both temporal and spatial utility. They are sampling different places at different times so there is no high resolution map of a temperature trend over time that allows filtering out seasonal changes.
Then there is the significant bias introduced by gridding the weather station data and extrapolating temperatures for vast swaths of the earth that aren’t actually measured, particularly toward the poles. The only global temperature time series that is unaffected by these problems is from satellites and they paint a slightly different picture than the weather station data, when biases for orbital and elevation changes are filtered out as Dr. Roy Spencer’s team has done, but GSS hasn’t (for orbital changes that result in measurements for the same place being taken at slightly different times of day).
I may be wrong, but I take the UAH temperature data that Dr. Spencer reports here each month as the closest to an accurate representation of global temperatures and trends we have going back to 1979. When you look at the plot it appears that there is warming over the last 40 years but curiously, it happens in very sudden jumps over brief 1 to 2 year periods that correspond with large El Niños. In between the El Niños, there is no trend whatsoever. I’d love to hear a convincing explanation for why warming only happens over brief periods and is associated with El Niños. Where is the human fingerprint?
https://www.nsstc.uah.edu/climate/
So, no, I do not accept that 100,000 weather stations and 5,000 Argo buoys are giving us an accurate view of global temperatures until the artificial biases are removed. The US Climate Reference Network (USCRN) does give a much improved view, but unfortunately it’s only for the U.S. Until the rest of the world follows suit and the global data only comes from high quality stations of the caliber of USCRN, I take GISS, HadCRUT, Berkeley Earth and other data from the flawed stations with a grain of salt. UAH and USCRN are the gold standard
To stinkerp, you may find temperature.global API to be of interest.
Well, let’s get real about this. Given that oceans have around 1,000 times more heat content than air – I’m so SURE that Ev-veel Man Made CO2 matters. Denialists are so OOO desperate. /sarc
I submit that when heating increases to a certain level, an El Nino event occurs, increasing radiation to space. Heat islands around cities also increase radiation to space. Surprise, surprise, surprise! “The Climate” has feedback loops that make it meta-stable. Human prosperity, resulting in creation of cities and heat islands, is part of a feedback loop.
stinkerp,
You are allowed your opinion, and your opinion is shared by many. Personally, I think we have pretty good global coverage since ~2005 and since then a fairly constrained global average temperature. I can’t prove it, but it looks likely. Now, that said, I don’t know what it means relative to the past, because we do not have a constrained global average before 2005.
They also avoid mentioning that sea life grows on the surface of the buoy, including sensors.
When coupled with the agency deploying Argo buoys then assuming the manufacturer’s potential laboratory accuracy criteria applies without testing or certifying that the instrument is anywhere near the manufacturer’s measurement capability.
One suspects that the government employees’ merit goals involve number of buoys deployed, not the accuracy of the measurements.
Instruments kept in laboratory conditions need to be recalibrated every few years.
How long has it been since the instruments on the Argo probes were recalibrated.
Is it not the case that there are very few deployed in the Southern Ocean?
It means nothing. 0.8°C is in the noise. Tracking earth temperature by measuring air temperature is like measuring your body temperature by blowing on a thermometer. And, don’t forget, the measuring points were located 40 years ago and cities have moved out around the sensors over time.
Exactly right. The mixed top 100-200m of the ocean acounts for 95% of global warming – 20 times that of the atmosphere.
Nuccitelli (2012)
How to lie with statistics.
Instead of displaying temperature, convert it to scary looking joules.
The reality is that the so called temperature increase is only about 0.03C. An order of magnitude less than the measurement errors of the probes.
Combine that with the fact that they have less than 1% the number of probes needed for adequate coverage, and the claimed warming doesn’t exist.
Well said. I’m looking forward to seeing how Loydo gets out of this hole.
“… Each proxy is tested for significance versus modern local instrumental temperatures and rejected if the proxy fails …”.
Does ‘proxy’ refer to individual proxies or a class of proxies e.g. tree rings in general?
If the former it sounds like the common screening fallacy aka double-dipping or circular reasoning.
Incidentally here is a graph of Bristle Cone cores compared to other US samples:
http://www.climatedata.info/proxies/tree-rings/files/stacks_image_9787.png
Nice graph: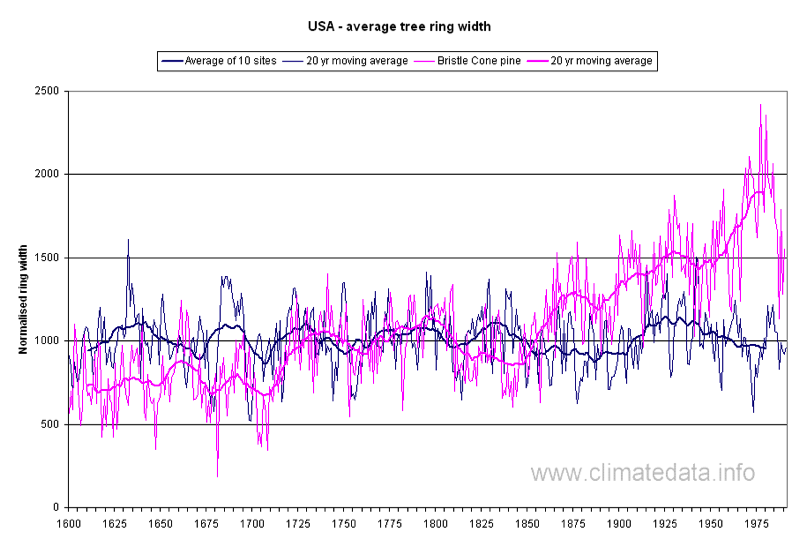
Christopher,
Thanks for the link to another of McIntyre’s posts that I have not seen before. It is a good one. I refer you to Christiansen and Ljungqvist’s 2011 and 2012 papers for a discussion of their treatment of proxies. They are referring to each individual proxy. They test them against local (not global or hemispheric) temperature records. You would be surprised how many proxies do not correlate with local temperatures. They are not cherry picking; they are selecting the best local proxies.
It is a meaningless graph, because it does not say what “other US samples” are. You can only hope to get temperature information from trees whose growth is limited by temperature. That is why they look at trees on the limits, by altitude or latitude. Tree-lines, tundra etc If you just look at a random sample of US trees, then of course you will see no temperature effect.
Nick, Tree ring proxies are crap prior to 1600 AD.
Tree ring proxies are crap, period. There are too many confounding factors that are completely unknowable and hence impossible to remove.
Andy, true or not (not), that doesn’t help the graph make sense. It doesn’t.
That site seems to have a policy never to cite data sources. Fail.
Now that’s funny, an alarmist whining about not sourcing data.
No, the fail is on your part. It takes only a few moments looking at the website to find that it provides a link to where the data came from (ncdc.noaa.gov/paleo/treering), and also provides csv downloads of the data used in each chart. For this particular chart, the download identifies locations and lead authors of each of the ten locations, which then enables the original data to be identified on the ncdc webpage. A bit convoluted for sure, but your comment is nevertheless wrong.
Are you suggesting that trees near the tree-line never experience drought, changes in cloudiness, or annual wind variability?
No. All those can confound the results. You have to choose carefully so that temperature is the dominant effect.
So, you are saying that the trees that are chosen are done so subjectively? That leaves a lot of opportunity for mischief! What is the criteria for choice? Support for the thesis?
You define in time a calibration region and a verification region, roughly covering the last century between them. If the proxy has significant correlation with temperature in the calibration region, it is potentially usable. It must then predict temperature satisfactorily in the verification region. Then it is good to go.
The art of choosing is to find trees that pass the calibration stage, without wasting effort on too many duds.
Hence the “hide the decline” comment.
And how do you figure out which tree in the forest is the one that was only impacted by temperature? Is it the one that shows the curve you were looking for?
Ha ha, the Truth will out!
The problem with ‘global warming’, climate change [if that is more palatable] isn’t the one degree of Celsius since whatever date is cherry picked to prove it’s all anthropological in origin. One degree of global warming has proven to be far more beneficial than harmful. The problem with ‘global warming’ is this treatment that warming is a permanent event.
No one on that side of alarmism has been asked to prove that permanent condition as implied in their terms used like, crisis, point of no-return.
If someone was to ask me which I feared more, global warming by 2 degree Celsius or global cooling by 2 degrees of Celsius. I’d say without reservation that cooling by 2 degrees will have by far the most devastating impact on life on earth. And oddly enough these yahoo’s who’ve pronounce warming as anthropological in origin, will not be able to credibly infer that the cooling, and it is coming, is also anthropological in origin. This is where we see the real emerging crisis. A crisis of science and social polity.
It keeps warning us to move, to action, to change the current situation!!! Although I can not alter the bad hehaviour sigle-handedly, I do behave myself. I just drive my MG V80 out of sheer necessity!
The Navier Stokes differential equations describe fluid flow with changes in temperature and density. They are nonlinear, chaotic, with sensitive dependence on initial conditions. That means that no finite set of past state (temperature, density, velocity, mixture fractions) measurements can ever be sufficient to predict even a single distant future state with confidence. This has been known since 1963 when Edward Lorenz published “Deterministic Nonperiodic Flow” in the Journal of Atmospheric Sciences. Anyone who pretends to predict a distant future state in a Navier Stokes system is either incompetent, or a fraud, or both.
Since the measured data does not justify the proposed actions to combat global warming/cooling/climate change, and the predicted data and past data is meaningless or inconclusive, no action should be taken.
We live in bullshit world. It does not matter what the subject is, once it has been through the corporate media and their colonies it is worthless drivel. These man made global warmist can come out with anything as long as it is in line with the reset agenda and no questions are asked. Just go to USCRN and set the Y axis to 40c (real world temps) and show us where the surface temp has gone up since 2005.
USCRN is for the United States only. It is not an adequate proxy for the global mean temperature.
The global mean temperature does not have a 40C range. It is more like 4C between January and July on a monthly scale, 1-2C over the Holocene on an annual/decadal scale, and 10C over the Quaternary Period on a centennial scale.
Thank you for reassuring us that global changes are not applicable to what may happen in the US.
The difference between the global monthly average high and low is closer to 12 deg. C than 4!
http://wattsupwiththat.com/2015/08/11/an-analysis-of-best-data-for-the-question-is-earth-warming-or-cooling/
“The difference between the global monthly average high and low is closer to 12 deg. C than 4!”
That is not the difference between the global monthly average high and low. It is the globally averaged difference of station high and low.
Quote:”….d has warmed a paltry 0.8°C since 1950 and 0.3°C since 2005. I…”
If you happen to be A Bacteria, living in the dirt and chewing up sugar in all its manifestations, 0.8°C is not ‘paltry’
Depending where you are on the temperature graph, it is the difference between stop/go, walk/gallop, live or die. (then get eaten by somebody else who likes ‘heat’)
In reasonably optimal conditions, which is entirely why you were ‘there’ in the first place, it determines how hungry you are and thus how much CO2 you produce, also organic acid ‘waste’ product.
When you occur in unimaginable numbers, you are capable of making some very considerable amounts of CO2
Also organic acid, which will attack the mineral fraction of the dirt you are habituate and thus release (make = water soluble) ‘most all the nutriments that plants need to be green, growing, healthy and bountiful.
Think on
Is it possible, not beyond the bounds OR for the first time, that NASA have got thing the wrong way round when they attribute Global Greening to extra CO2?
Temperature:
Even warmists, in their statement of Global Warming, refer to ‘Trapped Heat’
Presumably talking about Heat Energy. i.e. Actual real and tangible stuff
Also ‘surface’ temperature
So why is everyone getting all haha ‘hot & bothered’ about the te,mperature of the air above the surface.
Wrong on 2 points.
If you want to measure Climate Change, should you not be recording the energy contained within the dirt? Not the air above it.
Thus why is A Climate Station not comprised an array of energy sensors embedded within, say, a 3 metres on-a-side cube of soil/dirt/actual surface.
That is where The Energy is, that is what drives climate = when that energy takes upon itself to leave the premises and due to whatever size/amount of it there is and how steep the stairs are or deep the lift shaft, it will make differing ‘noise’ (weather > climate) as it does so
And it always will, It is affected by ‘gravity’ of a sort and always wants to fall ‘down’ – after El Sol (only El Sol) lifted it to wherever it finds itself.
What goes up must come down etc etc blah blah
Even Warmists say/admit/acknowledge, you do not get Trapped Temperature so why is everyone going out looking for it?
It makes chasing pots of gold at the end of rainbows, astride a Unicorn, look like a sensible and reasonable thing to be doing.
Temperature is a non-dimensional quantity – thus a thing of Fantasy = just a number that means nothing without myriad other qualifiers
quite quite mad
There are stations out there that do measure soil temps. Most are agricultural schools, “A&M” in the U.S. I haven’t had time to venture into this but would like to.
“Trapped” in this context refers to the law of conservation of energy where dE = Ein – Eout where the change in internal/stored energy is equal to the difference between the inflow and outflow of energy. When Ein – Eout > 0 we say this energy is “trapped”. My personal preferred word choice is accumulate though.
Anyway, scientists definitely track the dE in the land in addition to the air, ocean, and cryosphere. If you want details which reservoirs are storing the accumulated energy and in what proportions I recommend reading Schuckmann 2020.
I suspect that the soil temperature plays an important role in the ramp-up of CO2 in the atmosphere during the Winter.
Golly! I guess I had better pack my bags….
Andy May,
Two neglected factors that I hope we shall see in your Part 2.
Cheers Geoff S
You will see some of that.
Short shorts. We love short shorts.
And tanks. Lots of tanks.
“The negative correlation strongly suggests that temperature is driving CO2 concentration…”
Well, yah, and that is why all of “Climate Science” is a waste of everyone’s time & money.
“Modern instruments covering the globe have only been in place since 2005, plus or minus a few years. If we have accurate measurements since 2005,”
15 years isn’t even Climate. It’s Weather.
Andrew
Actually, we don’t and can’t know that “global warming” (whatever that means) is “happening”. All we know for sure is that there has BEEN a relatively small, and totally benign warmup since the LIA, and thank god for that. We don’t know if that warming is ongoing, and in fact, it is possible that cooling has begun.