Reposted from Dr. Roy Spencer’s Blog
June 19th, 2021 by Roy W. Spencer, Ph. D.
“The magnitude of the increase is unprecedented.”
A new study published by NASA’s Norman Loeb and co-authors examines the CERES satellite instruments’ measurements of how Earth’s radiative energy budget has changed. The period they study is rather limited, 2005-2019, probably to be able to use the most extensive Argo float deep-ocean temperature data.
The study includes some rather detailed partitioning of what sunlight-reflecting and infrared-emitting processes are responsible for the changes, which is very useful. They also point out that the Pacific Decadal Oscillation (PDO) is responsible for some of what they see in the data, while anthropogenic forcings (and feedbacks from all natural and human-caused forcings) presumably account for the rest.
One of the encouraging results for NASA’s CERES Team is that the rate of increase in the accumulation of radiant energy in the climate system is the same in the satellite observations as it is when computed from in situ data, primarily the Argo float measurements of the upper half of the ocean depths. It should be noted, however, that the absolute value of the imbalance cannot be measured by the CERES satellite instruments; instead, the ocean warming is used to make a “energy-balanced” adjustment to the satellite data (which is the “EB” in the CERES EBAF dataset). Nevertheless, the CERES dataset is proving to be extremely valuable, even if its absolute accuracy is not as high as we would like in climate research.
The main problem I have is with the media reporting of these results. The animated graph in the Verge article shows a planetary energy imbalance of about 0.5 W/m2 in 2005 increasing to about 1.0 W/m2 in 2019.

First of all, the 0.5 to 1.0 W/m2 energy imbalance is much smaller than our knowledge of any of the natural energy flows in the climate system. It can be compared to the estimated natural energy flows of 235-245 W/m2 in and out of the climate system on an annual basis, approximately 1 part in 300.
Secondly, since we don’t have good global energy imbalance measurements before this period, there is no justification for the claim, “the magnitude of the increase is unprecedented.” To expect the natural energy flows in the climate system to stay stable to 1 part in 300 over thousands of years has no scientific basis, and is merely a statement of faith. We have no idea whether such changes have occurred in centuries past.
This is not to fault the CERES data. I think that NASA’s Bruce Wielicki and Norm Loeb have done a fantastic job with these satellite instruments and their detailed processing of those data.
What bothers me is the alarmist language attached to (1) such a tiny number, and (2) the likelihood that no one will bother to mention the authors attribute part of the change to a natural climate cycle, the PDO.
1) It would help more to explain the diagram. For example, is the orange signal “Net TOA Radiation (CERES)” commonly called OLR = outgoing longwave radiation, escaping to space?
If so, their classical model of the greenhouse gas effect makes no sense. James Hansen said:
– Hansen et. al. 2011; Atmos. Chem. Phys. 11, 13421-13449. doi:10.5194/acp-11-13421-2011
Hansen says the climate warming is due to a greenhouse effect lessening escaping OLR energy. The diagram shows more OLR energy escaping over time (with increasing CO2 emissions). Opposite to how Hansen’s model works. The greenhouse gas effect model is clearly nuts. It is logically incoherent. It’s also empirically falsified several times over.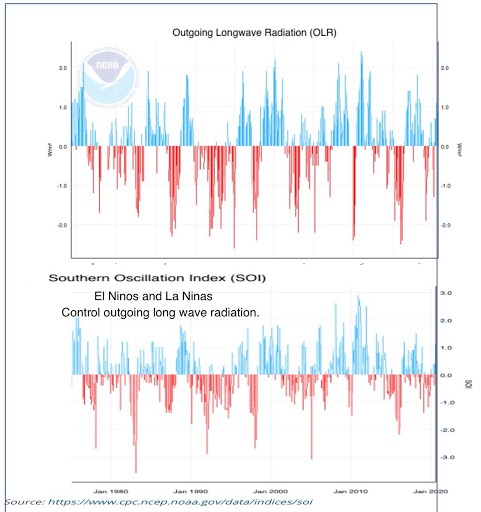
2) Their numbers are subject to massive errors. Such that the error bounds are many times greater than the tiny net signal they claim to see.
3) Their jobs depend on them finding a signal. No signal, no publication, no more grants. It’s not so much the case that they cherry-picked their adjustments to find warming. Although that’s possible. More the case that studies which found cooling, or no warming, never got published; not news-worthy enough.
4) Finally, as the link below shows, The Southern Oscillation Index, SOI, over the Pacific (El Nino & La Nina), determine OLR,
Re: my last point about. This classical greenhouse gas effect model (as explained by Roy Clark elsewhere here), says top of the atmosphere, TOA, radiative imbalance ultimately warms the surface. But the chart I posted shows the surface changes control TOA OLR. Alarmists have inverted caused and effect. They understand things back-to-front.
“the magnitude of the increase is unprecedented.” There is no EXCLAMATION POINT !!!!! at the end of that phrase, thereby diminishing its importance!!!!!!!!!!!!
Aside from attention-seeking behavior and rhetoric, I’m still not sure what these people want. If it’s attention, they are boring me silly, which is why I simply can’t take them seriously. If it’s selling a product, they need to take a look at Iceland, where people are still wearing WINTER clothing in June. You can see that on the live camera sites, when volcano tourists cross in front of those cameras.
And finally, if they’re trying to frighten people with exaggerated language, well – YAWN!!!! Ask them if they’d rather live in perpetual snow and ice and have to hunt for their food. And no, they can’t be veggie-ans in that kind of world, because they’d starve. So would they rather live on a planet that has gone into an ice age? Are they remotely aware that the deserts of this little planet are dreadfully hot daytime, but can and DO drop to freezing cold at night because the air in those places is so dry, there is nothing holding in the heat?
It’s harder and harder to take any of The Them seriously any more. They need to spend some Real Time outdoors, with no bathrooms available, no stores to buy foodstuffs, and shelters they have to set up themselves – and I do not mean camping tents. And watch out for ticks and other nasties, too.
Sara, I agree with your last paragraph completely.
What’s sad is that some of them actually DO spend time outdoors, and still believe their papers and models over what they experienced personally.
And that, TonyG, is SO sad that it is indescribable.
Whatever will they do without a microwave to cook stuff, or a plug-in pot to make hot beverages?
As an engineer I have a good understanding of Thermodynamics and heat transfer including radiation for equipment in pretty much steady state operation, although getting rusty. No experience for the earth’s energy balance
One thing I don’t understand, all the equations I see for energy balance seem to assume this is a steady state process which is OK for most engineering equipment I have experience that might run for 5 years, but not for a process where the sun sets on the earth in “most” places every day and the model does not reflect the actual condition at night when their is no incoming energy from the sun while the earth continues to radiate back to the atmosphere with a portion back radiated to earth, with a gradual cool down absent a weather change . Also this process at every location on earth depends on the time of year, clouds, rainfall and convection.
Can someone explain to me how one creates such a simple steady state model when the actual process is considerably more complex and would require a significantly more extensive calculation procedure as I see it?
It would seem to me that there is considerable uncertainty and variability in the actual factors used to convert the calculations to one temperature (if that is what they do) for the earth and the atmosphere and give lots of opportunity for error and manipulation.
Enlightenment encouraged.
If there is a balance, it’s an extraordinary coincidence. It’s a non-equilibrium system.
Not even in a steady state. There is no thermal equilibrium, no radiative equilibrium, no CO2 equilibrium… and so on. It never was one. They are simply delusional.
It’s a system built on chaos. That is why models don’t really work. There is NO steady state anything, not even water levels, anywhere on this planet.
GCMs are dynamic – no steady state involved.
Something like heating an ingot with 200° torch for an hour, then turning the heat up 5 times to 1000° for a short period. Reckon the effect will just be just the same during the 1000° time as for the average?
This post at NTZ focussing on Gebbie 2021 and some other papers show that global ocean temperatures and changes thereof over the last century are unremarkable. There was three times more heat “trapped” in the oceans during the MWP – or MCA as it’s now called.
https://notrickszone.com/2020/11/05/new-study-effectively-eliminates-confidence-in-human-attribution-for-modern-global-warming/
Yah, no. The atmo has been shrinking in diameter since 2003, it’s an open system that can expand and contract. Atmospheric energy at sea level is regulated by gravity, so unless the air density has been magically dropping in violation of the laws of physics the amount of heat in the atmosphere hasn’t changed.
Meanwhile, another new study shows that Climate Liars have been telling Climate Lies at an alarming new rate.
“Earth has been trapping heat…”
This from NASA, really?
“This from NASA, really?”
They’ve gone off the deep end.
“This from NASA, really?”
No, NASA didn’t say that. The quote is from the Verge article, via Roy.
They said “accumulation”. You are just being pedantically picky, as usual.
According to the TWTW, the abstract claims that the increase is 0.50 +/-0.47 W/m2. It doesn’t state whether that is 1-sigma or 2. Assuming 2-sigma, that means at best, there is a 95% probability that the increase is somewhere between 0.03 and 0.97. Assuming the claimed uncertainty is actually 1-sigma, which is more common for climatology, then it means that there is a 95% probability that the increase ranges between -0.44 and 1.44 W/m2. Both ranges are so large as to make the claim virtually worthless.
However, strictly speaking, when a calculation is shown, it and its uncertainty should be rounded off to show only the digits that share a common uncertainty. Thus, even if the zero is claimed to be significant, the number should be presented as 0.5 +/-0.5. That is, the claimed increase is exactly the same as the uncertainty! That shouldn’t give anyone any confidence in the practical significance of the claim.
Because the data are part of a time-series with obvious auto-correlation, one is not justified in using addition-in-quadrature to calculate the propagation of the uncertainty. That is the one-half watt uncertainty needs to be added to the unspecified starting value uncertainty. We can’t calculate it, but it is going to be larger than 0.5.
CS,
Love seeing an obvious engineer mind in tune with uncertainty and error. You are fully cognizant of and in touch with the physical world as it is. Now compare that to mathematicians who are only in tune with statistics and numbers. Guess who’ll be right in the end!
Jim,
Yes, I have frequently observed that mathematicians are so used to dealing with exact numbers, and non-terminating numbers like Pi and e, that they get cavalier and careless about dealing with uncertainties. Having sat through many a math lecture, the only times I have seen uncertainty discussed was when the chapter topic was was error. Then they promptly forget everything they lectured on because they are focused on process and technique rather than answers.
Most of what I know about uncertainty and propagation of error was learned in physical chemistry classes and the one undergraduate surveying class I took. Dealing with climatology has forced me to review that material.
The 0.50 +/- 0.47 figure is W/m2.decade; not W/m2. It is extremely important to get the units right here.
They do state that the +/- 0.47 figure is 2-sigma. This is in section 3.1, paragraph 2, line 5.