Reposted from Dr. Roy Spencer’s Blog
June 9th, 2021 by Roy W. Spencer, Ph. D.
Executive Summary
A new paper by Santer et al. in Journal of Climate shows that observed trends during 1988-2019 in sea surface temperature [SST], tropospheric temperature [TLT and TMT], and total tropospheric water vapor [TWV] are generally inconsistent, by varying amounts, with climate model trends over the same period. The study uses ratios between observed trends in these variables to explore how well the ratios match model expectations, with the presumption that the models provide “truth” in such comparisons. Special emphasis is placed on the inconsistency between TWV moistening rates and the satellite tropospheric temperature warming rates: the total water vapor has risen faster than one would expect for the weak rate of satellite-observed tropospheric warming (but both are still less than the average climate model trends in either CMIP5 or CMIP6).
While the paper itself does not single out the tropospheric temperatures as being in error, widespread reporting of the paper used the same biased headline, for instance this from DailyMail.com: “Satellites may have been underestimating the planet’s warming for decades”. The reporting largely ignored the bulk of what was in the paper, which was much less critical of the satellite temperature trends, and which should have been more newsworthy. For example: (1) SST warming is shown in the paper to be well below climate model expectations from both CMIP5 and CMIP6, which one might expect could have been a major conclusion; (2) the possibility that the satellite-based TWV is rising too rapidly (admitted in the paper, and addressed below), and especially (3) the possibility that TWV is not a good proxy anyway for mid- and upper-tropospheric warming (discussed below).
As others have shown, free-tropospheric vapor (not well captured by TWV) would be the proper proxy for free-tropospheric warming, and the fact that climate models maintain constant relative humidity with altitude during warming is not based upon basic physical processes (as the authors imply), but instead upon arbitrary moistening assumptions implicit in model convective parameterizations. Observational evidence is shown that free-tropospheric humidity does not increase with tropospheric temperature as much as in the GFDL climate model. Thus, weak tropospheric warming measured by satellites could be evidence of weak water vapor feedback in the free troposphere, which in turn could explain the weaker than (model) expected surface warming. A potential reason for a high bias in TWV trends is also addressed, which is consistent with the other variables’ trend behavior.
Evidence Presented in Santer et al. (2021)
I’ve been asked by several people to comment on a new paper in Journal of Climate by Santer et al. (Using Climate Model Simulations to Constrain Observations) that has as one of its conclusions the possibility that satellite-based warming estimates of tropospheric temperature might be too low. Based upon my initial examination of the paper, I conclude that there is nothing new in the paper that would cast doubt on the modest nature of tropospheric warming trends from satellites — unless one believes climate models as proof, in which case we don’t need observations anyway.
The new study focuses on the period 1988-2019 so that total integrated water vapor retrievals over the ocean from the SSM/I and SSMIS satellite-based instruments can be used. Recent surface and tropospheric warming has indeed been accompanied by increasing water vapor in the troposphere, and the quantitative relationship between temperature and vapor is used by the authors as a guide to help determine whether the tropospheric warming rates from satellites have been unrealistically low.
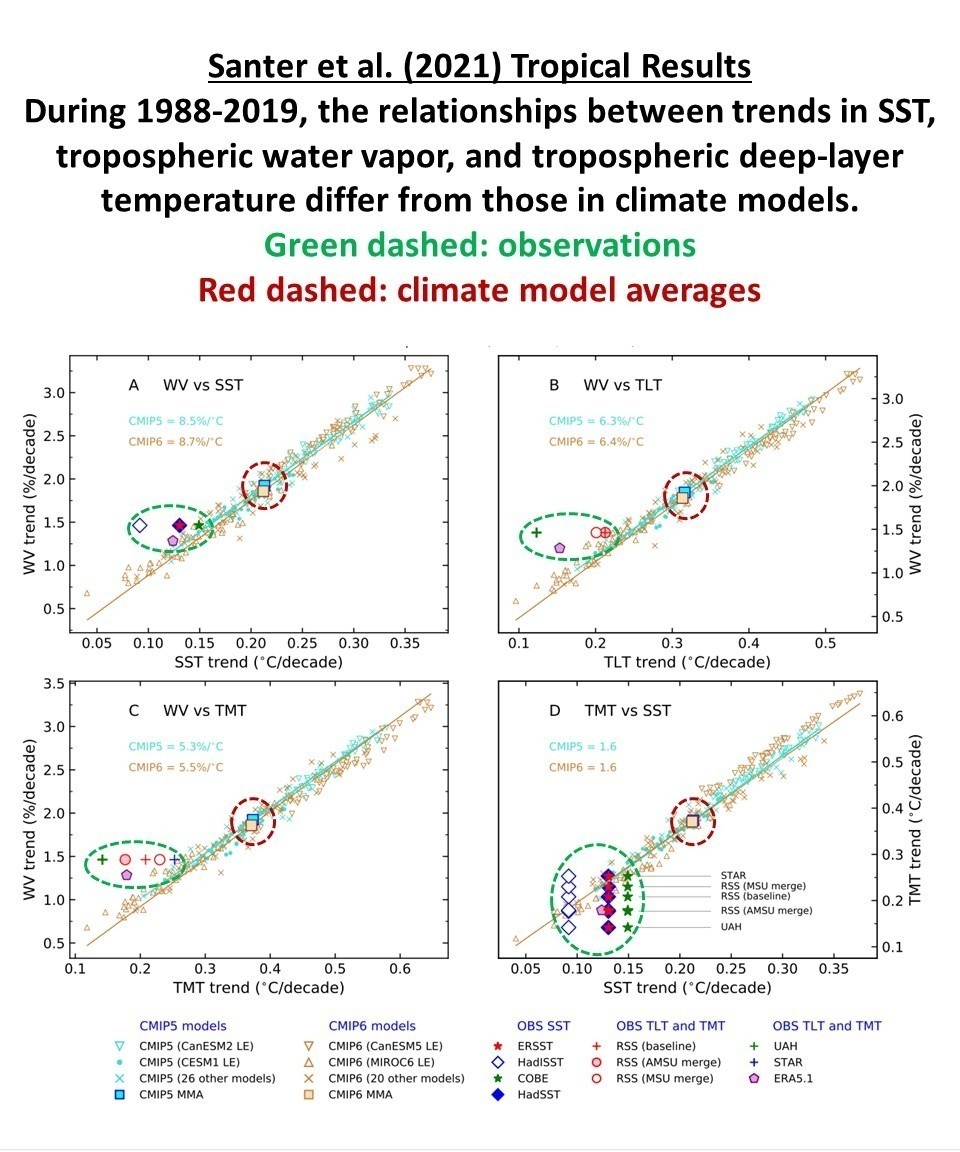
Most of the pertinent conclusions in the new paper come from their Fig. 9, which I have annotated for clarity in Fig. 1, below.

Fig. 1. Adapted from Santer et al. (2021), comparison plots of tropical trends (1988-2019) in total integrated water vapor, sea surface temperature, and tropospheric temperature, in climate models versus observations. Note in (A) and (D) the sea surface temperature trends are well below the average model trends, which curiously was not part of the media-reported results. These plots show that in all four of the properties chosen for analysis (SST, TLT, TMT, and TWV) the observed trends are below the average climate model trends (the latter of which determine global policy responses to anthropogenic GHG emissions). The fact the observations fall off of the model-based regression lines is (as discussed below) due to some combination of errors in the observations and errors in the climate model assumptions.
The Problem with Using Integrated Water Vapor Increases as a Proxy for Tropospheric Warming
A central conclusion of the paper is that total integrated water vapor has been rising more rapidly than SST trends suggest, while tropospheric temperature has been rising less rapidly (assuming the models are correct that SST warming should be significantly amplified in the troposphere). This pushes the observations away from the climate model-based regression lines in Fig. 1a, 1b, and 1b.
The trouble with using TWV moistening as a proxy for tropospheric warming is that while TWV is indeed strongly coupled to SST warming, how well it is coupled to free-tropospheric (above the boundary layer) warming in nature is very uncertain. TWV is dominated by boundary layer water vapor, while it is mid- to upper-tropospheric warming (and thus in the TMT satellite measurements) which is strongly related to how much the humidity increases at these high altitudes (Po-Chedley et al., 2018).
This high-altitude region is not well represented in TWV retrievals. Satellite based retrievals of TWV use the relatively weak water vapor line near 22 GHz, and so are mainly sensitive to the water vapor in the lowest layer of the atmosphere.
Furthermore, these retrievals are dependent upon an assumptions regarding the profile shape of water vapor in the atmosphere. If global warming is accompanied by a preferential moistening of the lower troposphere (due to increased surface evaporation) and a thickening of the moist boundary layer, the exceedingly important free-tropospheric humidity increase might not be as strong as is assumed in these retrievals, which are based upon regional profile differences over different sea surface temperature regimes.
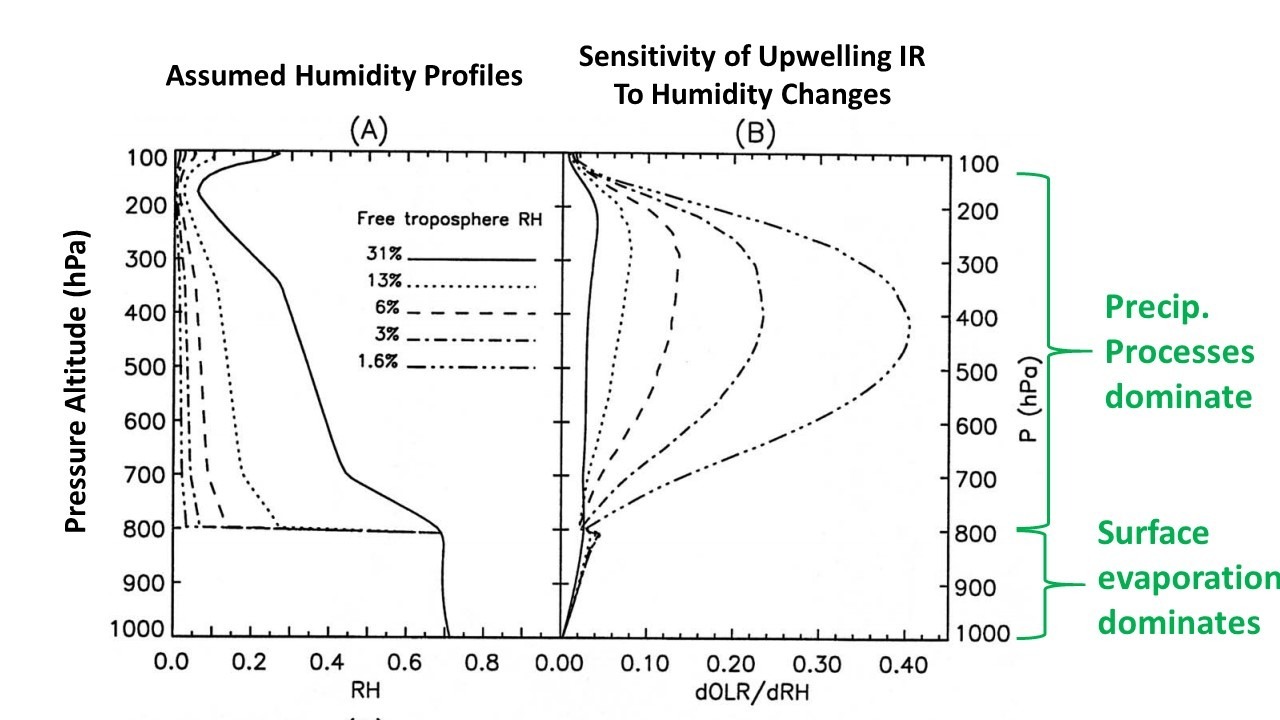
As shown by Spencer & Braswell (1997) and others, the ability of the climate system to cool to outer space is strongly dependent upon humidity changes in the upper troposphere during warming (see Fig. 2). The upper troposphere has very low levels of water vapor in both relative and absolute terms, yet these low amounts of vapor in the upper 75% of the troposphere have a dominating control on cooling to outer space.

Fig. 2. Adapted from Spencer & Braswell, 1997: The rate of humidity increases in the free troposphere (above the boundary layer) with long-term surface warming can dominate water vapor feedback, and thus free-tropospheric warming (e.g. from satellite-based TMT), as well as surface warming. The precipitation processes which govern the humidity in this region (and especially how they change with warming) are very uncertain and only crudely handled in climate models.
As indicated in Fig. 2, water vapor in the lowest levels of the troposphere is largely controlled by surface evaporation. If the surface warms, increasing evaporation moistens the boundary layer, and constant relative humidity is a pretty good rule of thumb there. But in the mid- and upper- troposphere, detrained air from precipitation systems largely determines humidity. The fraction of condensed water vapor that is removed by precipitation determines how much is left over to moisten the environment. The free-tropospheric air sinking in clear air even thousands of km away from any precipitation systems had its humidity determined when that air ascended in those precipitation systems, days to weeks before. As demonstrated by Renno, Emanuel, and Stone (1994) with a model containing an explicit atmospheric hydrologic cycle, precipitation efficiency determines whether the climate is cool or warm, through its control on the main greenhouse gas, water vapor.
Importantly, we do not know how precipitation efficiency changes with warming, therefore we don’t know how strong water vapor feedback is in the real climate system. We know that tropical rain systems are more efficient than higher latitude systems (as many of us know anecdotally from visiting the tropics, where even shallow clouds can produce torrential rainfall). It is entirely reasonable to expect that global warming will be accompanied by an increase in precipitation efficiency, and recent research is starting to support this view (e.g. Lutsko and Cronin, 2018). This would mean that free-tropospheric absolute (specific) humidity might not increase as much as climate models assume, leading to less surface warming (as is observed) and less tropospheric amplification of surface warming (as is observed).
Because climate models do not yet include the precipitation microphysics governing precipitation efficiency changes with warming, the models’ behavior regarding temperature versus humidity in the free troposphere should not be used as “truth” when evaluating observations.
While climate models tend to maintain constant relative humidity throughout the troposphere during warming, thus causing strong positive water vapor feedback (e.g. Soden and Held, 2006) and so resulting in strong surface warming and even stronger tropospheric warming, there are difference between models in this respect. In the CMIP5 models analyzed by Po-Chedley et al. (2018, their Fig. 1a) there is a factor of 3 variation in the lapse rate feedback across models, which is a direct measure of how much tropospheric amplification there is of surface warming (the so-called “hotspot”). That amplification is, in turn, directly related (they get r = -0.85) to how much extra water vapor is detrained into the free troposphere (also in their Fig. 1a).
What Happens To Free Tropospheric Humidity in the Real World?
In the real world, it is not clear that free-tropospheric water vapor maintains constant relative humidity with warming (which would result in strong surface warming, and even stronger tropospheric warming). We do not have good long-term measurements of free-tropospheric water vapor changes on a global basis.
Some researchers have argued that seasonal and regional relationships can be used to deduce water vapor feedback, but this seems unlikely. How the whole system changes with warming over time is not so certain.
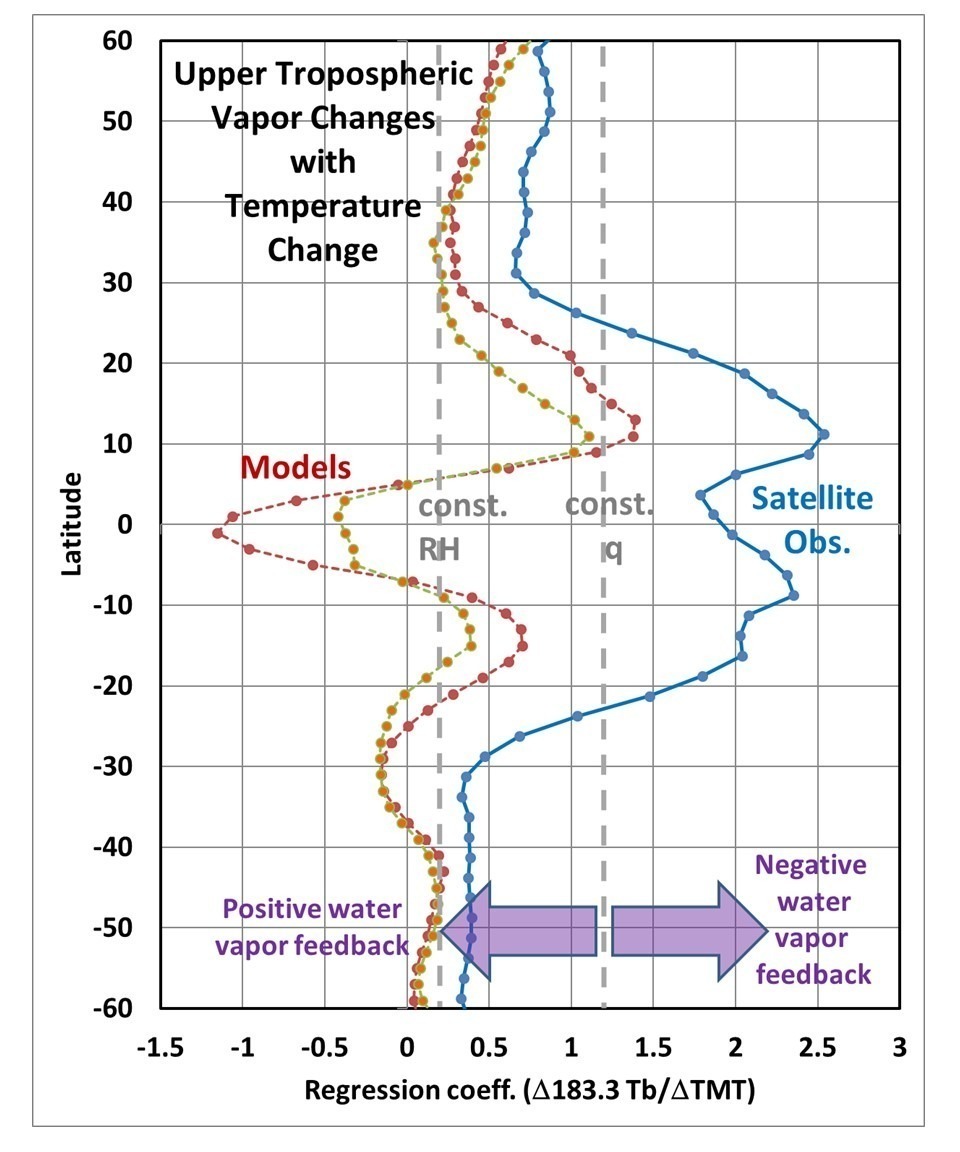
For example, if we use satellite measurements near 183 GHz (e.g. available from the NOAA AMSU-B instruments since late 1998), which are very sensitive to upper tropospheric vapor, we find in the tropics that tropospheric temperature and humidity changes over time appear to be quite different in satellite observations versus the GFDL climate model (Fig. 3).

Fig. 3. Zonal averages of gridpoint regression coefficients between monthly anomalies in 183.3 GHz TB and TMT during 2005-2015 in observations (blue) and in two GFDL climate models (red and orange), indicating precipitation systems in the real world dry out the free troposphere with warming more than occurs in climate models, potentially reducing positive water vapor feedback and thus global warming.
More details regarding the results in Fig. 3. can be found here.
Possible Biases in Satellite-Retrieved Water Vapor Trends
While satellite retrievals of TWV are known to be quite accurate when compared to radiosondes, subtle changes in the vertical profile of water vapor during global warming can potentially cause biases in the TWV trends. The Santer et al. (2021) study mentions the possibility that the total vertically-integrated atmospheric water vapor trends provided by satellites since mid-1987 might be too high, but does not address any reasons why.
This is an issue I have been concerned about for many years because the TWV trend since 1988 (only retrievable over the ocean) has been rising faster than we would expect based upon sea surface temperature (SST) warming trends combined with the assumption of constant relative humidity throughout the depth of the troposphere (see Fig. 1a, 1b, 1c above).
How might such a retrieval bias occur? Retrieved TWV is proportional to warming of a passive microwave Tb near the weak 22.235 GHz water vapor absorption line over the radiometrically-cold (reflective) ocean surface. As such, it depends upon the temperature at which the water vapor is emitting microwave radiation.
TWV retrieval depends upon assumed shapes of the vertical profile of water vapor in the troposphere, that is, what altitudes and thus what temperatures the water vapor is emitting at. These assumed vertical profile shapes are based upon radiosonde (weather balloon) data from different regions and different seasons having different underlying sea surface temperatures. But these regionally- and seasonally-based shape variations might not reflect shape changes during warming. If the vast majority of the moistening with long-term warming occurs in the boundary layer (see Fig. 2 above, below 800 hPa pressure altitude), with maybe slight thickening of the boundary layer, but the upper troposphere experiences little moistening, then the retrieved TWV could be biased high because the extra water vapor is emitting microwave radiation from a lower (and thus warmer) altitude than is assumed by the retrieval. This will lead to a high bias in retrieved water vapor over time as the climate system warms and moistens. As the NASA AMSR-E Science Team leader, I asked the developer of the TWV retrieval algorithm about this possibility several years ago, but never received a response.
The New Santer at al. Study Ignores Radiosonde Evidence Supporting Our UAH Satellite Temperatures
As an aside, it is also worth noting that the new study does not even reference our 2018 results (Christy et al., 2018) showing that the most stable radiosonde datasets support the UAH satellite temperature trends.
Conclusion
The new study by Santer et al. does not provide convincing evidence that the satellite measurements of tropospheric temperature trends are unrealistically low, and the media reporting of their study in this regard was biased. Their conclusion (which they admit is equivocal) depends upon the belief in climate models for how upper tropospheric warming relates to increasing total tropospheric water vapor (TWV) amounts. Since TWV does not provide much sensitivity to upper tropospheric water vapor changes, and those changes largely determine how much tropospheric amplification of surface temperature trends will occur (e.g. the “tropical hotspot”), TWV cannot determine whether tropospheric temperature trends are realistic or not.
Furthermore, there is some evidence that the TWV trends are themselves biased high, which the study authors admit is one possible explanation for the trend relationships they have calculated.
The existing observations as presented in the Santer et al. study are largely consistent with the view that global warming is proceeding at a significantly lower rate that is predicted by the latest climate models, and that much of the disagreement between models and observations can be traced to improper assumptions in those models.
Specifically:
1) SST warming has been considerably less that the models predict, especially in the tropics
2) Tropospheric amplification of the surface warming has been weak or non-existent, suggesting weaker positive water vapor feedback in nature than in models
3) Weak water vapor feedback, in turn, helps explain weak SST warming (see [1]).
4) Recent published research (and preliminary evidence shown in Fig. 3, above) support the view that climate model water vapor feedback is too strong, and so current models should not be used to validate observations in this regard.
5) Satellite-based total water vapor trends cannot be used to infer water vapor feedback because they are probably biased high due to vertical profile assumptions and because they probably do not reflect how free-tropospheric water vapor has changed with warming, which has a large impact on water vapor feedback.
REFERENCES
Christy, J. R., R. W. Spencer, W. D. Braswell, and R. Junod, 2018: Examination of space-based bulk atmospheric temperatures used in climate research.
Intl. J. Rem. Sens., DOI:https://doi.org/10.1080/01431161.2018.1444293
Lutsko, N. J. and T. W. Cronin, 2018: Increase in precipitation efficiency with surface warming in radiative-convective equilibrium. J. of Adv. Model. Earth Sys., DOI:https://doi.org/10.1029/2018MS001482.
Po-Chedley, S., K. C. Armour, C. M. Bitz, M. D. Zelinka, B. D. Santer, and Q. Fu, 2018: Sources of intermodel spread in the lapse rate and water vapor feedbacks. J. Climate, DOI:https://doi.org/10.1175/JCLI-D-17-0674.1.
Renno, N. O., K. A. Emanuel, and P. H. Stone, 1994: Radiative-convective model with an explicit hydrologic cycle: 1. Formulation and sensitivity to model parameters, J. Geophys. Res. – Atmos., DOI:https://doi.org/10.1029/94JD00020.
Santer, B. D., S. Po-Chedley, C. Mears, J. C. Fyfe, N. Gillett, Q. Fu, J. F. Painter, S. Solomon, A. K. Steiner, F. J. Wentz, M. D. Zelinka, and C.-Z. Zou, 2021: Using climate model simulations to constrain observations. J. Climate, DOI:https://doi.org/10.1175/JCLI-D-20-0768.1
Soden, B. J., and I. M. Held, 2006: An assessment of climate feedbacks in coupled ocean–atmosphere models. J. Climate, DOI:https://doi.org/10.1175/JCLI3799.1.
Spencer, R.W., and W.D. Braswell, 1997: How dry is the tropical free troposphere? Implications for global warming theory. Bull. Amer. Meteor. Soc., 78, 1097-1106.
If only the models were as scrutinized as critically as the data.
“…with the presumption that the models provide “truth” in such comparisons…”
Dr. Richard Feynman again.
Truth is subjective and subordinate to faith, often painted with vibrant colors for empathetic appeal. Facts have progressive viablity in a limited frame of reference, and, unfortunately, frequently interpreted with liberal license. Models are hypotheticals waiting to be tested in perpetuity.
I often wonder if journalists have done a decent language degree or if they are so ideological they prefer to deceive themselves rather than follow the plain sense of language.
Michael, it looks like journalists have “Commentator” degrees, like Political Commentator, Science Commentator, Weather Commentator, etc. If I had to do it over maybe I would get a Geology Commentator Degree, then I wouldn’t have to trudge miles through the mountains where it is icky and hot and there are no McDonalds.
Good report, but the modelled results are the key to the CAGW crowd getting their agendas through political boundaries. In the case of Biden, the socialists are pushing and Biden is pulling. Who needs facts when you have feelings?
James, there is zero percent science in CliSciFi Crisis.
Well, they do stick quite closely to the science vocabulary. They just don’t apply it in any way recognized by science.
As much as 10% – that’s generous.
10% science. 20% social contagion. 30% profit. 41% leverage.
Using model simulations to constrain observations? Seriously?
They lost me at that point.😞
If one of my computer models didn’t match observations, I would junk the model and start again. These morons are trying to change the observations to match their models. How can anybody take these people seriously?
“Using model simulations to constrain observations? Seriously?”
The question is, what are “observations” here? So I think it is a poorly worded title. But in fact inferences of temperature, or even water vapor, from a single stream of voltages emerging from a microwave sounder or whatever, involves extensive modelling. And you can use another model to check on that. It isn’t like reading a thermometer.
Nick, Dr. Spenser has thoroughly described his methods in verified scientific papers. You are exhibiting extreme bias in equating his work with Santer’s machinations. Pardon my having ‘toxic masculinity’ (testy-cals), but Santer is a known liar. Prove me wrong.
Nick is right. There is a problem with spaceborne microvoltage sensor datum returns and their proper alignments (and drift adjustments over time) with the physical conditions of pressure, atmospheric opacity in the various spectra, velocity, depth, angular incidence, refraction, on and on. The translations from satellite raw sensor returns to indicated readings are not so much inferred as not tightly connected.
That said, I will go with the data rather than the models that disagree.
The satellite readings are compared against other readings, such as weather balloons and the match up quite well.
They do not “match” they are calibrated to the likes of weather balloons and surface temps.
Of course the instruments are calibrated. But, you ignore the fact that the calibration process prescribes comparison of an unknown quantity’s measurement accuracy against a known standard of defined accuracy. Records are kept of the traceable path and calibration curves of the test results with errors are provided. If you’re suggesting that calibration processes are bunk, or that any Certified Metrologist will certify any item outside its claimed accuracy, then you need to think otherwise.
The National Institute of Science and Technology (NIST, renamed in 1988 from NBS, the National Bureau of Standards ) exists for a reason.
“exists for a reason” To the Left, institutions exist to be used and abused, then trashed. Leftists relate to institutions they way cats relate to mice – play with them till bored, then eat them.
In your opinion, the fact that they match where they overlap proves they don’t match everywhere else?
By that standard, there is no data, anywhere.
Everything is just a model.
Weight? It’s just voltage out of a piezo-electric crystal, or deflection of a spring. It has to be interpreted.
Temperature, voltage from a thermo-couple, resistance of a platinum element, or maybe just the old mark1 eyeball reading a mercury level.
According to Nick, since everything is just a model, why shouldn’t we treat the climate model as if they aren’t capable of error. Just as Nick does.
Who needs data? I am 67. In my 64 years of living memory nothing has noticeably changed weather wise. The low tide and the high tide at my childhood beach in South Australia haven’t changed. Heat waves here are no more unbearable or frequent, we still have cold nights and the occasional snow flurry in the hills (just like when I was a kid). Heck, they even had snow in the Sahara when I worked there 15 years ago. The only things that have changed are my life expectancy has gone up, modern medical practices and medicines have improved my health (despite too many tipples at this time of day), food quality has improved, my overall comfort has improved, I have more leisure time than ever before and the electricity price has skyrocketed. My 92 year old mother still remembers just how hot it was in 1939 for 3 weeks and in Sept (early spring) 1960 at the football grand final, almost 100 degF. I think much younger climate alarmists are just waiting for old people to die and take their memories with them so then they can do whatever they want with their data. What I want know is when is the global warming going to start, I’m sick of waiting. Rant finished.
The fact that the UAH satellite data and the weather balloon data support each other, is studiously ignored by Nick.
Do you dismiss the weather balloon data, too, Nick?
Here we have two different data collection methods, weather balloon and satellite, and they both are telling the same story with regard to temperature, and here you are disparaging the UAH satellite data.
What the correlation between the weather balloon data and the satellite data really means is the bastardized global temperature record does not reflect reality.
“Do you dismiss the weather balloon data, too, Nick?”
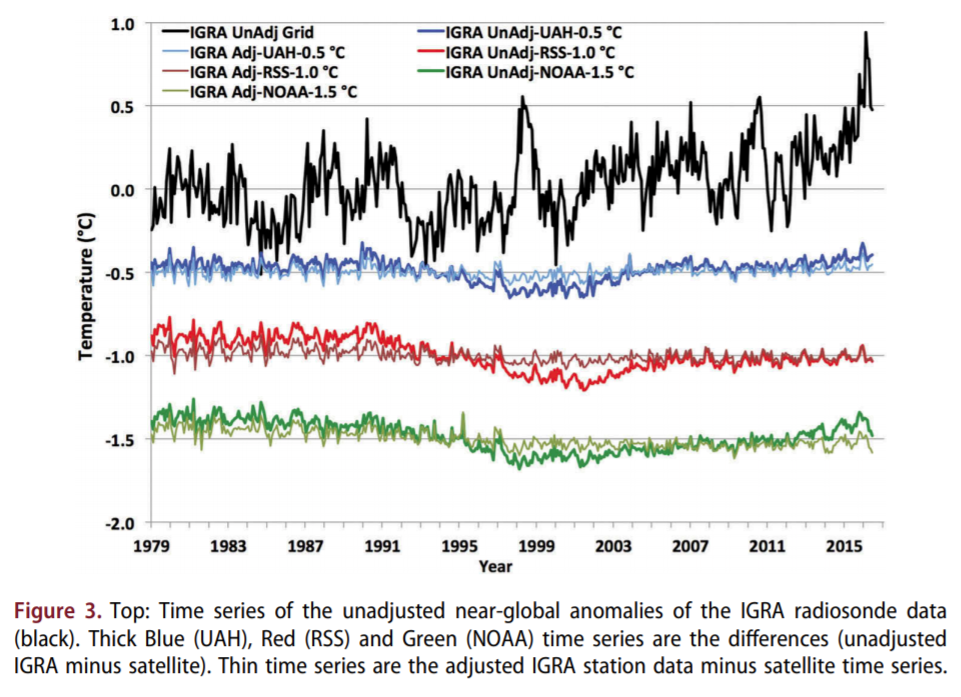
Would you like to present the weather balloon data, then? I guess not. People who make this assertion never do. Their paper that Roy complains was not referenced by Santer is here.
Here is their plot of the discrepancies between IGRA (balloons) and the satellite data sets. With unadjusted IGRA, they are actually quite large. They too, of course, adjust the IGRA data to get a better fit. To get an idea of how large, the RSS and UAH sat data tell a very different story of warming. RSS warms faster than surface, UAH slower. Yet in this plot, RSS and UAH are more similar to each other than they are to IGRA.
There is a definite pattern to the discrepancy. Of these Christy et al say:
“4.1. Satellite warming in the 1990s
We have shown substantial evidence to support the hypothesis that the satellite datasets experienced spurious warming during the period that began with NOAA-12 and ended with NOAA-14 (1990–2001+) that could not be explained by the processes already addressed. The evidence is seen in (a) the full IGRA comparisons in both global and low-latitude regions, (b) the more controlled analysis using the US VIZ and the Australian radiosondes separately (both global and low-latitude) and (c) the comparison with Reanalyses and independently-constructed, homogenized radiosonde datasets.”
and
“4.2. Satellite cooling in 2000’s
The relative cooling of the satellite datasets versus IGRA from 2002 to 2006 is more difficult to explain because once adjustments are applied, including the defined breaks of US VIZ radiosondes, the differences largely disappear (see Tables 1, 4). “
Not such great agreement.
You are aware of the fact that the adj. UAH fits the radiosonde best in this graph and the differences are less than 0.1C?
“adj. UAH fits the radiosonde best”
They actually adjusted the radiosonde data, by a homogenisation procedure they described here (eg quote “we then adjust the radiosonde to match the satellite at that shift point“). But the difference between the UAH fit and the RSS fit to the adjusted data is not much. That is despite UAH and RSS being different. The reason is that they seem to adjust the radiosonde differently for each satellite set.
Nick,
Agreed there are differences, usually are in comparisons. The balloon data, from the texture, seems the odd man out.
In comparisons of this type, it is usually unhelpful to criticise the one that looks worst. It is better to use experience to contribute ideas about improving the match. With no experience with balloons, I am unable to do that.
How do you stand in using your experience constructively to improve the match? What you advise RSS and UAH to do, scientifically, to improve the match? Geoff S
Geoff,
I don’t think turning the balloon data into a global average for comparison is a viable option. It just isn’t good enough. It is sparse, needs heavy homogenising which bashes it directly into comformance. And I think even instrumental accuracy is not wonderful.
I also think AMSU as a way of getting a global temperature is full of problems, as the huge changes in versions and disagreements between UAH and RSS indicate. I think that if they have been trying for thirty years to get it working, I’m not going to be able to usefully advise.
Nick,
Comparisons like these invariably show differences that were unsuspected before the exercise started. My eye-opener was the mismatch in chemical analyses of soils from the Apollo 11 program, early 1970s, where the chosen best labs in the free world did not perform well. Expensive material to play with to lean that lab people exaggerated prowess.
A common finding is that the parties to a comparison enter it with unrealistic estimates of their total error ranges. It is then asked. “Are these errors irreducible, or can we improve?” Almost always, parties choose the improvement optin – it is like the challenge of a sporting record.
In the case of these satellite temperatures, it is hard to calculate total error ranges because of the lack of an independent standard against which to compare, to determine accuracy (precision is of lesser importance in this case).
IMHO, current methods are at about the limit of improvement. One then has to accept this and work with the material that is available. In this case, the differences (say) between UAH and RSS are absolutely quite small. It is hard for labs on terra firma to match between each other at hundredths of a degree, even tenths. Rather than dismissing a party that for private subjective reasons one does not like, one needs to use all of the material in the best way you find to combine it.
The whole climate change exersise shocked me from the start, when senior parties were expressing alarm at global temperature changes alleged to be tenths of a degree in magnitude. Coming from a geology/physics background, I had thought that changes of 5 to 10 degrees might need attention, even if the idea of a global average temperature was valid. So, my present conclusion is a Shakesperian “Much Ado About Nothing” when it comes to these differences in global satellite temperatures. Combine, them, use them, accept scientific suggestions for improvement and evaluate them but for heaven’s sake do not just sit back and whinge about tiny differences that have little physical consequence.
There are bigger fish to fry.
Nick, enjoy the lifting of the lockdown and have a nice Queen’s Birthday weekend. Geoff S
These are not the models you are looking for. Right Nick?
Someone tell me the real problem here. We are looking at anomalies not absolute temperatures. Nick, you always advocate that anomalies always generate a more accurate view of changing temps so what is the problem here? You seem to be saying that the anomalies as determined by satellite data are inaccurate because of what? (15° – 14° = 1°) and (10° – 9° = 1°) So the absolute values appear to be of little use in your calculations of GAT showing growth rates.
Sorry, but you are trying to conflate different things into a criticism that is unjustified.
Nick writes “And you can use another model to check on that.”
There is a fundamental difference between the model of the atmosphere the satellite calculations are made against and a model that projects climate changes.
The instantaneous model of the atmosphere is reasonably accurate and immediately relevant. The model of the atmosphere that projects “climate” contains the errors and biases accumulated over the time of the run.
The Emperor’s new
clothesmodels.Dr. Spencer’s UAH dataset requires extensive modeling to measure the temperature; far more modeling than say traditional thermocouple or RTP measurements which themselves require modeling of electrical and material properties to produce a temperature reading. Either people aren’t as incredulous about the modeling used in all kinds of measurements including temperature as they let on or they are just unaware of it. I’m having a hard time understanding what the problem is in double checking the modeling satellite datasets use.
If only there was an independent source of data which could confirm the UAH temperature trends or the climate models. And there is. The radiosonde datasets support the UAH satellite temperature trends not the climate models.
Here is a comparison of UAH, RSS, and RATPAC in the mid troposphere. For reference CMIP5 shows +0.20C/decade of surface warming.
https://www.ncdc.noaa.gov/sotc/upper-air/201913
Extracting some of those figures for decadal trend, mid-troposphere
UAH 0.09°C/dec
RSS 0.14°C/dec
Ratpac 0.18°C/dec (balloons)
Agreement between UAH and balloons not looking good.
Bdgwx
That report is 10 years old. Do you have comparisons after the most recent versions? Geoff S
To clarify, The references are 10 years old or even older. Geoff S
The data is current at least through 2019.
On one hand, we have the models used to convert satellite measurements to temperature data. Models that have been verified by having multiple satellites using multiple models read the same patch of atmosphere. Models that have been verified by flying physical sensors through the same patch of air.
On the other hand, we have climate models that have failed every attempt at verification ever made.
Now tell me, why should we give equal weight to both models?
I don’t think we should necessarily give models equal weight. My point is only that regardless of what method is used measuring temperature always requires a model of some kind and that it is okay, if not preferred, to be skeptical of any dataset/model.
CMIP5 and CMIP6 shows +0.08C/decade and +0.07C/decade of warming from 1880-2020 respectively. The observed value was +0.07C/decade. I’m not sure I’d call that a failure. I am always looking for models that do better though so if you know of one let me know and I’ll definitely check it out.
Hopefully, you do realize that CliSciFi models are tuned to the past. The fact that they get significant trends (e.g. early 20th Century) wrong is a testament to the hubris of their makers.
Nick said this, and it’s sophistry, OK? Yeah, every measurement is based on a model, but only some models are useful. Some are designed to create future funding, create policy changes, collect fame, some are just plain fashionable takes.
If somebody needs double checking, it is the CMIP modelers who manage to create models that overestimate warming. I was not born yesterday. Such mistakes don’t happen accidentally so often.
It’s not bias as they know what they are doing. It’s propaganda.
That’s an ugly way to say it, but it is not inconsistent with my modelling on how people behave when they get rewarded with power, money and fame.
Dr. Roy
It would be interesting to take this data and compare it against the papers by Plass and Kaplan in 1958-60. Our dear friend Gavin Schmidt has always used Kaplan as his touchstone but Kaplan, using data (possibly classified at the time) from the USAF upper atmospheric research came up with a number 2-3x lower than the sensitivity of Plass.
Sorry, meant that Gavin always used Plass, not Kaplan…..
Terry.clausen@bluetie.com
Does anyone have an official count of how many “peer reviewed” papers Santer has penned that disregard actual satellite and/or radio sonde data in order to maintain the GCM manifestation of the mid-tropospheric “hot spot”?
“disregard actual satellite and/or radio sonde data”
What is “actual satellite data”? What did they measure?
Here is a graph of two satellite data sets, showing the differences between two successive versions. The blue is UAH. The green curves show the differences between GISS versions in some recent years.

Now in those years, the observations were the same. No-one took new ones. But the satellite data has very large changes, depending on version. How can that be?
The reason is that between the satellite measurement of some radiation and a temperature plot comes a model. And both UAH and RSS changed their model between versions.
And that makes the UN IPCC CliSciFi models more accurate, Nick? It works better if you support your team rather than tear down the other team. All models are not created equally.
Please note, also, that your graphs are showing hundredths of a degree differences in various iterations of different datasets. UAH changes seem to reflect the actuality of the 21st Century hiatus better than the RSS warming.
I suppose it depends on the reasons for the change and if they make sense and are backed up by independent observations.
That’s one difference between satellite data and climate models.
When they find a problem with the model that creates the satellite data, they fix the model.
When problems are found with climate models, they fix the data.
“When problems are found with climate models, they fix the data.”
Here is Christy et al, describing how they homogenise the balloon data:
“We will show below both the direct comparison of IGRA vs. the satellite time series without any adjustment to any dataset as well as results using adjusted IGRA data. The non-adjusted result is the most independent of the comparisons to be shown which means that the differences in the time series may be due to radiosonde and/or satellite problems. Unfortunately radiosondes have undergone events which impact the time series, i.e. changes (improvements) in software, instrumentation, and factors such as cord length between the balloon and the instrument box. These changes are generally detectible as a shift in the time series (examples will be shown later). Unlike surface temperature stations that may suffer from slow temperature drifts due to gradual changes in the immediate surroundings for which adjustment is extremely difficult, radiosonde time series usually are composed of homogeneous segments at the endpoints of which are sudden shifts as a change is instituted (e.g. Christy et al. 2006; Christy, Norris, and McNider 2009; Haimberger 2007; Zhang and Seidel 2011). As a result, we are able to ‘detect’ a radiosonde change by examining the time series of differences between the radiosonde and satellite.
When a significant shift in the difference-time-series is detected (by the simple statistical test of the difference of two segments of 24-months in length on either side of the potential shift) we then adjust the radiosonde to match the satellite at that shift point. In the sections below we shall use a t-test value of 3.0 to detect and adjust for a shift (C11). Each satellite will be utilized to generate the shift points according to its own time series, thus ‘IGRA ADJ’ will be specific for each satellite dataset. Satellite time series will not be adjusted in anyway”
Nick,
The problem with GCM’s when considering the reality as by the means of observations,
is not only the clear non semblance with all temps data sets,
but also no any similarity,
at all with
CO2-temperature coupling,
but far from it…
which happens to be the main point of invalidation of such models as climate prediction models.
There is a clear departure of such models from the observed reality within the interity of all data sets concerd.
So much so,
that even the silly averaging of the models still does not make it any better.
Still Nick,
there is no way that one can fabricate a hotspot in the observations.
And according to GCMs,
the experimental models,
that stands as a condition of Nullification of/for the AGW hypothesis.
No matter how much fabrication of the data could be further attempted to make go away the condition of falsification of AGW,
the clearly observed decoupling of CO2 trend from temperature trend;
the failure of AGW to the Nullification, it renders the validity of that hypothesis even worse than 50/50.
Completely meaningless… and invalid.
cheers.
Hi Nick,
The reason RSS and UAH don’t agree is because the former purveyor was “shown the instruments of torture” (a la Galileo) and revised their results to better agree with the Narrative, as you can see in the attached Tony Heller video:
The Ministry Of Climate Truth – Erasing The Satellite Data
Now that that Heller has explained the RSS record, perhaps you will tell us why Santer’s various attempts to conjure up the mid-tropospheric hot spot don’t agree with the UAH and the radio sonde data. Thanks!
As for radiosonde data, see my comment above.
As much as UAH and RSS may disagree, radiosondes disagree with both more.
There is no issue that you will not try to obfuscate is there Nick?
Apologies for confusing you with the facts.
Do you have any to offer?
Nick you know better than most that Mearns of GISS was under pressure to change its temperatures away from the close tracking with UAH, both to stop sceptics hammering this point and also to knock satellite temperatures off it’s high horse as a sterling global measure of temperatures. They then claimed the GISS adjusted thermometric series was superior when people began to wonder why we kept this inferior series. Interestingly, HADCRUT versions maintained close correlations with UAH, sticking GISS out in left field where it remains.
“Mearns of GISS was under pressure to change its temperatures away from the close tracking with UAH”
I presume you mean M of RSS. In fact RSS did not track closely with UAH. Dr Roy wrote a post here titled
“On the Divergence Between the UAH and RSS Global Temperature Records
Over the last ten years or so there has been a growing inconsistency between the UAH and Remote Sensing Systems versions …”
further advising that
“But, until the discrepancy is resolved to everyone’s satisfaction, those of you who REALLY REALLY need the global temperature record to show as little warming as possible might want to consider jumping ship, and switch from the UAH to RSS dataset.”
Naturally, they did – Lord M, for example, tracked the first pause exclusively using RSS V3.3. Then UAH showed trend higher than GISS, and RSS lower. Then, as the graph here illustrates they swapped places.
“sticking GISS out in left field where it remains”
GISS has never been an outlier. It was below UAHV5.6; now it is below RSS V4.0. Here is a plot of the four sets now, anomaly base 1981-2010. As you can see, GISS and Hadcrut are almost identical; RSS warms a little faster. It is UAH which is the outlier.

The UAH trend is +0.136C/decade, GISS is +0.189C/decade, and HadCRUTv4 is +0.172C/decade. Note that HadCRUTv4 is a partial sphere measure and when kriging is applied to it by Cowtan & Way the full sphere trend is +0.188C/decade. But regardless of whether it is taken as-is or with kriging it is still closer to GISS than UAH. For comparison a blend of Nick’s loess and mesh techniques yield +0.177C/decade, ERA5 is +0.190C/decade, NOAA (also partial sphere) is +0.174C/decade.
Seem to agree pretty well to me.
And radiosonde…
Nick says “And both UAH and RSS changed their model between versions.”
What I want to know is whether the models are changing because the structure of the atmosphere is changing or not.
If the structure of the atmosphere is changing then two things become apparent.
Today’s “new” models shouldn’t retrospectively be used to adjust past satellite data.
The GCMs cant be right and can never be right on this point alone.
Related to subject
Where can I find solid emmisivity numbers for h2o; vapor, liquid, and ice to estimate ir emmision above the cloud tops. CO2 also
Relating to evaporation rates, does anyone in community have a verified historical view of total atmospheric pressure thru the ages…
Never seen a proxy for this with any justification….
If we do not know this, we do not know much?
What in the nitrogen cycle keeps the world at a fixed pressure
Bias seems to be everywhere but they do have a bit of self-awareness here.
https://nypost.com/2021/06/08/national-geographic-says-theres-a-fifth-ocean-on-earth/
“But in recent years, scientists have homed in on the unique nature of the Antarctic waters, largely due to unique currents that flow there — known as the Antarctic Circumpolar Current, National Geographic magazine said. ” Both the Mediterranean and the Gulf of Mexico have “unique currents,” the latter from down Antarctic Way.
The 12.20 issue of National Geographic is “Saving the Great Lakes–The irreplaceable fragile ecosystem holds six quadrillion gallons of freshwater that our planet needs to survive.” I would rather they worry about survival of NG. Sprules, W. G. 2007. Ecological change in Great Lakes communities – a matter of perspective. Canadian Journal of Fisheries and Aquatic Science. 65:1-9. Basically ecological systems still operative. If this was in the article I missed it, but they also mention that the zebra mussels (stealing plankton food) make the water clear which is what the anti-nutrient types seem to want. They do have an interesting small section on invasives calling it ” A Hijacked System.”
The planet needs the Great Lakes in order to survive?
What exactly did the planet do prior to the Great Lakes being dug out by the last big glaciation cycle?
Santer is a giant in the realm of circular reasoning.
Santer? Get out your hip waders, folks. The B.S. accumulates wherever he visits. Dr. Spenser gives us yet another example.
In a June 2017 paper published in Nature Geoscience, Ben Santer, Michael Mann, et al acknowledge that their climate models are wrong, although their admission is buried in weasel words and technical jargon:
“In the early twenty-first century, satellite-derived tropospheric warming trends were generally smaller than trends estimated from a large multi-model ensemble,” reads the first line of the abstract. In other words, the actual temperature trends were less than their models.
“Over most of the early twenty-first century, however, MODEL tropospheric warming is substantially larger than OBSERVED,” reads the abstract, adding that “model overestimation of tropospheric warming in the early twenty-first century is partly due to systematic deficiencies in some of the post-2000 external forcings used in the model simulations.” (Capital letters are mine for emphasis.) In other words, their computer models substantially overestimated the global warming which has been observed in the real world.
Abstract: https://www.nature.com/ngeo/journal/vaop/ncurrent/full/ngeo2973.html
Paper: http://www.meteo.psu.edu/holocene/public_html/Mann/articles/articles/SanterEtAlNatureGeosci17.pdf
A review: http://climatechangedispatch.com/the-pause-in-global-warming-is-real-admits-climategate-scientist/
To sum up: they don’t know what is really going on with the percent level GHG water, but they are certain that they have correctly modeled the ppm level GHG CO2, and the model says we are all going to die.🤔
Seems easy enough to test using another method, weather balloons ? Planes ? Space shuttle ? If the plan to reduce co2 is to cost the economy trillions I think it is wise to spend some money to confirm the measurements first. Of course this is practical thinking, yet the government has never been that good at practical thinking.
Dr. Spencer’s model of satellite results are verified by validated radiosondes from weather balloons.
RATPAC shows +0.18C/decade of warming while UAH shows +0.09C/decade at TMT for a difference of 0.09C/decade. So if if a difference of 0.09C/decade qualifies as “verified” then I think you would agree that CMIP5’s near surface warming of +0.20C/decade vs the GISS, BEST, and ERA5 blended composite of +0.19C/decade for a difference of only 0.01C/decade would be “verified” as well. In fact, I think you would agree that CMIP5 is “verified” to a degree much better than that of UAH.
While bias is intrinsic, prejudice is progressive (i.e. monotonic), often with ulterior, insidious motives.
When you have to protect “The Cause” enough to write about it to encourage your cause sharing friends, then you can be sure that ulterior motives exist.
“Why should I provide you my data when all you do is try to find something wrong with it?”
Uh, because that’s the way the scientific method works?
The brief and unremarkable DailyMail article is followed by a longer appendix conflating ‘greenhouse gases’ and particulate air pollution as if ‘carbon neutral by 2050’ had something to do with ‘tackling air pollution’.
Climate catastrophe cult calculations 101
Obviously the observations are in error. How else can the “Modeling” not be right?
From the article: “The New Santer at al. Study Ignores Radiosonde Evidence Supporting Our UAH Satellite Temperatures
As an aside, it is also worth noting that the new study does not even reference our 2018 results (Christy et al., 2018) showing that the most stable radiosonde datasets support the UAH satellite temperature trends.”
Oh, it’s definitly worth noting.
The UAH satellite and the weather balloons correlate with each other on temperature. Two different systems reporting the same thing.
Santer ought to compare the bastardized global temperature to the weather balloons. We know they don’t correlate because the bastardized global temperature record does not match up with the UAH satellite record. Another indication that the bastardized global temperature record is not fit for purpose, and that NASA Climate and NOAA have been lying all these years when they claimed 12 different years in the 21st century as the “hottest year evah!”. But they could not do that if they were using the UAH satellite chart as their guide because the UAH satellite chart shows 1998 as hotter than every subsequent year except 2016. We wouldn’t have had 12 years of scaremongering from the Data Manipulators if they had used the real temperature record, the UAH satellite record.
The UAH satellite chart:
NASA Climate and NOAA lied about all the years between 1998 and 2015. They were deliberately trying to scare people into obeying the will of the alarmists. It’s criminal.
”The UAH satellite and the weather balloons correlate with each other on temperature. Two different systems reporting the same thing.”
Absolutely Tom. As I have shown above. Any claim to the contrary is just trying to pull the wool and not to be taken seriously. In fact to be treated with the contempt it deserves.
Prior to 1700 or so atmospheric water vapor was determined by the vast area of the oceans and their surface temperatures. Since then, planet warming has driven more WV into the atmosphere. The amount of the WV increase due to temperature increase is fairly easily calculated using extant data for saturation vapor pressure vs temperature for liquid water and the assumption that % WV increase is the same as the % increase in saturation vapor pressure. The result turns out to be approximately constant relative humidity as the temperature increases.
Some Global Climate models calculate RH and find it to be approximately constant with increasing temperature; other GCMs simply assume RH is constant with increasing temperature.
Since Jan, 1988 WV has been measured using satellite instrumentation and reported monthly by NASA/RSS as global average Total Precipitable Water (TPW). Their last report was Jan, 2021 at http://data.remss.com/vapor/monthly_1deg/tpw_v07r01_198801_202101.time_series.txt . The trend of their reported data (1.49% per decade) is about 43 % more than is POSSIBLE as calculated from just the temperature increase of the liquid water. My last inquiry to RSS returned this:
“We are still planning to update this dataset.
However, we do not currently have a time estimate of when that will happen.”
I wonder if this being further evidence (in addition to GCM calculated temperatures being twice measured) that the GCMs are faulty and the Green New Deal is a mistake has anything to do with the interruption in TPW data. Optimum allocation of only three factors produces a 96+% match with measured temperatures 1895-2020. CO2 is not one of the factors.
Since before 1700 the amount of land under irrigation has gradually increased with a dramatic acceleration of the rate of increase around 1960. This and other minor sources provide WV in addition to that from the warming oceans. An assessment of the main sources of additional WV determined that about 90% of the extra (above that from ocean warming) WV is from irrigation.
Didn’t re-analysis datasets also support the UAH satellite temperature?
That would add to the interpretation that the planet has just not warmed as much as anticipated.
Here are the warming trends from the various datasets. Note that this isn’t exactly an apples-to-applies comparison since UAH-TLT measures at a different level. And keep in mind that HadCRUTv4 without kriging and NOAA are considered partial sphere measurements since they do not provide complete coverage in the polar regions which biases them low a bit. UAH is clearly the outlier here. I have included ERA5 which is a reanalysis dataset.
From 1979-2020…
CMIP5 = +0.20C/decade
GISS = +0.19C/decade
BEST = +0.19C/decade
ERA5 = +0.19C/decade
HadCRUTv4-krig = +0.19C/decade
HadCRUTv4 = +0.17C/decade
NOAA = +0.17C/decade
RSS-TLT = +0.22C/decade
UAH-TLT = +0.14C/decade
Models and Data don’t agree. Obviously the solution is to modify the data to agree with the models. Models come from the Ministry of Truth and cannot be wrong. Therefore, journalists are just reporting truth.
Curious indeed that warming is not meeting model expectations. I read something interesting today that could put the cat among the pidgeons. Rising CO2, we are admonished to believe, traps IR in the lower atmosphere causing warming. However there is a parallel effect of CO2 in enhancing – for obvious reasons of the photosynthesis reaction – plant 🌱 growth worldwide.
Thus global leaf area has recently increased – not decreased – by an amount in the tens of percent. Specifically because of CO2 enhancement of photosynthesis.
But that’s well known – the interesting thing I learned today is that recent infrared spectroscopy research has found that plants’ leaves are surprisingly good at backscattering and re-emitting incident near infrared light. Indeed – trees and plants look unexpectedly bright in IR camera images (see below).
This points to yet another feedback working against warming by CO2. The increased leaf area caused by CO2 rejects an increasing percentage of ground incident IR back upwards – effectively increasing near IR albedo.
Could this be one of the factors causing CO2 warming to have been less than expected? I always suspected and felt that the great efforts to conceal and down-play global CO2 greening are unhelpful to a full scientific understanding of the total effects of rising CO2.