Guest Post by Willis Eschenbach
Lots of folks are up in arms about some rumored “CLIMATE CRISIS!!!” or “CLIMATE EMERGENCY!!!” These terms refer to all the terrible things that are supposed to happen when we get 2°C warmer, or 1.5°C warmer, than the “pre-industrial” temperature.
Greta Thunberg, for example, keeps screaming about how we only have ten years to save the planet. (Rumor has it that Al Gore plans to sue her for plagiarism, saying “She’s stolen my line! I’ve got priority, I’ve been saying that for fifty years now!!” … but I digress.)
So I thought I’d see how far we are from the 2°C or the 1.5°C cliff that we’re supposedly going to go over with disastrous results. Let me start with a long-term look …

Figure 1. Ljungqvist extra-tropical NH temperature reconstruction.
Now, this shows the Roman Warm Period that ended in about 150AD. Temperatures dropped and bottomed out during the Dark Ages, in about 500AD. They then warmed until the Medieval Warm Period peak in about 1000AD, cooled to the bottom of the Little Ice Age around 1700, and have been warming in fits and starts ever since.
Questions:
- Why did the Roman Warm Period end?
- Why did it end in 150 AD and not in say 400 AD?
- Why did the subsequent cooling stop around 500AD, and not say 350 or 650 AD?
- Why didn’t the warming up to the peak of the Medieval Warm Period just continue?
- Why did the MWP end in 1000 AD and not say 1200 or 800 AD?
- Why did the subsequent cooling stop in 1700 AD, instead of continuing to a new glaciation as the Milankovich cycles would suggest?
- Why has the earth warmed for 300 years since then?
- Why did the recent warming start 100 years or so before the recent rise in CO2 levels?
Protip—the answer to any and all of those questions is obviously not “CO2”.
The bad news is, I don’t know the answer to those questions. But the worse news is, not one climate scientist on the planet knows the answers to those questions.
So let me open by repeating my plea to what might be termed the “climastrologists”, my term for those well-meaning folks that claim that they can tell the climate future by peering into and interpreting the entrails of a climate model …
How about you stop telling us that you can predict the future until such time as you can explain the past?
Seriously, folks, if you can’t explain the past, how can you possibly claim to predict the future? That makes no sense at all. If a man told you his system can predict the winner of tomorrow’s horserace, but he can’t explain the outcome of a single horserace in the past, you’d laugh him out of town … I suggest you apply the same incredulous laughter to those folks mumbling about “scenarios” and “averages of ensembles of ‘state-of-the-art’ climate models”.
Now, I started this to look at how far we are from the dreaded 1.5°C or 2°C of warming. Let me begin with the Central England temperature record, one of the longest we have. Yes, it’s not global, and yes, it’s land-only … but for the people living in that part of the planet, it’s what they experienced. Here’s that record.

Figure 2. The Central England Temperature record (CET), 1659 – 2020. Red/black line is a CEEMD smooth.
As in Figure 1, you can see that the temperature bottomed out at the depth of the Little Ice Age around 1700. Why? Who knows? And since then, it’s gone up over two degrees … again, who knows why? But if someone knows of any “climate emergencies” due to those three centuries of gradual warming, now would be the time to bring them up. I know of none. In fact, this slow warming has generally been beneficial to man and beast alike.
Too small an area, you say? OK, here’s the Berkeley Earth global land-only temperature record. Notes on the graphic show how low the extreme cold temperatures got, not the average temperatures shown by the red line.

Figure 3. Berkeley Earth land only temperature record. Gray area shows the uncertainty. Yellow/black line is a Gaussian smooth.
Unfortunately, we don’t have the data all the way back to 1700 … but as you can see from the red line, there’s been over 2°C warming since 1750. And again, I know of no “climate catastrophes” since that time.
Don’t like land-only? OK, here’s the Berkeley Earth global record … again, it’s even shorter than the land record because of the lack of earlier ocean temperatures.

Figure 4. Berkeley Earth global land and ocean temperature anomaly, 1850 – 2020
Bearing in mind that the globe seems to have warmed by about half of a degree from 1700 to 1850, you can see that we’re already past the dreaded 2°C “post-industrial catastrophic warming” that the climastrologists are using to terrify the unwary … and there have been no ill effects.
My conclusions and further thoughts?
- Nobody can explain the climate of the past, which makes the climastrologists’ predictions of the climate of the future a sick joke.
- To quote the IPCC itself (emphasis mine), “The climate system is a coupled non-linear chaotic system, and therefore the long-term prediction of future climate states is not possible.“ This seems to be very hard for climastrologists to understand, for the reason given immediately below.
- Do not expect the climastrologists to change their views. As Upton Sinclair noted, “It is difficult to get a man to understand something when his salary depends upon his not understanding it.”
- We’re already past the dreaded “2°C warming since pre-industrial times” they keep warning us about.
- There has been no “climate emergency” or any “climate catastrophe” resulting from that 300-year gradual warming.
- In general, the warming has led to longer growing seasons, less bitter winters, and longer periods where northern ports are ice-free, and it has generally been a benefit rather than a danger.
- The warming has mostly been at night, in the winter, in the extra-tropical and sub-polar regions. I don’t think that folks in say Vladivostok are complaining about slightly warmer winter nights, particularly the homeless.
- Excess cold is much more lethal to the poor than is excess warmth.
- There is no sign of the long-foretold but never-arriving “CLIMATE EMERGENCY!!”
- The doomcasts of the climatastrophists have all failed miserably. There’s a list of fifty such cratered predictions here.
- When a group is zero for fifty in their predictions of disaster, pointing and laughing at their latest doomcast is warranted.
- The average of an “ensemble” of a number of inaccurate climate models is as useful as the Roman version, the average of an ensemble of the entrails of a number of goats.
- Climate scientists should stop pretending to be the Oracle of Delphi, get out of the Chicken Little “THE SKY IS FALLING!!” business entirely, and work solely on trying to understand the climate of the past. Only once they can understand the past should they begin to make guesses about the future.
- I say “guesses” because as the IPCC says, long-term prediction of future climate states is simply not possible.
Finally, what can we do about all of this? Here’s the key.
Everything that people warn us about regarding the dreaded “CLIMATE EMERGENCY!!” has been with us forever. They warn about droughts? What, like those haven’t happened before? Floods? Storms? Hurricanes? Been there, done that. Wildfires? Gradual sea level rise? Always been happening.
About the only new thing that CO2 might bring us is the “Plague of Frogs” mentioned in the Bible, and I’m not putting much odds on that happening. Plus which … even that’s happened before.
Me, I’m not seeing any increases in any of the bad things the alarmists are screaming about. I can find nothing that’s going awry, no Thermageddon, no catastrophes, nada.
But if you still think there is catastrophe looming in the misty future, Greta’s famous terrible thing that’s always ten years away, then I strongly suggest that you consder a “No Regrets Option“. This is to do something that will be of value whether CO2 is the master temperature control or not.
For example, if you think that we’ll get more droughts from increasing CO2, give money to organizations that drill wells in Africa. Or advance the cause of drought-resistant crops. Or work to teach farmers how to reduce their water use.
Because any of those will be of value, whether or not CO2 is bringing bad news … and thus you will never regret the work that you’ve put in, however it plays out.
My best to all,
w.
Simple, easy to understand, and of tremendous value to the “Gretas.et.al.”
Thank you Willis!!!
I agree.
Climate is mostly local, sometimes regional, but *never* global. The climate 100 miles north of me is different than here. The climate 100 miles south of me is different than here. The climate 20 miles north of me, on the other side of a river valley is different than here, different temps, different humidity, different rainfall, etc. The climate 300 miles west of me is different than here and so is the climate 300 miles east of me. There isn’t even a regional average climate let alone a global one!
An ice age is pretty global!
Nope, NH only for the last few times. Doesn’t touch the Tropics.
I have been trying to stress this for about 15 years. It is the only accurate way of regarding the correct meaning of climate … ‘the average weather of a particular location over time’. Even then “averaging” discrete information really doesn’t tell us much. It’s like averaging telephone numbers. On average humans have one testicle.
I agree.
If I give you an average value of 25 can you tell me the data that generated that value? Especially the maximum and minimum values?
If you can’t then of what use is the average?
If the temperature is cyclical, be it over a month, a year, a decade, or even longer then an average value based on max and min divided by two is truly meaningless. It’s a midrange value, not an average. The average of a sine wave is *not* the mid-range value, it is more like 0.63 times the maximum value.
Climate scientists today can’t even seem to get this fundamental math correct.
“If I give you an average value of 25 can you tell me the data that generated that value? Especially the maximum and minimum values?”
Of course I can’t extrapolate the data from a single average, but I can infer a lot about the data, not least that it’s average was 25. Either all the data was 25, or there must have been some values less than 25 and some greater. I know that on average any value above 25 is balanced by a value under 25. And if I compare that with an average say of 10 from a different set of data, I can make some inferences about differences about the two data sets,
Of course it would always be better to know more details about the data, but it’s ridiculous to say the average is of no use.
“The average of a sine wave is *not* the mid-range value, it is more like 0.63 times the maximum value.”
You’ve said this before, and it’s still wrong. The average of a sine wave is the average of the max and min values. Your 0.63 is the average of the absolute values, iff the sine wave is centered on zero.
I agree.
If I give you an average value of 25 can you tell me the data that generated that value? Especially the maximum and minimum values?
If you can’t then of what use is the average?
Yeah its the average IQ of a democrat voter, which ranges from 15 to 35.
Averaging local temperatures only gives a local average, not a global average.
The mean annual temperature of the interior is −57 °C, whilst in Barbados, the average is +30 °C
Should we infer from that the global average is -13.5 °C?
No of course we shouldn’t, but we think taking local temperatures, adding them together, and dividing by the number of nearby weather stations (extrapolating where the stations don’t exist), somehow gives us an average global temperature.
“Should we infer from that the global average is -13.5 °C?”
I wouldn’t put too much faith in a global average based on just two observations, especially when you’ve chosen the two points based on them being outliers. In any event, you wouldn’t be looking at an absolute temperature, but an anomaly.
“… but we think taking local temperatures, adding them together, and dividing by the number of nearby weather stations (extrapolating where the stations don’t exist), somehow gives us an average global temperature.”
That’s not how global averages are calculated.
“In any event, you wouldn’t be looking at an absolute temperature, but an anomaly.”
What does an anomaly from a mid-range value tell you? BE SPECIFIC!
If the mid-range value can tell you nothing about the actual climate then how can an anomaly from a mid-range value tell you anything about the climate? BE SPECIFIC!
“That’s not how global averages are calculated.”
It’s pretty darn close! First a daily mid-range value is calculated. Then those daily mid-range values are averaged to get a monthly average mid-range value. Then those monthly average mid-range values are averaged again to get an annual average mid-range value. Then those annual average mid-range values are used to form a baseline from which daily and monthly anomalies are derived. Then all those anomalies are averaged together to get a global average anomaly.
And it all boils down in the end to be derived from meaningless daily mid-range values. That meaningless propagates throughout the entire pyramid. And if you propagate the uncertainty values throughout the formation of the pyramid you would find that the final uncertainty interval is greater than the final global average anomaly. In other words you can’t tell if the final global average anomaly is a true value or not!
“Of course I can’t extrapolate the data from a single average, but I can infer a lot about the data, not least that it’s average was 25.”
What does the average being 25 tell you? BE SPECIFIC. Generalities such as “some values less than 25 and some more than 25” are meaningless.
“And if I compare that with an average say of 10 from a different set of data, I can make some inferences about differences about the two data sets,”
EXACTLY *WHAT* INFERENCES CAN YOU MAKE? Again, BE SPECIFIC! You still won’t be able to tell if the maximum values and minimum values in each data set are equal or unequal. Without knowing that how do you infer anything about the *climate* in each location?
“Of course it would always be better to know more details about the data, but it’s ridiculous to say the average is of no use.”
The *mid-range* value is of no use at all. The proof is that you can’t tell us what use the mid-range values *are*, what they actually tell you. All you offer is generalities that are meaningless.
“You’ve said this before, and it’s still wrong. The average of a sine wave is the average of the max and min values. Your 0.63 is the average of the absolute values, iff the sine wave is centered on zero.”
The mid-range value, what you call the “average of the max and min values”, only tells you where the zero point is. You can always subtract out the mid-point, just as you would if you had an AC signal superimposed on a DC signal. The *average* of the AC signal will remain .63 times the maximum (either the max positive or max negative) of the AC signal. Jimminy! This is basic calculus.
Again, mid-point values tell you nothing, absolutely nothing. Different climates can have exactly the same mid-range value. So how does the mid-range value tell you anything about the climate?
“What does the average being 25 tell you? BE SPECIFIC.”
It specifically tells me the average is 25. It’s a bit difficult to be more specific unless I know specifically what the the 25 is an average of. But I could say that the minimum value cannot be greater than 25, and the maximum value cannot be less than 25.
If I compare it to the set with an average of 10 I can say specifically that the first average is larger than the second. Whether this has any meaning depends on what these averages are specifically of.
“The *mid-range* value is of no use at all.”
So you keep asserting, and I think it shows a lack of ingenuity on your part not to be able to think of a single use for a mid-range value.
“The proof is that you can’t tell us what use the mid-range values *are*…”
They’re mid-range values; I’m not sure how to be more specific. At the least they are a value that lies somewhere between the lowest and highest point. If we are talking about mean daily temperatures they tell me that what (max + min) / 2 is. They tell me that a day with a mean of 25 was hotter than a day with a mean of 0.
“The mid-range value, what you call the “average of the max and min values”, only tells you where the zero point is.”
Yes I would, because in a sine wave that is what the mean is. Sine waves are symmetrical, the points above the mean line are a mirror of the points below the line.
“The *average* of the AC signal will remain .63 times the maximum (either the max positive or max negative) of the AC signal. Jimminy! This is basic calculus. ”
As I said, you are talking about the absolute values of the sine wave, this is of no relevance to daily temperatures. Do you really thin that a day that goes from -10°C to +10°C, following a perfect sine wave, has an average temperature of 6.3°C? What would happen if you measured the temperatures in Fahrenheit? Maximum of 50°F, average 31.5°F. Suddenly average is below 0°C.
“Different climates can have exactly the same mid-range value. So how does the mid-range value tell you anything about the climate?”
Yes, it’s possible for the same average to have different climates, but that doesn’t mean that the average tells you nothing.
If you were choosing somewhere to visit, and all you knew was that the average temperature of one place was 40°C and the other was 10°C, would you honestly say that you could tell nothing about their respective climates?
“It specifically tells me the average is 25. It’s a bit difficult to be more specific unless I know specifically what the the 25 is an average of. But I could say that the minimum value cannot be greater than 25, and the maximum value cannot be less than 25.”
Again, no specificity. And if you have to specifically know the data set from which the average is derived then how does that apply to a so-called “global average temperature”? Which is actually an average anomaly and not a temperature?
“So you keep asserting, and I think it shows a lack of ingenuity on your part not to be able to think of a single use for a mid-range value.”
I have a lack of ingenuity? I keep asking you what the average tells you and to be specific and you keep dodging. *YOU* apparently can’t think of a single use for a mid-range value either! So do you have a lack of ingenuity as well?
“They’re mid-range values; I’m not sure how to be more specific. At the least they are a value that lies somewhere between the lowest and highest point. If we are talking about mean daily temperatures they tell me that what (max + min) / 2 is. They tell me that a day with a mean of 25 was hotter than a day with a mean of 0.”
In other words you can’t think of a use for a mid-range value either! And how do you know that a day with a mean of 25 was hotter than a day with a mean of 0? If “hotter” is based on the maximum temperature then each day could have the same maximum temp. It would just mean that one location has a much higher variability than another but what that variability might actually be is unknown! TRY AGAIN!
“Yes I would, because in a sine wave that is what the mean is. Sine waves are symmetrical, the points above the mean line are a mirror of the points below the line.”
Nope! Climate is the area under the temperature curve not a mid-range value. The mean of a sin wave is always 0 unless there is distortion in the sin wave. Of course the temperature curve is not a true sin wave, the daytime and nighttime curves are typically different. If you assume they are an exact split, i.e. daytime and nighttime are equal then you get an average for daytime using the equation
V_avg = [latex] \int_{0}^{\pi} (Vp_day/pi) sin(x) \,dx [/latex]
V_avg = [latex] (Vp_day/\pi) (-cos(x) ) |_0^\pi [/latex]
V_avg = [latex] (2/\pi) Vp_day [/latex] = .63Vp_day
Of course if you do the same thing for the nighttime you evaluate from pi to 0 and get a -.63Vp_night
If you want to base this against the mid-range value then then you get Vm + Vdiff = Vm + (Vp_day – Vm) = Vp_day. For night you get Vm – Vdiff = Vm – (Vm – Vp_night) = Vp_night.
Again, the average value of the temperature curve is *NOT* the mid-range value, not during the day and not during the night.
This is the philosophy of cooling degree-days, heating degree-days, and growing degree-days. That is why basing climate on these metrics would be *much* better than just jamming a bunch of meaningless mid-range values together in a futile attempt to come up with some kind of global average mid-range temperature anomaly whose uncertainty overwhelms whatever you are attempting to identify.
BTW, wasn’t it you that I once asked to calculate the uncertainty of a degree-day value versus the uncertainty of a mid-range value? You never answered, did you?
“As I said, you are talking about the absolute values of the sine wave, this is of no relevance to daily temperatures. Do you really thin that a day that goes from -10°C to +10°C, following a perfect sine wave, has an average temperature of 6.3°C?”
Yes, It *does*. It’s what the math gives. Can you refute the math?
“What would happen if you measured the temperatures in Fahrenheit? Maximum of 50°F, average 31.5°F. Suddenly average is below 0°C.”
So what exactly is your point? You think the daily temperature can’t start off below freezing and warm up to give an average of 31.5F? This only shows how tied you are to a narrative and not to reality!
“Yes, it’s possible for the same average to have different climates, but that doesn’t mean that the average tells you nothing.”
You have yet to tell me EXACTLY what it means. If you, a true believer, can’t tell me EXACTLY what it means then why do you think it means anything? Besides, you aren’t talking about “average”, you are talking about mid-range values.
“If you were choosing somewhere to visit, and all you knew was that the average temperature of one place was 40°C and the other was 10°C, would you honestly say that you could tell nothing about their respective climates?”
You mean the *mid-range* value, not the average. And no, you wouldn’t even have the slightest idea of what kind of clothes to bring with you. A desert like D*ath Valley can certainly have a mid-range value of 104F and get deathly cold on a clear night. So you better bring clothes for both the heat and the cold. The western US plains can have a mid-range value of 50F while being deathly cold at night and extremely hot during the day. So you better bring clothes for both the heat and the cold.
You can defend the use of mid-range values all you want, it doesn’t matter. The fact is that they are useless as a metric for climate.
“Again, no specificity. And if you have to specifically know the data set from which the average is derived then how does that apply to a so-called “global average temperature”? Which is actually an average anomaly and not a temperature?”
This is getting pretty tedious. I cannot tell you specifically what the number 25 means unless I know what specifically the number is measuring. If it’s measuring cows in a field it means specifically there are 25 cows in the field. If it’s measuring mm of rain in a day then it means specifically there was 25mm of rainfall in the day. If it’s just the number 25, then the only specific meaning it has is the number 25. This is true if it’s just a single measure, or an average.
How this applies to global average temperature, I’ve no idea. We were talking about averages in general, and the claim that id you couldn’t tell what data generated an average of 25, the average was of no use. I disagree with the claim that it would be of no use, but as it’s just a number it’s difficult to give a specific use.
If this 25 specifically represents TMEAN for a specific day in a specific place, then it means the average temperature, as defined by the mid-point between max and min for the day was 25°C. A use for that would be gauging whether it was a hot or cold day. I’d regard that as a hot day. The maximum temperature was at least 25°C. I’m not sure how much more specific or exact you want me to be. This is beginning to sound like a true Scotsman fallacy – first you say an average tells you nothing, then when I give examples of things it tells you, you say it’s not specific enough.
“And how do you know that a day with a mean of 25 was hotter than a day with a mean of 0?”
It depends on your definition of hotter, but I think a reasonable person would assume 25°C was on the whole hotter than 0°C, but again you’ll object to the “on the whole” as being too general. So yes, if you define hotness of a day purely in terms of the highest point of the day, you cannot guarantee that TMEAN of 25°C will be hotter than one of 0°C – but for most circumstances it’s probably going to be a good assumption, especially if you talking about two days at the same location. Yes, it’s possible that both days had the same max, but in that case one must have had a much colder minimum, and that’s the day I’m calling the colder day.
Yes, this is getting *very* tedious. You keep claiming the mid-range temperature can tell you something while never being able to actually state what it is.
You keep using the term “average” for mid-range. Mid-range is *not* the average. I gave you the math and you cannot refute it. You just use the argumentative fallacy of Argument by Dismissal in order to ignore the math.
You first say you need to know the actual temperature profile in order to derive meaning from the mid-range temp and then turn around and say you don’t, that you can derive meaning from the mid-range temp alone.
“ in terms of the highest point of the day, you cannot guarantee that TMEAN of 25°C will be hotter than one of 0°C – but for most circumstances it’s probably going to be a good assumption,”
A summer day in a desert can certainly have the same mid-range temperature as a day on the Kansas plains. Yet the temperature variability is significantly different and it is that variability that determines the temperature profile and therefore the climate in each location. A desert location can have both a higher maximum and a lower minimum than a non-desert location – while both have the same mid-range temperture.
Your assumption is *NOT* a good one. It means you are attaching a subjective value to the temperatures based on the narrative you are pushing – instead of relying on the temperatures themselves.
As I said, temperature variability gets lost when you use a mid-range value and it is that variability that is a key component of the temperature profile. You want to make the erroneous assumption that all temperature variations from different locations are equal so that the mid-range value gives a clue to the climate at those locations. I’m sorry but that data gets lost the minute you calculate a mid-range value.
“You keep claiming the mid-range temperature can tell you something while never being able to actually state what it is.”
I keep telling you that one thing it tells you is the minimum cannot be greater than the mid-range and the maximum cannot be less than it. That’s one very specific thing it tells you, and is sufficient to refute your claim that it tells you nothing.
“You keep using the term “average” for mid-range. Mid-range is *not* the average.”
The mid point is the average (mean) of the maximum and minimum. It’s conventional in meteorology to call this the mean temperature. It’s both a literal mean of the ma and min temperatures, and an approximation for the mean calculated as a definite integral throughout the day.
“A desert location can have both a higher maximum and a lower minimum than a non-desert location – while both have the same mid-range temperture.”
This is just what I’m saying. Two places can have the same mean, but different max and mins. On the other hand if two places have different means they cannot have the same max and min.
As I keep saying, it’s better to have more details, but that does not make having just the mean worthless.
“Your assumption is *NOT* a good one. It means you are attaching a subjective value to the temperatures based on the narrative you are pushing – instead of relying on the temperatures themselves.”
Of course subjective feelings of temperature are going to be different than recorded temperatures. But objectively a day with a mean of 25°C is hotter than a day with a mean of 0°C, unless you are taking the subjective view that only maximums count.
“You want to make the erroneous assumption that all temperature variations from different locations are equal so that the mid-range value gives a clue to the climate at those locations.”
I don’t want to do that at all. If I was going on holiday somewhere I’d like to know if it has a constant temperature or a wild swings of temperature, but if that information wasn’t available I’d prefer to know the mean temperature than nothing.
“I’m sorry but that data gets lost the minute you calculate a mid-range value.”
As I keep saying, data is lost if you only have an average, but that doesn’t mean only having an average is worthless.
“I keep telling you that one thing it tells you is the minimum cannot be greater than the mid-range and the maximum cannot be less than it. That’s one very specific thing it tells you, and is sufficient to refute your claim that it tells you nothing.”
So what? You *still* can’t tell me what the minimum and maximum values are. So the mid-range value is useless in determining anything about the climate!
“he mid point is the average (mean) of the maximum and minimum.”
Not for a sine wave. And the temperature profile is very similar to a sine wave. Why is this truth so opaque to you. I gave you the math. Why can’t you refute it?
“It’s both a literal mean of the ma and min temperatures, and an approximation for the mean calculated as a definite integral throughout the day.”
Huh? Do you understand basic calculus? I gave you the integral for calculating the average of a sine wave. The mean is *not* the average for a sine wave.
The definite integral is:
V_avg = [latex] \int_{0}^{\pi} (Vp/pi) sin(x) \,dx [/latex]
Do you dispute that?
“This is just what I’m saying. Two places can have the same mean, but different max and mins. On the other hand if two places have different means they cannot have the same max and min.”
They can have the same mid-range value but different max and mins. I agree that if they have different mid-range values then they have different max and mins.
So what? You *still* can’t tell what the max and mins are from the mid-range values. So what good are the mid-range values in determining climate?
“As I keep saying, it’s better to have more details, but that does not make having just the mean worthless.”
You can say this all you want but unless you can show how the mean can be useful then the fact is that it is meaningless! Just saying it is useful is *not* the same thing as showing how it can be useful in determining anything associated with the climate.
“Of course subjective feelings of temperature are going to be different than recorded temperatures. But objectively a day with a mean of 25°C is hotter than a day with a mean of 0°C, unless you are taking the subjective view that only maximums count.”
This is based on *YOUR* subjective judgement that a higher mean implies “hotter”. For most people it *is* the maximum temperature that determines how hot a day is. If you have to run a fan, an air conditioner, or just stay in the shade for a period of time during the day then the mid-range value for the day is meaningless when it comes to judging how “hot’ the day has been.
“I don’t want to do that at all. If I was going on holiday somewhere I’d like to know if it has a constant temperature or a wild swings of temperature, but if that information wasn’t available I’d prefer to know the mean temperature than nothing.”
Why would you want to know the mid-range value? It wouldn’t help you make clothing choices. You are just being stubborn now.
“As I keep saying, data is lost if you only have an average, but that doesn’t mean only having an average is worthless.”
And yet you can’t give a simple useful thing you can derive from the mid-range value – especially concerning the climate at a location. You would take the same clothing to the plains of Kansas as you would to D_ Valley if their mid-range value is the same. Just how useful is that?
“Not for a sine wave. And the temperature profile is very similar to a sine wave. Why is this truth so opaque to you. I gave you the math. Why can’t you refute it?”
Because it’s not true, and have refuted it several times.
“So what? You *still* can’t tell me what the minimum and maximum values are. So the mid-range value is useless in determining anything about the climate!”
Anything apart from determining what the average temperature is, which is quite an importnat part of a climate.
Part 2
“Nope! Climate is the area under the temperature curve not a mid-range value.”
You’re the one who bought up sine waves as I assume an analogue to daily temperatures. If the daily temperature change was symmetric, like a sine wave, then the mean temperature would be identical to the mid-range. Daily temperatures are not always (or usually) symmetric, so the mid-range value is only an approximation of the mean.
The mean is the area under the curve, provided you count negative values as negative area.
“The mean of a sin wave is always 0 unless there is distortion in the sin wave.”
A sine wave can be translated along the y-axis. If you don;t consider that to be a true sine wave, then I’m not sure what relevance it is to daily temperatures.
“Again, the average value of the temperature curve is *NOT* the mid-range value, not during the day and not during the night.”
But why are you looking at two separate mid range values for night and day. The mid-range value we are interested in is that between max daytime and min nighttime. If the temperature gradient is a sine wave, this will be the same as the area under the curve. Zero if your case.
“BTW, wasn’t it you that I once asked to calculate the uncertainty of a degree-day value versus the uncertainty of a mid-range value? You never answered, did you?”
May have been. I remember another long argument of about degree-days. As you think uncertainties increase with sample size, I assume you think an average based on minute by minute observations would be less accurate than one based on just two observations, but I can’t recall the specific question.
Me: “Do you really thin that a day that goes from -10°C to +10°C, following a perfect sine wave, has an average temperature of 6.3°C?”
You: “Yes, It *does*. It’s what the math gives. Can you refute the math?”
I suspect you issue is less to do with the math and more to do with your definition of an average. You are only talking about the average temperature over 0°C, or think negative temperatures should be counted as positive.
If you want to refute it, just fire up the math program of your choice, generate 1000 points between 0 and 2pi and average the sine value of them. I bet you it will be much closer to zero than 0.63.
Me: “What would happen if you measured the temperatures in Fahrenheit? Maximum of 50°F, average 31.5°F. Suddenly average is below 0°C.”
You: “So what exactly is your point? You think the daily temperature can’t start off below freezing and warm up to give an average of 31.5F? This only shows how tied you are to a narrative and not to reality!”
My exact point is that I wouldn’t expect an average to change, just because translated the data into a different base, then translated it back again. If the average of a sine wave that goes from -10°C to 10°C is 6.3°C, I’d expect to get the same results if I measured the temperatures using Fahrenheit. That is an average of 43.3°F, not 31.5°F. The reason your method gives different results based on the temperature scale is because it depends on what temperature is zero, and that’s different between Celsius and Fahrenheit.
“You’re the one who bought up sine waves as I assume an analogue to daily temperatures. If the daily temperature change was symmetric, like a sine wave, then the mean temperature would be identical to the mid-range. Daily temperatures are not always (or usually) symmetric, so the mid-range value is only an approximation of the mean.”
So what? You only need to integrate the day or night part of the sine wave, not the whole thing.
“The mean is the area under the curve, provided you count negative values as negative area.”
Again, what does the mean, as you define it, tell you? It doesn’t tell you what the average daytime temp is or what the average nighttime temp is. You need to know both in order to properly evaluate the climate at a location.
“A sine wave can be translated along the y-axis. If you don;t consider that to be a true sine wave, then I’m not sure what relevance it is to daily temperatures.”
Again, SO WHAT? I already gave you the math. You still wind up with a mid-range value no matter where you translate it to on the y-axis. And that mid-range value tells you nothing about the climate.
“But why are you looking at two separate mid range values for night and day. The mid-range value we are interested in is that between max daytime and min nighttime. If the temperature gradient is a sine wave, this will be the same as the area under the curve. Zero if your case.”
Check your math. An average daytime temp can tell you what you need to wear during the day. An average nighttime temp can tell you what to wear at night. A mid-range value will tell you nothing about either.
Why are we interested in a mid-range value that tells you absolutely nothing? That’s nothing more than trying to justify using mid-range values to determine the global climate. It’s just as meaningless for the globe as it is for any specific location.
BTW, if Vmax = 75 and Vmin=65 with a mid-range value of 70, then 0.63Vmax – 0.63Vmin is *NOT* equal to zero. Work the math. You wind up with 0.63(Vmax-Vmin). In other words, a scaled down mid-range value.
“I suspect you issue is less to do with the math and more to do with your definition of an average. You are only talking about the average temperature over 0°C, or think negative temperatures should be counted as positive.”
Nope, my issue is with having a metric that actually means something when trying to judge climate at a location.
“If you want to refute it, just fire up the math program of your choice, generate 1000 points between 0 and 2pi and average the sine value of them. I bet you it will be much closer to zero than 0.63.”
You *really* don’t understand calculus at all do you? What do you suppose “dx” implies in an integral? If Vmax-Vmin/2 gives you a mean value that is not zero then what do you suppose 0.63Vmax – 0.63Vmin will give you/
Why do you suppose it will be closer to zero than anything else?
“My exact point is that I wouldn’t expect an average to change, just because translated the data into a different base, then translated it back again.”
Recheck your math. Nothing changes. 0C = 32F. If the mid-range value is below 0C then it will be below 32F
You are still confusing mid-range with average. They are not the same.
“BTW, if Vmax = 75 and Vmin=65 with a mid-range value of 70, then 0.63Vmax – 0.63Vmin is *NOT* equal to zero. Work the math. You wind up with 0.63(Vmax-Vmin). In other words, a scaled down mid-range value.”
I think you mean 0.63(Vmax+Vmin), otherwise your scaled down mid-range value is 6.3. But if you did mean plus you actually have a scaled up mid-range value.
But in either case your math is wrong.
Your Vmax = 75, Vmin = 65 sine wave would be,
The antiderivative of this is
so your definite integral for the first half of the wave is
which equals
whilst for the second halve of the cycle we end up
And averaging gives 70, which is equal to, guess what, 0.5(Vmax + Vmin), or the mid-range point.
Of course you could have just taken the integral from 0 to 2pi, in which case it’s obvious the cosines will cancel, leaving you with the additive part, which is the mid-range value of the extents of the sine wave.
Hope I haven’t made any mistakes in the calculus, if I have be sure to point them out, but I have confirmed the approximate result using the method I suggested previously.
“Recheck your math. Nothing changes. 0C = 32F. If the mid-range value is below 0C then it will be below 32F”
Recheck the point I was making, the comparison is between using your math with C or with F. Using the same temperture one gives you a negative C value and one gives you a positive C value. That suggests your method is not correct.
“Nope, my issue is with having a metric that actually means something when trying to judge climate at a location.”
Then you need to define that metric. But what you said was that this is the “average” of a sine wave, which it clearly isn’t. If you insist only looking at maximum temperatures and ignoring minimums, fine if you think that’s more useful, but there’s no point in multiplying the maximum by 0.63 and calling it an average.
On the specific issue of sine wave, Tim Gorman seems wrong & Bellman seems right.
More common in EE is RMS, which is .707 of peak. (https://goodcalculators.com/rms-calculator/)
The idea is that power is being delivered regardless of the direction of the current. For example, a light bulb shines from both positive & negative current. In slow motion, one would see the bulb flicker, with no light produced as the current crosses the y-axis.
You are confusing power with voltage. RMS is a measure of the AC heating power into a load, equivalent to DC heating the load.
That has nothing to do with the average of a voltage sin wave – which is equivalent to the temperature profile.
Enthalpy would be equivalent to power transfer to a load, but temperature is a poor proxy for enthalpy. Enthalpy is also a function of pressure and absolute humidity.
HVAC professionals have used the integral of the temperature profile for decades to size heating and cooling requirements for buildings. Farmers and gardeners have use the integral of the temperature profile to determine growing degree-days. Both are highly dependent on the climate at a location. The integral of the temperature is a far better indication of climate than a mid-range temperature which is truly meaningless.
I note you did not refute my math either, just like Bellman. How can you say I am wrong if you can’t refute the math?
Tim, I’ve got an EE degree, so I know the difference between power & voltage.
I’m totally anti-AGW, but you seem not to be aware of how muddled your reasoning is.
On the very limited issue of a sine wave, this is correct: “The average of a sine wave is the average of the max and min values. Your 0.63 is the average of the absolute values, iff the sine wave is centered on zero.”
You’re not making any obvious valid point by comparing temperature profiles to averages of sine waves.
From thermodynamics, we know that AGW is false.
No muddle here. I gave you the math showing the integral of the temperature curve and then evaluated it. You have still not refuted it. The average is *not* a mid-range value or RMS value.
I also showed that referencing the sine wave to the mid-range value doesn’t change anything. You have still not refuted that math either.
You continue to use the argumentative fallacy named Argument by Dismissal in order to ignore the math. You just dismiss it as wrong.
The obvious point is that the mid-range value of the temperature profile is meaningless. It is *not* an average.
Once again, cooling degree-days, heating degree-days, and growing degree-days are based on integration of the temperature profile. All kinds of professionals use these every single day. There is a *reason* why they don’t use mid-range values of the temperature profile for sizing HVAC or determining timing of crop planting. If that isn’t an obvious point in your view then you are simply being willfully blind.
Tim, you’re STILL referencing points beyond my comment. You seem confused about who you are talking to. I’ve not made any fricking comment about temperature profiles. Maybe you have some kind of critical thinking deficit.
You seem stuck on Voltages, but I’m actually referring to the pure math of sinusoids.
“The average value of a sine wave is zero”
https://www.allaboutcircuits.com/textbook/alternating-current/chpt-1/measurements-ac-magnitude/
Stop knocking down straw men & actually read what I wrote.
Viking – “You’re not making any obvious valid point by comparing temperature profiles to averages of sine waves.:
Viking – “I’ve not made any fricking comment about temperature profiles”
Sure looks like you made a comment about temperature profiles.
“You seem stuck on Voltages, but I’m actually referring to the pure math of sinusoids.”
I’m not stuck on voltages. I am stuck on the temperature profile. I’ve a attached a graph of my daily temps for the past week. The daily profile sure looks like a sine wave, distorted perhaps but still a sine wave.
That’s actually to be expected because the path of the sun at a location is a trig function – namely the sine function. At sunrise, the height of the sun is low, e.g. the sine of the angle to the sun is small. As the sun rises the height of the sun increases based on the angle of the sun, again a sine wave function. At overhead the height is at a maximum, just like a sine wave at 90deg.
The temperature profile is a near-sinusoid. It is distorted by things like clouds but as a first approximation, assuming a sinusoid *does* work.
Maybe you should improve *YOUR* critical thinking skills.
Viking: “More common in EE is RMS, which is .707 of peak.”
*YOU* started with the strawmen argument, not me. RMS is *not* an average value for a sine wave. It is the *heating* power compared to a DC value. And it has nothing to do with the temperature profile.
The earth is full of mountains, valleys, canyons, basins and many other geographic features. If one lives in an area of mountains, one only needs to visit the high mountain regions to see how annual climate changes or doesn’t change.
For example, I’ve hiked over 35 weeks in the same high 9000 foot and higher Yosemite backcountry for nearly 50 years. The summer climate in these high elevations doesn’t seem to have significantly changed. While there have been severe decade long droughts in California’s lower elevations, the basic streams of the high country have largely been unfazed… There’s been enough ground water for flowers to show up and critters to drink as expected. Snowfields have been there some years, and not others, and returned in subsequent years… Patches of freezing weather seems to show up in mid to late August nights without much correlation to lowland climate patterns… Kills off the mosquitos… So it’s something easy to notice AND plan on for ideal trip times… Some years, there’s crickets everywhere, some years it’s frogs… Then that repeats… Go figure…
While temperature and climate patterns in cement cities may be going up, the climate and temps in the high country seems to be much more constant…
In my younger days my crew and I use to ride our dirtbikes in the Rocky Mountains. Had to rejet the carbs to get any power above 10K elevation. And you are correct, the variability of the climate at those elevations could be variable from year to year. But always around a pretty constant baseline.
I doubt if that has changed much.
Silly Tim, of course you can average the temperatures and reach an acceptable regional climate for your extended area. Tell you what, I’ll get some climate science students to come over and give you a quick teachin of all of the complex maths they use.
Do I need to add a /sarc?
Nope. I would only feel sorry for those students. And disgust for their teachers.
Their Advisory Committee:
University of British Columbia
Dalhousie University
University of Guelph
Université Laval
McGill University
University of Manitoba
McMaster University
Université de Montréal
University of Ottawa
Queen’s University
Simon Fraser University
University of Toronto
University of Victoria
University of Waterloo
Western University
For information, please email Dr. Nadina Jamison at nadina.jamison@utoronto.ca
A “climate charter” sounds like one of the many time and money wasters AGW true believers have burdened Canadian universities with. Clearly there’s no shortage of brain dead warmunists in my sadly misgoverned country.
But, but… think of all the authority. How dare you?!
Exactly, the one thing Warmunists really know how to do is use logical fallacies.
https://uwaterloo.ca/climate-emergency-declaration/
Which sadly shows that science is no longer a subject pursued at the U of Waterloo.
Willis, unfortunately you would be out of a job, IF, politicians had to take an IQ test.
Tests are racist.
True according to the left loons you have the human right right to create your own correct answer and no fascit pig can insist their answer is right.
Agreement – nice work Willis
Nice summary, Willis.
Thanks for that overview Willis. Currently here in Central England I can report we are having one of our coldest springs on record. If the global warming would give us another degree or even better two that would be good.
We has a mild frost a few nights ago, which is pretty rare for this time in May. We are all wearing winter clothing still, and no sign of any uptick in temps to ease the ongoing cold we are experiencing.
Now I mention all this, safe in the knowledge it is just weather. I wish the doom mongers, in particular the BBC would understand weather happens. Climate happens, humans do stuff and well, it doesn’t seem to make much difference to what the weather and ultimately the climate intends to do.
If CO2 causes warming, then I can say from personal experience, those of us in Central England need more CO2! .
Don’t we all! It’s at a very low level right now, with many idiots talking about removing what little we have!
Kent strawberries are more than 3 weeks later than usual. This is of cause all weather, but a decade or of it will leave imprint on contemporary climate. Models shows unrelenting warming but nature might have something else in mind. UK weather is greatly influenced by what is going on in the nearby Atlantic ocean. Few years back I did spectral analysts of CET but rather than finding AMO’s 60 year periodicity I found nothing at all. However, both winter and summer have strong mid 50s and mid 70s components. Combining two of course gives 60+ periodicity, but most interesting thing is that the extrapolation ‘suggests’ a near future cooling (at 1970s level) rather than warming.
Currently in west Wales were 18hrs in of 60mph wind and relentless rain, barely 10c same tomorrow with the wind easing a bit mid day, it will be snowing again tomorrow highland Scotland. Exactly what John cases and the GSM people have been predicting for 5 years.
Yesterday I spoke to my brother living in Lanelli, in South Wales. He confirmed the miserable weather that they are currently experiencing. Had his gas central heating running to keep warm. But the government and greens over will put a stop to gas heating very shortly . .
Yes 2025 is the cut off as far as new gas boilers installations go , I’m in the same county as your brother Carmarthenshire, ironically rather than burning Welsh coal to keep warm today im burning imported polish coal ,because all the Welsh mines closed 30 years ago ,all coal burning will be banned in Wales this year its already illegal to sell it in England.
“Currently here in Central England I can report we are having one of our coldest springs on record.”
Certainly been a cold and miserable May, and a cold but sunny April, but this isn’t going to be the coldest Spring on record, mainly because March was well above average.
Currently we have March = 7.2°C, April = 6.4°C, and provisional May to 18th = 9.6°C. The May figure will be adjusted downward, but I’d also expect it to increase in the final week or so, but assuming it did finish at 9.6, that would mean an average for 2021 of 7.7°C, almost a degree warmer than 2013.
Lol…more CO2 not less
The average is based on the 1981 2010 the previous average was based on the 1971 2000 average with a significant overlap that is not taken into account, the 1971 2000 average was cooler than the present, if we take a longer view march 2021 has no change in average temperature. the temperature average are skewed to show warming. Your also leaving out important data for March 2021 the month started cooler than average 1981 2010 average with only the last two days of march showing a anomaly of 24c and slightly less the second day ,the vast majority of march 2021 was average with only two days bumping up the average, this is important data you did not refer too, a 30 year temperature set does not show any meaning full trend its too short , the department of energy and climate change ( dukes report ) are responsible and as they admit adjusted data.
“… if we take a longer view march 2021 has no change in average temperature.”
Not sure what you’re on about here. CET averages for March
1971 – 2000: 6.27°C
1981 – 2010: 6.58°C
1991 – 2020: 6.74°C
March 2021: 7.2°C
It was the equal 39th warmest March since 1659. Not record breaking by any means, but certainly above average.
“Your also leaving out important data for March 2021 the month started cooler than average 1981 2010 average with only the last two days of march showing a anomaly of 24c and slightly less the second day ,the vast majority of march 2021 was average with only two days bumping up the average, this is important data you did not refer too…”
I responding to a comment saying this was one of the coldest Springs on record. I missed a lot of context to address this claim because we were only talking about the overall temperature. This whole year has seemed quite strange to me, huge swings in temperature throughout winter, a cold April that was also very sunny and dry, followed by a cold May that’s been very cloudy and wet.
I wouldn’t agree that most of March was average, it started cold, finished very warm, but a lot of the middle was also above average.
Here’s the daily CET mean anomaly for March 2021.
1.1.9 Mean air temperatures (averages)
(1)(2)(3)
, Great Britain
January February March April May June July August September October
1970 4.0 3.2 4.0 6.8 12.7 16.1 15.4 16.1 14.5 10.9
1971 4.7 5.0 5.4 7.8 11.5 12.5 16.9 15.6 14.3 11.6
1972 4.2 4.6 6.5 8.6 10.6 11.9 15.5 15.2 11.9 10.7
1973 4.7 4.7 6.5 7.2 11.3 14.9 15.7 16.5 14.3 9.4
1974 6.1 5.8 5.8 8.0 10.9 13.7 15.1 15.2 12.1 7.9
1975 6.7 4.7 5.0 8.3 9.7 14.5 17.2 18.2 13.4 10.2
1976 5.9 4.8 5.0 8.0 11.8 16.7 18.3 17.3 13.4 10.7
1977 3.0 5.1 7.0 7.3 10.4 12.4 15.9 15.3 13.1 11.7
1978 3.4 3.6 6.8 6.4 11.3 13.6 14.7 14.9 14.0 11.9
1979 0.5 1.4 4.8 7.6 9.7 14.1 16.2 14.9 13.2 11.2
1980 2.4 6.0 4.9 8.7 11.0 13.8 14.5 15.7 14.6 9.0
1981 4.8 3.3 6.6 7.8 10.5 13.3 15.6 16.2 14.6 7.6
1982 2.8 4.8 5.8 8.2 11.1 11.2 16.2 15.4 13.8 9.8
1983 6.2 1.9 6.1 6.3 9.6 13.6 18.4 16.8 13.2 10.0
1984 3.3 3.5 4.5 7.7 9.5 13.9 16.2 17.0 13.2 10.7
1985 1.0 2.5 4.4 8.0 10.4 12.2 15.6 14.2 14.1 10.7
1986 3.2 -0.5 4.9 5.4 10.6 14.1 15.4 13.2 11.0 10.6
1987 1.1 3.7 4.1 9.4 9.7 12.2 15.5 15.2 13.3 9.3
1988 4.9 4.5 5.8 7.8 11.2 14.0 14.4 14.9 13.2 9.4
1989 6.1 5.8 7.0 6.1 12.5 14.0 17.4 16.1 14.1 11.5
1990 6.3 7.0 8.0 7.7 12.1 13.3 16.3 17.6 13.1 12.0
1991 3.7 2.4 7.8 8.0 11.0 12.2 17.1 17.0 14.7 10.3
1992 4.0 5.9 7.4 8.6 13.1 15.5 16.1 15.3 13.2 7.8
1993 6.0 5.4 6.6 9.3 11.2 14.4 15.1 14.4 12.5 8.5
1994 5.2 3.5 7.6 8.1 10.4 14.3 17.6 15.9 12.7 10.2
1995 4.9 6.7 5.6 8.9 11.6 14.0 18.4 18.9 13.8 13.2
1996 4.8 3.1 4.6 8.7 9.3 14.4 16.4 16.7 13.7 11.8
1997 2.9 6.9 8.4 9.1 11.5 14.0 16.9 18.6 14.5 10.5
1998 5.5 7.7 8.0 7.8 12.9 14.1 15.5 15.9 14.8 10.6
1999 5.8 5.6 7.4 9.4 12.8 13.7 17.5 16.3 15.7 11.0
2000 5.5 6.4 7.5 7.9 12.1 14.7 15.2 16.7 15.9 10.5
2001 3.9 4.8 5.5 7.8 12.4 14.0 16.7 16.7 14.1 13.6
2002 6.1 7.2 7.6 9.4 11.9 14.3 15.9 17.0 14.5 10.3
2003 4.9 4.5 7.8 9.9 12.1 15.9 17.5 18.0 14.3 9.0
2004 5.5 5.6 6.6 9.6 12.1 15.3 15.7 17.4 14.8 10.6
2005 6.4 4.5 7.2 8.8 11.2 15.4 16.6 16.1 15.0 13.0
2006 4.5 4.2 5.0 8.5 11.8 15.8 19.3 16.2 16.4 12.8
2007 6.9 6.0 7.1 11.2 11.9 14.9 15.2 15.5 13.9 11.0
2008 6.4 5.4 6.1 7.9 13.0 14.0 16.3 16.2 13.5 9.8
2009 3.3 4.4 6.9 9.7 11.9 14.8 16.2 16.6 14.2 11.5
2010 1.5 2.8 6.1 8.9 10.8 15.3 17.0 15.3 14.0 10.4
2011 3.9 6.3 6.8 11.7 12.3 14.0 15.3 15.4 15.1 12.4
2012 5.5 4.4 8.5 7.3 11.6 13.6 15.4 16.6 13.2 9.5
2013 3.9 3.4 3.0 7.4 10.6 13.9 18.2 16.9 13.9 12.5
If you look at the graph reproduced below may 2013 was a degree or so warmer not cooler as you state ,your figure 9.6 , graph 10.6 , dukes data sets.for uk.
Sorry. The comparison with 2013 was for Spring, not May. But re-reading my comment I can see that it might have looked like that.
For the record CET May 2013 was 10.4°C, expect this May to be below 10°C, possibly around 9.6 – 9.8°C. This will be a very cold May, in the coldest 40 since 1659, 5th or 6th coldest since 1900, coldest since 1996, which was 9.1°C.
Just for the record this is what you said “The May figure will be adjusted downward, but I’d also expect it to increase in the final week or so, but assuming it did finish at 9.6, that would mean an average for 2021 of 7.7°C, almost a degree warmer than 2013.”
Mays actual figures 2013 10.6 I did not just look like that, you did a deliberate comparison and researched the 2013 figure which was wrong.
Yes, as I said and apologized for it was badly worded and punctuated. But I’d have thought that if I said May was going to be 9.6 and that would mean 2021 would average 7.7, the 7.7 is not referring to the May figure. And given I was talking about Spring, and had also stated what the March and April figures had been it could have been deduced that the 7.7°C average was referring to Spring, and not May.
I tried to make it clear that I was talking about CET figures, and for that data set May 2013 is 10.4°C.
Your just trying to confuse the issue now .may 2013 was a whole degree warmer than 2021 the opposite to what you said.
You’re just determined to ignore everything I’ve said. I’m sorry that my original comment wasn’t very clear, we don’t all have your gift for language.
One interesting statistical quirk of this Spring, is that, for the first time on record, the “hottest” day over the whole of the UK during Spring (i.e. March, April, May) has so far been in March.
That was 24.5 degrees on 30th March at Kew Gardens.
With another week of fairly cool weather forecast, his could well happen.
You’re quite right about this Spring being warmer (or less cold !) than the recent Spring of 2013.
At the risk of being accused of some mild cherry-picking, the 2 month period of April and May looks like being the coolest since at least 1941, and will be within the coolest 20 such periods in the 362-year record
Update:
May finished at 10.1°C, meaning the average Spring (March – May) temperature was 7.9°C. This is the coldest since 2013 (which was a degree cooler at 6.87°C). 2021 was the 8th coldest Spring in the last 50 years,
If you ignore March, the April – May average was 8.25°C, making it the coldest April/May since 1941, and the 3rd coldest since the start of the 20th century. Equal 27th coldest over the entire CET data set starting in 1659.
But but but Willis – there’s no money to be made following sensible suggestions…
And there is no power to wield in letting people live in freedom.
“Finally, what can we do about all of this?”
Whenever I show Democrats real data, they just say “you’re not a climate scientist” and say the data is made up – i.e. they refuse to believe anything that does not come from their chosen authority. The problem is they are following a green religion dictated by their masters and only know how to “Believe in Science”. Truth and evidence don’t matter.
The corporate media exaggerate and lie about the climate and everything related to it.
And as you noted “It is difficult to get a man to understand something when his salary depends upon his not understanding it.”
Since the climate scientists’ salary comes from the same govt that is promoting the lies, the believers’ chosen authorities are beholden. Fifteen years ago when I started studying climate science, I noticed the following: older or retired climate scientists didn’t believe that CO2 was this big problem, but younger salary-dependent ones did.
So, what can we do about it?
I’m still searching for the answer to that.
I have difficulties understanding why we accept the premise that there does indeed exist a “climate scientist”.
Anyone who has been exposed to this blog could plainly see that given Butterfly Effect, Unknown Unknowns and the myriads of inputs and effects, that even someone with a documented IQ exceeding 200 and more than fifty years of solid research comprehensively in astronomy, biology, chemistry, geology, meteorology, oceanology, physics, sociology, zoology and many other disciplines would still be bewildered and unable to build a representative model that is the least bit accurate in predicting future conditions.
Furthermore, how can a layman know that a certain person is credible and their opinions on the matter should be taken seriously? By what standard? Charisma?
The point being, those who believe in Intelligent Design should expect that the Designer knows how this all works and has a meta-narrative that transcends our ability to understand or thwart it; or those who accept Chance and Evolution as the underlying “guiding force” have to ask, “How do we know that the current conditions are absolutely and comprehensively perfect and any alteration makes it worse and creates an existential crisis?”
What Right does any person have to say “God was Wrong” or “I have the Power to Alter Ageless and Universal Forces that have previously shaped and formed climate Perfection”?
I think this is why Curry seems to post more about psychology than climate science these days as she recognizes this is no longer a scientific argument, it is about belief or faith, and tribes.
Alan , the answer is very simple, who voted for the ignorant politicians who hold the ONLY job they are capable of.
So am I. It is a Big Brother situation. Deep trouble if you dare to question the validity of his pronouncements. The political agenda rules OK?
Thanks for the graph showing temperatures further back than 1880. They’re increasingly difficult to find on the internet as they’re getting deleted, not supporting the narrative. Years ago I saw one that went thousands of years back, showing our recent 130-yr warming to be a insignificant blip on the temperature record. I can no longer find that.
From Fig. 3:
According to BEST, there is a 34% probability that 2 1/2 centuries ago the land was at least 5 degrees colder than today. Similarly, there is at least a 34% probability that the land was more than 1 degree warmer than today. Now that seems unlikely, considering what we know about historical accounts of the weather! So, that raises an interesting question about why the BEST estimates of 18th C temperature uncertainties are so large. Is there an attempt to discredit the cold temperatures of the past to emphasize the warming of today? If BEST is attempting to be objective, why does the uncertainty range seem unreasonable?
This is the illusion of anomalies—people do not experience them. All we can sense is the temperature at a single point in time, at a single location. And because they are generally small in magnitude, a polarity crossing like this should not be unexpected.
Looking at the graph, my comment would not be about large uncertainties in the past, but rather the small uncertainties in more recent times. When an average is calculated, the uncertainty of the average increases for each individual data point that is included in the average, it does not decrease. Also, reported uncertainties for temperatures are typically not very rigorous, which is a way of saying they are usually unrealistically low.
“When an average is calculated, the uncertainty of the average increases for each individual data point that is included in the average, it does not decrease. “
BRAVO! Now if the climate scientists would just understand this!
At least I haven’t seen the “subtracting the baseline decreases error” fallacy for quite a while now, maybe there is hope.
“34% probability … at least 5 degrees colder”
“34% probability … 1 degree warmer”
leaving a 32% probability it was the same, I suppose?
So, it was either warmer, colder, or the same, with equal odds of each?
Question on Fig 4. It is not the “global land and ocean temperature, 1850 – 2020″, it is the anomaly for that period but I do not see a base period for the anomaly. Or am I not reading it correctly.
Figure 4 says “Temperature Anomaly” on the y-axis. Couldn’t tell you the exact period offhand, likely 1961 – 1990. Not sure why it’s important.
w.
Saw that but the caption says otherwise.
Thanks, Tom, fixed.
w.
Apparently, according to some news outlets, all you need to do to see the horrendous effects of man-made CO2 emissions on the climate, is look around.
Just ask the NYT.
Strange! I have been “around” the earth for some 84 years, and I am unable to see any horrendous effects!
I’m with you, Peter W.
On the whole (I’m a decade+ younger), I’ve had rather pleasant weather in the Spring and the Fall and some real clinkers; way cold or way too wet and cold.. I’ve had many rough and many easy Winters. I’ve had some hotter’n blue blazes Summers as well as some very nice ones.
What I have not seen is any weather or climate change that makes me want to sell all I have, give it to the poor, and go sit on a hillside awaiting the Second Coming.
When I was working, I got up and made my way to work as best I could under the circumstances.
Now that I’m retired, I shovel snow off the drive when the spirit moves me and mow the lawn when the odds of me collapsing from heat stroke are at the low point.
I gotta back Willis…… What climate emergency? I don’t know anyone in Nebraska who has recently started swimming to work through shark infested waters.,
We need T-shirts.
.
.
.
.
Ooooo serendipity!
Willis Eschenbach ==> W.E. == >What Emergency?!? =-=-> W.E.
Way better’n a WWJD t-shirt. I’m all for a W.E. t-shirt.
Which is why I had to mow in the snow yesterday here in the Mountain NW
If you want ‘horrendous effects’ – get a load of (the video in) this:
https://www.walesonline.co.uk/news/wales-news/bbc-weather-presenter-owain-wyn-20631693
I found that video just yesterday (19th) on the actual BBC News front page.
Strangely, it’s….
judge for yourself.. here
<the human animal cannot lie>
People in bathers – Yikes!
“Difficult to pinpoint any one weather event on climate change”.
– He’s funny; politicians and MSM have no difficulty doing this every day.
– Also, it’s always interesting to hear ‘experts’ tell us they can’t tell us what the upcoming summer will be like (“it’s too far away”), but they’re in no doubt about upcoming tipping points, climate catastrophes and the like, all years away. I did see in that article that Accuweather are prepared to predict that summer will be warmer than spring though.
Yeah bit like predicting a race horse will run faster than a cart horse in the summer derby.
Gone.
Let’s all be clear here.
There is no science behind the 1.5 ºC threshold claims for the Climate Alarmists.
When 3 ºC threshold hysteria became an unrealistic near-term target (not within 20-30 years or sooner), the IPCC and the Climate Scammers dropped it to a 2 ºC hysteria threshold When even those 2 ºC projections still came in as too far off for the politcal masters, the IPCC lowered it further to 1.5 ºC.
So just like Fauci and all the claimed experts on COVID (Texas Neanderthal Thinking anyone?), they are all just making it up as they go along in the attempt to keep the public alarmed.
Fess up, Joel. How many masks are you wearing based on the Fauci ‘ Waffle Of The day?’
(😜and just in case😜,and for good measure 🤣🤣🤣)
Fauci… WAThe average of an “ensemble” of a number of inaccurate climate models is as useful as the Roman version, the average of an ensemble of the entrails of a number of goats.FI, albeit a dangerous one. People have died from his selfish, money-grubbing,
lunacy.
Willis, you laid it out well but you left out the important part:
It is not that warming isn’t bad .. it is that warming is good! An unalloyed good for the vast bulk of the entire biosphere.
Yes, there may be tiny slivers of the biosphere composed of plants or animals living right on the edge of viability due to specialized adaptations to their local micro climates who might lose out with any kind of climate change, warm or cold, wet or dry. But the vast vast vast majority of plants and animals do much better on a warm earth than a cool earth .. it’s physics, and biology.
Celebrate our warming earth, because some day – perhaps even now already – we are going t enter an abrupt cooling that will create yet another glaciation phase, and vast quantities of our current biosphere is going to get wiped out. Kinda hard to live as a human, a bird, a plant, or even as a bacterium when your home is lying under a 2 km thick ice sheet! And even if you weren’t forced to relocate close to the equator, the biological productivity of the entire planet will be so vastly conscripted that only a tiny sliver of today’s animals and plants will survive.
Winter is coming. Enjoy summer you can!
Duane May 20, 2021 11:35 am
Huh? Not true that I left it out. Actually, here’s what I said:
… and …
My best to you,
w.
“… and there have been no ill effects.”
Isn’t that what the guy said as he plummetted by the 32nd storey?
Yes, there have.
Heatwaves intensification in Australia: A consistent trajectory across past, present and future (Trancoso et al · 2020) https://www.sciencedirect.com/science/article/pii/S0048969720340432
From the conclusion:
“…Heatwaves have become more intense from 1950 to 2016, with a consistent increase in peak temperature, number of events, frequency and duration throughout Australia. Heatwave characteristics undergone major increases in the 2000’s (recent past) in comparison to previous decades. Heatwaves are projected to continue to intensify throughout the current century with greater increases after the 2040s. They are projected to reach unprecedented levels by the end of the century…”
If you live in a warm region and many do – that is an ill effect. I know, the “warmer is better” mantra is popular around here, especially amongst those who experience cold winters, but there have been no ill effects only if you choose to ignore them and that seems to be your choice.
I went to see whether the study made sense … OOPS! Sorry, the data that they use is not available.
It’s part of the Australian Water Availability Project, regarding which I find this:
OOPS! The errors in that part of the dataset are the size of the daily data … DOUBLE OOPS.
Also, weather data in Australia is fairly scarce … it’s a very big country. But somehow, magically, they’ve been able to provide gridded data on a 0.05° x 0,05° gridcell size, viz:
Be aware that “innovations” in climate science generally means “new and untested methods”.
Not only that, but they did all of that starting in the year 1900 …
But like I said, the data is not publicly available, so you’ll have to file it with the journal of Irreproducible Reports.
You’ve got to adjust the sensitivity of your skepticometer, Loydo.
w.
Innovations to Snowy Mountains rainfall gauges?

What you talk’n ’bout Willis?
Fig. 3. Trends in heatwaves indices for the period 1950–2016 (67 years). Trend slopes are expressed on a decadal basis. Stippling denote statistically significant trends (p ≤ 0.05). See Fig. S2 for details over Queensland.
…or pick a city or compare the ratio of record warm vs record cold. However you slice it in an x° warmer environment (0.18C/dec according to the UAH Global Temperature Report), an increase in heatwave frequency, duration and maximum does actually “make sense” and for somewhere that already experiences severe heatwaves that is an ill effect.
Once again, they cherry pick the portion of the data that supports what they want us to belive.
It would behoove you to look at Australia’s regional climates. Most of the areas showing significant trends all appear to be classified as either desert or semi-arid desert. See the attached image. Deserts and semi-arid deserts have significant heating and cooling variability across centuries and millenia. A short term trend from 1950-2016 is hardly representative of anything. It’s only useful to stoke fear in those who are ignorant of reality.
Loydo May 21, 2021 1:32 am
First, I know that’s the tagline from some TV show. But me, I was living on a remote South Pacific atoll when it was on, so a) I’ve never seen it, and as a result, b) I have no idea what it means.
What I’m talking about is that the paper you reference, the one that is not science because it can’t be reproduced for lack of data, uses unpublished data from the Australian Water Availability Project. This is the project that actually believes they can obtain 5 km x 5 km gridded data for all of Australia from a very sparse set of data. Not only that, through some occult magic they can do so back to 1900.
The ACORN dataset, the “high-quality” Aussie temperature dataset of the 111 longest-term , has no data before 1910. None.
Now, you’ve proven that there are folks foolish enough to think that somehow scientists can convert that into temperatures for the year 1900 for every 25 square km in Oz … me, I’m not among them.
As to the rainfall, it’s an analysis of the rainfall data from the same AWAP dataset, and they found the uncertainty as large as the data …
Finally, you say:
Depends on how you define a “heatwave” … and there is no agreed-upon standard definition. From the paper:
Bear in mind they’ve done this calculation using IMAGINARY temperatures on 5 km x 5 km grids …
Sorry, Loydo. You’re free to believe that’s science. Me … not so much.
w.
“Depends on how you define a “heatwave”…”
Indeed, indeed. I suppose that’s how you can conclude: “there have been no ill effects.”
Here are some more “IMAGINARY” calculations.
http://www.bom.gov.au/state-of-the-climate/images/2020/figures/SoTC2020_Temp_Heatevents.png
Now go read how they define a “heat event” then graph how many recording sites there are over time … oh wait you can’t graph …. hmm go count.
Lets give you a hint … how many towns in Australia didn’t exist in 1910 with weather measuring capabilities.
It’s also an amazing statistic that damages from weather events goes up on a graph … well it’s amazing if you ignore the increased population and number and cost of structures and developments exposed 🙂
Loydo, a couple things. First, it was YOUR link that said it depends on how you define a heatwave. As YOUR link put it:
And they gave their own definition.
Second, the earth has been warming for ~ 300 years. Just where do you expect to find the warmest days—at the beginning or the end of the record?
What you have NOT shown is that any of this constitutes a “climate emergency” or a “crisis” or a threat.
However, I know that nothing I can say will slow down your Chicken Little impersonation, running around saying “THE SKY IS FALLING!! THE SKY IS FALLING!!”
If you want to get your knickers in a twist about that, be my guest … me, I’ll pass.
w.
What you have NOT shown is that any of this constitutes a “climate emergency” or a “crisis” or a threat.
No, I was just refuting your faulty generalization: “there have been no ill effects”.
Man, you’re obtuse! Yes, generally speaking there have been no ill effects.
Mmm, and if you willingly ignore them all there are “none”.
What ill effects can you identify? BE SPECIFIC.
Explain to me why this is not an ill effect.
http://www.bom.gov.au/state-of-the-climate/images/2020/figures/SoTC2020_Temp_Heatevents.png
The boggest oops is that they ignore data before 1950, even the BOM hides the data befoe 1900.
The funnier part is how they define “heat event”
Do you have any evidence that heat waves are more intense than they used to be, or do you just believe that because that’s what the models tell you to believe?
I just would like someone like Loydo to tell us what the proper temperature of the earth is. Would they prefer the conditions of the LIA?
Use of fossil fuels has benefits far beyond any negatives of a warming planet.
There aren’t any negatives to a few tenths of a degree of warming.
Duane, I am with you all the way on being very wary of a coming cooling. In actual fact, that is why I moved from New Hampshire to Florida back in 2018, after studying this climate change business since 2006. Last fall there was a cold snap which claimed to have set records, then came the Texas fiasco, and now multiple reports of colder than usual temperatures in northern Europe. While it may be only another “little” ice age, a study of temperature records from ice cores in Iceland and Antarctica tells me that we could well be in for another “big” ice age!
Its coming.
Only question is when.
Unknowable, like ECS.
I’ll hazard a guess. It won’t get hotter than it is now. (a few ups and downs of no consequence) It will get cooler over the next decade or so and it will continue to get cooler for decades. The ”co2 signal” will be even more of a fart in the wind.
I had this discussion the other day = ice age, along with decreasing magnetosphere, shifting poles, were as I agreed with his decreasing magnetosphere, shifting poles, an ice age is a bit to strong for me, I believe we are cooling ,we are more than likely heading into a dalton style cooling event ,which will be extreme enough,particularly with the Western powers doing there very best to take away a reliable grid.
The thing about glaciation cycles is that when they arrive, they arrive ver suddenly, in just a couple of decades… while interglacials such as the one earth has experienced the last 16 thousand years and counting arrive very slowly and gradually.
We aren’t going to get a ten millennium warning on the ice sheets so we won’t have time to adapt to the cold. Billions of humans and billions of tons of flora and fauna will suddenly be wiped out in just a few years. By the time we humans figure out that we are entering a glaciation cycle, most of us humans will already be dead.
Duane:
You say that “interglacials arrive very slowly and gradually”
This not true. According to ice core data, they arrive very abruptly, in less than a century.
I’m reading the Bill Gates climate book- he uses he word “disaster” several times on every page. Otherwise, I like reading the book- learned a few things- he has done a lot of research on agriculture, production of steel and cement, housing, etc. but apparently not much research on THE science- he presumes the “disaster” is our fate.
His book was a genuflection to the Bolsheviks and their climate scam to keep them from coming after him for his very large CO2 footprint – his mansions and estates around the world, his yachts, his fleet of jets.
Feeding the crocodile, hoping to be ate last.
He’s a fool
He wants to BE one of the crocodiles; standing around, crying over the great loss of humanity due to policies enacted by HIS foundation!
He has no concept that the REAL crocs look at him and see a fat wildebeest carrying large bags of gold and silver!
“Let me help you down the banks; this is definitely the best spot to cross the river! I’ll even swim along beside you to get you to the other side!”
“Why are you crying again?”
“Don’t worry, I just got something in my eye!”
And his kiddie fiddling with epstein.
Funny, so did Nostradamus. Great gig, if you can get it.
It seems funny to me that while our British and French originating cultures have their own acknowledged varieties of rich eccentrics, and treat them appropriately, in the U.S. we almost worship them.
I have just posted analysis of temperature changes in SE Asia on my blog. There has been no warming in the last 100 years.
https://climatescienceinvestigations.blogspot.com/2021/05/69-south-east-asia-temperature-trends.html
I have already looked at most of the Southern Hemisphere and the USA and got similar results.
When lots of people run around arm waving and claiming the sky is falling, thats evidence of mass hysteria. Hysteria is a mental illness as described by Dr. Freud over a century ago.
These people all need medication and background checks before being allowed in public. They are dangerous because you cannot predict what they will do, as they are irrational.
“The whole aim of practical politics is to keep the populace alarmed (and hence clamorous to be led to safety) by an endless series of hobgoblins, most of them imaginary.” – H.L. Mencken
“Plague of Frogs” mentioned in the Bible,”
When working in mining exploration on Burin Peninsula, in Newfoundland in the early 1970s, a story in the St. John’s papers reported a hailstorm during which frozen eider ducks (the source of the famous eider down for sleeping bags and anoraks) rained down damaging roofs and bouncing down the streets. I haven’t been able to find a link. It seems a flock of ducks got swept upwards where they flash froze in the big storm. What a climate change story that would make today!

Only thing I know about eiders is a report on one that got oiled and hungry, wrong prey, fatal.
Burnett, F. E. and D. E. Snyder. 1954. Blue crab as starvation food of oiled American Eiders. Auk. 71:315-316. Maybe not the smartest of ducks.
However, E. A. McIlhenny of Avery Island Louisiana had a waterspout put fish in his boat in the Mississippi River Delta, reported by Gudger, E. W. 1946. Rains of fishes-myth or fact.
Science. 103 (2684):693-694. There was a big celebrity flap calling reports a myth from hearsay evidence, [Evans, B. 1946. Concerning rains of fishes. Science. 103:713.] but there are several other verified examples, this one inland, also in Louisiana– Bajkov, A. D. 1949. Do fish fall from the sky? Science.109:402. There was one reported a few years ago on Corpus Christi TV. Fish don’t fly that high.
Never saw fish all, but once a road slick from frogs, probably not from sky. Peculiar reports don’t get published nowadays, probably not statistical enough.
Happens all the time frogs fish insects birds etc.
https://duckduckgo.com/?q=raining+fish++frogs+birds&iar=images&iax=images&ia=images
A beautiful bird!
A point of note: the Central England Temperature (CET) record is not that accurate. It may claim to go back to 1659, but Daniel Fahrenheit only invented the thermometer in 1714 and the Fahrenheit scale in 1724. Plus the CET was only constructed in 1953.
Countries like Sweden, Germany and The Netherlands seem to have adopted thermometer technology far earlier than Britain did. Their temperature records for single sites are much longer than any in the UK and go back to 1750 (or 1700 for Berlin). In fact the earliest British record is from Edinburgh and dates from 1764. All data before this in the CET is probably proxy data from multiple sites and record types.
As I keep telling people who try to draw a trend line from the lat 17th century, Manley himself spells out that the first 60 years are not considered reliable.
A few points though. Thermometers did exist before 1714, but they were very unreliable. Moreover, there are only sporadic records, taking at different locations, indoors, at different times of day. The early monthly estimates are also based on non instrument records, such as frost, wind and snow records.
Also, although the first CET was produced in the 1950s, it was only in the 70s that it was extended back to 1659.
I met David Parker at the Met Office who complied the daily record, he always thought the Manley record was pretty good because it drew on such a wide range of observations. Readings were taken outside as well as inside.
They should not be treated as accurate to fractions of a degree though. As Hubert Lamb wrote about reconstructions ‘We can understand the tendency but not the precision”
Much better than tree rings though
tonyb
I’m certainly not criticizing Manley, I think his work is an amazing achievement.
The data gradually gets more reliable as you come forward in time. There is no sharp distinction reliable/unreliable as you wish to believe.
Beyond that, the lack of total planetary coverage makes what data does exist absolutely useless for calculating a global average until the advent of satellite measurements.
The data doesn’t get very much more reliable. When the federal standard is +/- 0.6C for its weather stations that’s not much more reliable than the manual reading from a mercury thermometer calibrated in degrees.
“There is no sharp distinction reliable/unreliable as you wish to believe.”
It probably does improve over time, though many here would insist the more recent years are less reliable. But the point about the first 60 years comes from Manley himself, from the 1973 version of the data.
I’m not sure what planetary coverage has to to do with the Central England Temperature set.
climate detective
Britain has been recording temperatures since the earliest days and set up a worldwide record..
The Royal Society standardised a thermometer back in 1663-one of the first things they did on receiving their Royal Charter
The Royal Society’s Standard Thermometer, 1663-1709 on JSTOR
Samuel Pepys records receiving one of these thermometers in his diary.
The compilation by Manley of a vast range of records, some instrumental and some from Diaries, observations etc was a huge feat and tied up with the records from Holland. It is pretty accurate but then again most records taken by observers were little more than pretty good due to the variety of thermometers, their calibration, sometimes casual observing and recording and the wide range of error possible when observing.
This is a fault that continued until the modern digital weather stations but they sample typically every minute whereas observations from humans were typically twice a day and would often miss out on the coldest or warmest periods. The max/min thermometer partially resolved this but practices still varied.
tonyb
Even modern digital weather stations still only have a +/- 0.5C uncertainty. This includes the Argos floats. Having a resolution of .001C in the measuring device doesn’t help much when the entire station itself contributes to the uncertainty.
More points of note –
1593, Galileo Thermometer / thermoscope. It was a container filled with bulbs of varying mass, each with a temperature marking. The buoyancy of water changes with temperature. Some of the bulbs sink while others float, and the lowest bulb indicated what temperature it was. (I have one, it’s accurate to ±0.5°C )
1612, Santorio Santorio became the first inventor to put a numerical scale on his thermoscope.
1654, the first enclosed liquid (alcohol)-in-a-glass thermometer, invented by the Grand Duke of Tuscany, Ferdinand II.
Daniel Gabriel Fahrenheit; German physicist produced his alcohol thermometer in 1709 and the mercury thermometer in 1714.
1724, he introduced the standard Fahrenheit temperature scale.
While Willis gives a clear explanation and challenge to people who think and reason carefully, we are facing a much greater problem than any climate changes. I have just listened to a video of an Australian lawyer speaking about children that have been filled with fear because they believe they and their families are going to die because of climate change. They are going off their minds and seeking medical help. I blame their parents, teachers and the media for this child abuse. However, with education so dumbed down and politicized, these children do not have a solid grounding in reasoning and logic. Trust your feelings and not your mind. This is a recipe for tragedy. No wonder there are so many more child suicides today than sixty years ago.
Greta is the Poster child of this child psychological abuse by the climate scam manipulators. But they are Bolshviks and they don’t really care about the harm they are inflicting, same with the COVID school closures. They really don’t care. It serves a larger purpose. Power.
The prophecy of [catastrophic] [anthropogenic] climate cooling, warming, change is one of several handmade tales to stoke phobias, diversity, inequity, and exclusion and manufacture actionable sociopolitical leverage in the pursuit of capital and control.
I have been publicly stating here in canada that parents of children who have offed themselves need to go looking for the people who caused their children and other weak minded family members to step off the planet.
Green party leaders, NDP leaders, Liberal leaders, radical NGO leaders.
What we need is a bunch of angry parents hunting these people through the streets with pitchforks and piano wire.
There needs to be consequences for actions, so far there are none.
At least Shellenberger admitted that the effect on his daughter was one of the things that caused him to smarten up.
There needs to be real consequences
Do-gooders doing more harm than good.
“subsequent cooling stop in 700 AD”
From context, perhaps should be 1700?
I’ll try to be a little less gumpian today.
Good read.
Cheers,
Thanks, dk_. My motto is “Perfect is good enough”. And the beauty of writing for WUWT is that my mistakes rarely go unnoticed for more than a couple hours.
w.
Many people take their minor errors quite personally. I try not to offer minor nits to those who might feel that way.
Whereas I live with my own errors, forever.
You write admirably well. I fiddle. Thanks again for a good read.
A little history. The 2C ‘tipping point’ originated with Schellnhuber at PIK. He later admitted publicly that he just made it up as an alarmist talking point. At the time, it meant climate emergency because AR4 had best estimate ECS officially about 3. 2<3!!!.
But starting in 2013, a series of observational energy budget method papers showed ECS was about 1.7. (IMO the best is the second Lewis and Curry paper responding to minor critiques of their first. Both are available over at Climate Etc.) As a result, AR5 gave no best estimate of ECS because of the observation/model discrepancy.
Oh NO!!! 1.7<2 means the climate emergency was cancelled. So the climastrologists just changed his 2C guess to a ‘new and improved’ 1.5C ‘tipping point’ consensus guess. Since 1.5<1.7 they restored the climate emergency that so alarms Greta, since her Mom says she can see evil CO2.
Extraordinarily gifted, that child. Or maybe not, since CO2 is invisible. The backlit smokestack spewing stuff on my Blowing Smoke ebook cover illustration is just water vapor, which scatters light near dawn and dusk and so becomes visible when normally it isn’t, simple physics explained in the first paragraphs of the book’s introduction.
My favorite misleading picture is of an oilsands plant in northern AB where they inverted the picture such that the nice white steam coming out of massive stacks shows up as black instead
“Mom says she can see evil CO2′
As luck would have it, claims of seeing the invisible is no longer justification for tortuous execution. Interpret “luck” in my sentence any way that you wish.
Salem Witch trials reference. Erudite, dk. Very good.
Ack. Also Sweden, Merry ol’ England, and much of what is now Germany, Italy, and Spain. The pilgrims were just dumb enough to write it down.
“e-Rud-I-te” perhaps? You have now my 1-liner cover endorsement. Unfortunately, with e-books… 😉
Rud,
In support of your comments, the latest word on S or ECS from mainstream science appears to be Sherwood et al (2020),with a nod to Zelinka et al (2020) “Causes of Higher Climate Sensitivity in CMIP6 Models”.
It claims that a Bayesian approach produces a probability density function (PDF) for S “given all the evidence,including tests of robustness to difficult-to-quantify uncertainties and different priors”.
….“The 66% range is 2.6K-3.9K under the robustness tests; corresponding 5-95% ranges are 2.3-4.7K bounded by 2.0-5.7K (although such high confidence ranges should be regarded more cautiously).”
So there it is,the official view.
The just retired Chief Scientist of Australia Dr.Alan Finkel quotes the figure of 2.6K- 3.9K as authorative and what the most reliable computer models disclose.
However, this doesn’t look too robust.
Leaving aside the 130+ low sensitivity papers listed at NoTricksZone.com including the Lewis and Curry papers, we have Hawkins et al (2019) confirming that a ‘best estimate’was not given in AR5 because of a “ lack of agreement on values across assessed lines of evidence” and “Confidence in model estimates is limited by our ability to represent some key relevant climate processes(perhaps clouds,water vapour and aerosols).”
Then along comes another mainstream paper,G.P.Ayers(2020)-“Climate Sensitivity”- CSIRO Publishing.
He cites the final best estimates from “the seven best estimates” of ECS and TCR as “2.36+/- 0.13K and 1.58 +/- 0.09K respectively.”
Looks like Judith Curry’s “Uncertainty Monster” prevails!
Ja. Ja. I told you. Did I not? Every 1000 years or so it gets a bit warmer. It is nature.
https://breadonthewater.co.za/2021/03/04/the-1000-year-eddy-cycle/
Just live with it. Be happy it is not getting cooler.
Cooler would be catastrophic for the environment. Imagine everyone living north of 40° staring at glaciers on the move. Brazilian rain forest would be a distant memory. If any act of mine is postponing the next glaciation–good!
Clair
I will drink to that.
Cheers!/
I just mentioned on another blog that more CO2 in the air is good, since we have all been build from carbon.
Another great post Willis, thanks. It’s incomprehensible that there is a singular focus on reducing Co2 as if by controlling co2, we can control climate. It’s insane, but the insanity is only increasing (rapidly?) on multiple levels.
Especially to be observed in uneducated politicians, who seek power above all else.
“Why did the recent warming start 100 years or so before the recent rise in CO2 levels?”
In 2014 Judith Curry complained that models fail to simulate the observed warming between 1910 and 1940, stating that they, IPCC, does not have a convincing explanation for: a) warming from 1910-1940, b) cooling from 1940-1975 etc.
 , at www. john-daly, 8 Oct, 2003
This is discussed in a post (April 01, 2021): If the IPCC can’t answer it, we’ll do it. At: https://1ocean-1climate.com/if-the-ipcc-cant-answer-it-well-do-it/
which also shows your figure concerning “Vardo Temp. Discontinuity” (around 1920)
Not only did the measured temperatures rise between 1910 and 1940, the trend of the rise is identical to the trend of the rise from 1970 to 2000. Since climastrologists know that CO2 was responsible for the later, it must also have been responsible for the prior, all things physical being the same. Yet none of them makes this claim, instead, they claim the data is wrong because it cannot fit their current models.
But they still don’t know why the Romans built their port cities 4 miles inland from where the ocean is today or why the Vikings abandoned Greenland settlements after 400 years or named it Greenland to begin with. If it is indeed CO2 that controls the earths temperature, they have lots of explaining to do, which instead they ignore.
“Not only did the measured temperatures rise between 1910 and 1940, the trend of the rise is identical to the trend of the rise from 1970 to 2000.”
Yes, and the bogus Hockey Stick charts used in this article don’t show the Early Twentieth Century Warming. They don’t show that it was just as warm in the Early Twentieth Century as it is today.
If they showed the Early Twentieth Century Warming then they couldn’t claim that CO2 is a danger to humans, so they erased it from official history.
The real temperature profile of the Earth can be found in the regional surface temperature charts, not in the bogus Hockey Stick charts. Using bogus Hockey Stick charts is not conducive to finding the truth.
Re the trend of warming between 1910 and 1940 Hubert Lamb notes
“In Spitsbergen the open season for shipping at the coalport lengthened from three months in the years before 1920 to over seven months of the year by the late 1930s. The average total area of Arctic sea ice seems to have declined by between 10 and 20 per cent over that time”
H H Lamb, Climate, History and the Modern World, 2nd Edition, p260
Reply toDoonman
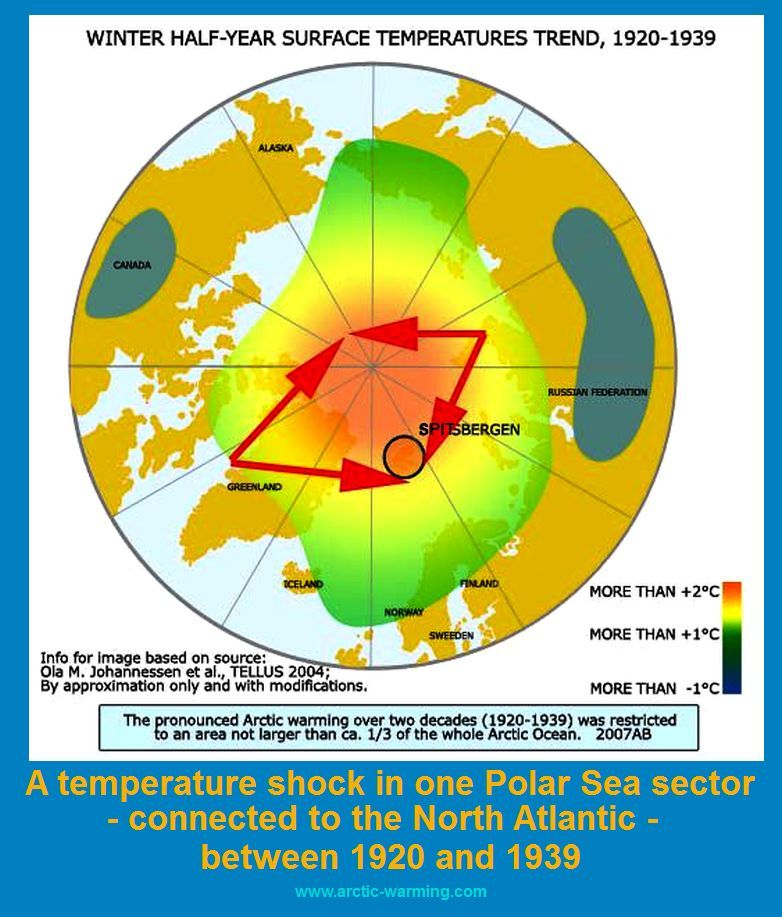
http://www.arctic-heats-up.com/img/c2-p3.jpg
A 1.5 C rise in the GMST anomaly over 140 years out of a global min/max range of 150 C is a statistical aberration and not a meaningful number let alone a trend.
Here here! Great entertaining article. Certainly in the UK, the irrational and fictional response to climate change and Covid shows some evil spirit is draped across us, as it was over Germany 90 years ago.
Willis,
On “ten years to save the planet” and Greta and Extinction Rebellion,Dr. Myles Allen, Lead Author of the UN IPCC wrote an opinion piece in The Conversation on April 19, 2019 later republished in the Guardian entitled “ Why Protestors should be wary of ‘12 years to climate breakdown’rhetoric”.
Dr.Allen realised how counterproductive for the ‘settled science’the hysteria of “we are all going to die” by 2030 was.
Unfortunately for him,the bird had flown, the train had left the station etc.and it was way too late to rein in the doomsday cult nonsense so beloved by much of the media and Greta’s followers.