Earth is on a budget – an energy budget. Our planet is constantly trying to balance the flow of energy in and out of Earth’s system. But human activities are throwing that off balance, causing our planet to warm in response.
Radiative energy enters Earth’s system from the sunlight that shines on our planet. Some of this energy reflects off of Earth’s surface or atmosphere back into space. The rest gets absorbed, heats the planet, and is then emitted as thermal radiative energy the same way that black asphalt gets hot and radiates heat on a sunny day. Eventually this energy also heads toward space, but some of it gets re-absorbed by clouds and greenhouse gases in the atmosphere. The absorbed energy may also be emitted back toward Earth, where it will warm the surface even more.
Adding more components that absorb radiation – like greenhouse gases – or removing those that reflect it – like aerosols – throws off Earth’s energy balance, and causes more energy to be absorbed by Earth instead of escaping into space. This is called a radiative forcing, and it’s the dominant way human activities are affecting the climate.
A simplified animation of Earth’s planetary energy balance: A planet’s energy budget is balanced between incoming (yellow) and outgoing radiation (red). On Earth, natural and human-caused processes affect the amount of energy received as well as emitted back to space. This study filters out variations in Earth’s energy budget due to feedback processes, revealing the energy changes caused by aerosols and greenhouse gas emissions.Credits: NASA’s Goddard Space Flight Center Conceptual Image LabDownload the panels in this GIF from NASA Goddard’s Scientific Visualization Studio
Climate modelling predicts that human activities are causing the release of greenhouse gases and aerosols that are affecting Earth’s energy budget. Now, a NASA study has confirmed these predictions with direct observations for the first time: radiative forcings are increasing due to human actions, affecting the planet’s energy balance and ultimately causing climate change. The paper was published online March 25, 2021, in the journal Geophysical Research Letters.
“This is the first calculation of the total radiative forcing of Earth using global observations, accounting for the effects of aerosols and greenhouse gases,” said Ryan Kramer, first author on the paper and a researcher at NASA’s Goddard Space Flight Center in Greenbelt, Maryland, and the University of Maryland, Baltimore County. “It’s direct evidence that human activities are causing changes to Earth’s energy budget.”
NASA’s Clouds and the Earth’s Radiant Energy System (CERES) project studies the flow of radiation at the top of Earth’s atmosphere. A series of CERES instruments have continuously flown on satellites since 1997. Each measures how much energy enters Earth’s system and how much leaves, giving the overall net change in radiation. That data, in combination with other data sources such as ocean heat measurements, shows that there’s an energy imbalance on our planet.
“But it doesn’t tell us what factors are causing changes in the energy balance,” said Kramer.

Other satellites and instruments – like CERES – monitor incoming energy from the Sun and energy that is emitted back into space.Credits: NASA’s Scientific Visualization StudioDownload this image from NASA Goddard’s Scientific Visualization Studio
This study used a new technique to parse out how much of the total energy change is caused by humans. The researchers calculated how much of the imbalance was caused by fluctuations in factors that are often naturally occurring, such as water vapor, clouds, temperature and surface albedo (essentially the brightness or reflectivity of Earth’s surface). For example, the Atmospheric Infrared Sounder (AIRS) instrument on NASA’s Aqua satellite measures water vapor in Earth’s atmosphere. Water vapor absorbs energy in the form of heat, so changes in water vapor will affect how much energy ultimately leaves Earth’s system. The researchers calculated the energy change caused by each of these natural factors, then subtracted the values from the total. The portion leftover is the radiative forcing.
The team found that human activities have caused the radiative forcing on Earth to increase by about 0.5 Watts per square meter from 2003 to 2018. The increase is mostly from greenhouse gases emissions from things like power generation, transport and industrial manufacturing. Reduced reflective aerosols are also contributing to the imbalance.
The new technique is computationally faster than previous model-based methods, allowing researchers to monitor radiative forcing in almost real time. The method could be used to track how human emissions are affecting the climate, monitor how well various mitigation efforts are working, and evaluate models to predict future changes to the climate.
“Creating a direct record of radiative forcing calculated from observations will allow us to evaluate how well climate models can simulate these forcings,” said Gavin Schmidt, director of NASA’s Goddard Institute of Space Studies (GISS) in New York City. “This will allow us to make more confident projections about how the climate will change in the future.”
Header image caption: A NASA supercomputer model shows how greenhouse gases like carbon dioxide (CO2) – a key driver of global warming – fluctuate in Earth’s atmosphere throughout the year. Higher concentrations are shown in red. Credits: NASA’s Scientific Visualization Studio / NASA’s Global Modeling and Assimilation Office. Download this image from NASA Goddard’s Scientific Visualization Studio.
By Sofie Bates
NASA’s Earth Science News Team
Last Updated: Mar 25, 2021Editor: Sofie Bates
“The amount left over is radiative forcing.” Or it is the accumulated errors in their “calculations”, or some other either unknown or misunderstood natural factor, or computer program bias, or something else. These satellites appear to be gathering useful data, the issue is how it is used.
Or a DELIBERATE STATISTICAL CONTRIVANCE !
NOAA claims to be able to measure the earths global temperatures to 0.01C. When NOAA says a year is the hottest they mean by 0.01C often. Talk about STATISTICAL CONTRIVANCE!
The uncertainty in their annual values is far beyond the hundredths digit, most likely in the tens digit, e.g. +/- 15C. They have no idea of what the annual differences actually are!
They have mathematicians and computer programmers who believe a repeating decimal is infinitely precise doing all this. No idea of what physical uncertainty is.
“Mommy mommy why Spring?”
“Because of all the fuel people burn in winter: It warms the earth because CO2”
The fact that human activity AFFECTS the energy balance is obvious. But what is never proven is to what extent. And, if that effect is good or bad. Most of the “arguments” (as such) are unsubstantiated predictions for the future, based on—really—nothing.
George Box, “All models are inaccurate, some are useful”. This one is clearly not useful, either. Drawing colored arrows usually ends in grade school.
More solar panels are needed, right?
Yes. Create some purdy pictures purporting to “show climate change”. Boom, “direct observations”. Where, you ask? Right there in front of you – those purdy pictures.
Riiiiight.
What a joke…
Models aren’t empirical evidence.
All the empirical evidence overwhelming show CO2 has a minimal ECS of around 1C, and slightly warmer temperatures and higher CO2 levels are better for all life: higher crop yields, milder winters, plants become more drought resistant, increased global greening, longer growing seasons, less frost loss, earlier planting seasons, fewer exposure deaths, more rainfall, etc.
Once the PDO & AMO reenter their respective 30-year cool cycles, CAGW is dead.
This is the first calculation of the total radiative forcing of Earth using global observations, accounting for the effects of aerosols and greenhouse gases.
This is redolent of the claims Berkeley Lab concerning Feldman et al (2015), First Direct Observation of Carbon Dioxide’s Increasing Greenhouse Effect at the Earth’s Surface..
I keep asking but never get an answer: Exactly what on earth absorbs 15u “back” radiation from the CO2? I can’t find anything, including quartz and feldspar which are the two most common materials on earth. Is it only water that can absorb this radiation? If so then how does it affect the land temperature?
Good question. Modtran (screenshot attached here) assumes absorption and emission are continuous across the spectrum as modelled. Obviously results would vary for a specific surface. In this wikipedia page there is a graph for different surfaces, e.g. flat black paint, white paint, mirror. All of these absorb and emit strongly at 15u. https://en.wikipedia.org/wiki/Thermal_radiation
“The absorbed energy may also be emitted back toward Earth, where it will warm the surface even more.”
This is one of the big fallacies of the climate scam. The IR radiated to the surface is so weak it can only penetrate a few microns. It is then reradiated towards space almost instantaneously.
The way to handle this science properly is to treat the surface skin as part of the atmospheric energy system. Then, average out all absorption-emission events within that system. What you see with this transformation is the average emission travels towards space and hence all the energy within this system is continually lost.
The only way to add energy to the system (aka warming) is to find energy that isn’t already captured within it. There is some energy available in what is called the radiation window around 15 microns. However, adding CO2 only allows a small portion of that energy to be captured with a trivial impact on the overall system.
The only way you can actually measure CO2 “back-radiation”..
… is to FORCE a net downward radiation by using a super-cooled sensor..
(eg Feldman et al)
You actually have to CREATE the conditions for it to be measured.
Indeed. I note that here:
http://phzoe.com/2019/11/11/why-up-is-not-down/
It seems to me that any source of “warming” or “cooling” would result in observed energy “imbalance”. You can measure the same thing with a thermometer. I do not see how these observations can be used to attribute this to any specific cause. Still on square one.
Our planet is constantly trying to balance the flow of energy. Our planet isn’t ‘trying’ anything,
it’s flow of energy is in balance. No need to read another emotionally based opinion.
And the OVER-RIDING / CONTROLLING flow of energy is by pressure/density controlled bulk atmospheric transfer.
“This study filters out variations in Earth’s energy budget due to feedback processes”. Great, by ignoring nature, they can easily assume that all warming is caused by humans. Science is dead!
I am reminded of a very, very poor magic act.
“The researchers calculated the energy change caused by each of these natural factors, then subtracted the values from the total. The portion leftover is the radiative forcing.”
And that approach is wrong! It could work in a scheme where A causes X, B causes Y and C causes Z. In other words, where causation is not overlapped and there is no redundancy. It will not work however if A causes X AND B causes X.
We have multiple such redundancies, for instance in the way clouds and GHGs reduce emissions. How to allocate causation within redundant systems is an unsolved question. We know however that the subtraction method is illicit. That is saying since A causes X, B will not make any difference and thus is irrelevant. Arbitrarily we could say the same of A, which obviously makes no sense.
NASA makes a childish mistake in the way it interprets satellite data. Accordingly the “results” are garbage.
Precisely. What’s the forcing from the +AMO vs the -AMO? They have no idea as we’ve been in a +AMO since the satellite was launched. What about total undersea volcanic activity. Are they claiming they know precisely what this is? The claim is total nonsense.
From everything I know, if a molecule is a good absorber, then it is also a good emitter. H2O absorbs a tremendous amount of energy from near IR. Much more than is accounted for in the typical radiation spectra of the earth. But, does H2O also radiate at the near IR wavelengths also? If so, have we measured it? Can IR at 16 um (H2O) be part of the near IR radiation?
First of all the graph is wrong! Visible light is in the 400-800nm range. 500nm+ is green, not red. The term “near IR” is used for IR close to visible light. “Far IR” is usually referred to as 15µm+.
H2O does radiate beyond the CO2 range in the far IR range. Actually that is where most of the “GHE” of H2O is located. There are a couple of problems however.
From the first sentence, “Our planet is constantly trying…” Trying? So NASA now believes in the supernatural, maybe even —- God?
Sofia has to justify her salary and NASA has to justify its budget. Hence, this.
I find this claim absurd. How so? Last year I downloaded the CERES 1 degree x 1 degree hourly shortwave out (i.e. reflected solar energy) and longwave energy out for a gridpoint near where I live. Here are plots of hourly shortwave, longwave, and combined for 2018. There is no way to have established a precise out-of-balance condition as NASA’s Gavin Schmidt claims. Every place on Earth sits under a variable emitter/reflector at some altitude above. It is powered in part from the longwave coupling with the surface. Its outputs look like these time series plots. NASA knows better than to promote the continuing misconception of the climate question as a matter of forcing and feedback. Better to grasp that the variable emitter/reflector is largely supplied from below, as the heat engine operation of the atmosphere performs its duty without fail.
I should add this challenge: Find the 530 milliwatt shortage in these graphs. If it cannot be found in a single gridpoint’s data, how in the world does NASA believe a globally precise value could ever be “observed?”
By STATISTICAL MALFEASANCE
Looking at their sequence of earth maps depicting the process their final cell is supposed to be the result of the human change. It shows tropical warming and polar stasis. That seems opposite of what we have been told is happening.
I am just an interested observer and info gatherer on this web site & not educated in the niceties of the scientific technicalities- so my uninformed question is what is considered the norm and how did they arrive at it- actual data for many years, computer extrapolations, or supposed guessed data from the climate change alarmists
Well direct observed evidence of historical temperatures show that the climate models are total failures.
>>
. . . greenhouse gases like carbon dioxide (CO2) – a key driver of global warming . . . .
<<
It’s more like a very minor factor. CO2 is only a “key driver” in their minds (and models).
Jim
+0.5 W/m² TOA forcing increase in 15 years, eh?
Okay, let’s do the math, and see what that means for temperatures…
The Stefan-Boltzman relation is:
E = ε σ T⁴, where:
E = radiative emission
epsilon ε is emissivity (note that ε [0..1] is actually a function of wavelength, except for perfect grey-bodies)
sigma σ is the Stefan-Boltzman constant = 5.670374419E−8 W/m²K⁴
temperature T is in Kelvin
Referencing: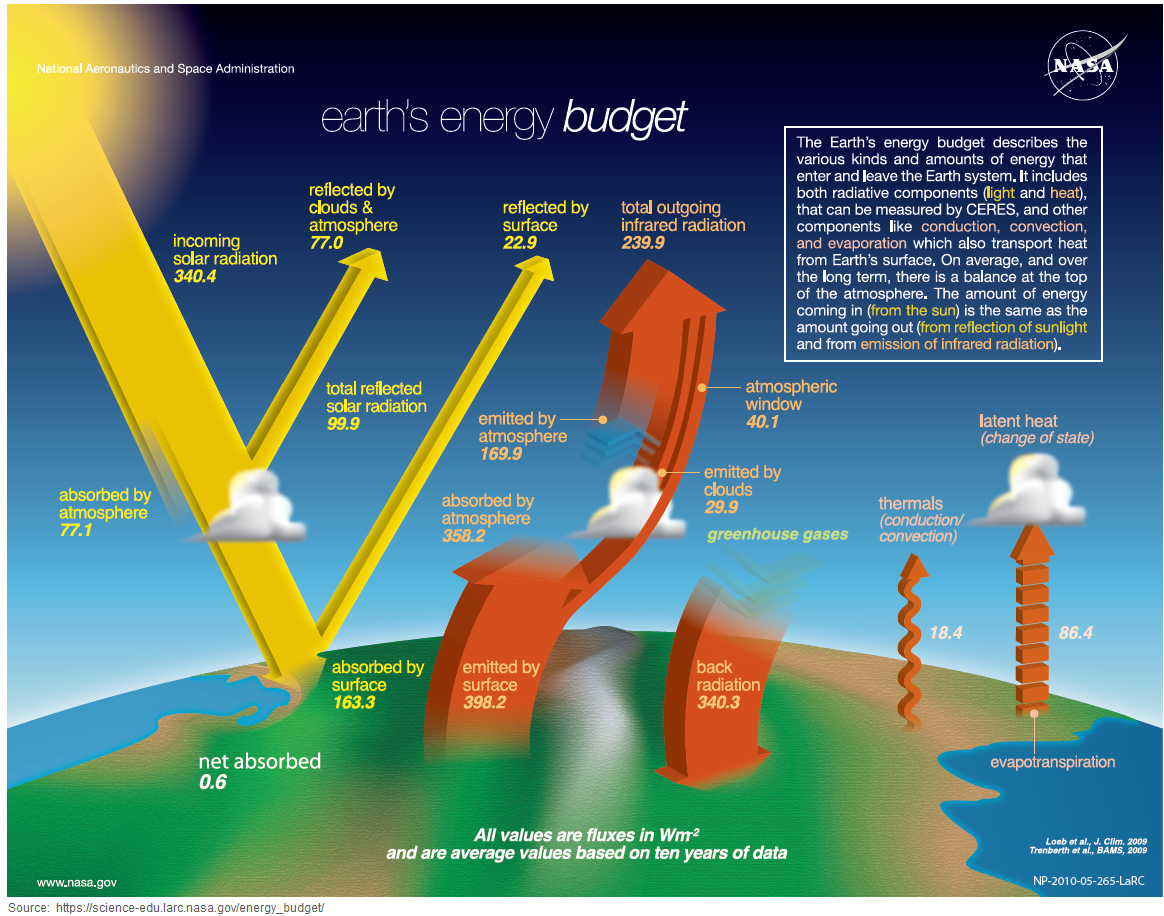
https://science-edu.larc.nasa.gov/energy_budget/
emissivity ε = approx. 0.7065 (calculated as 1-albedo, for incoming visible & near-IR solar radiation, but maybe not quite right for our LW IR math)
T = 288K (Earth’s current approximate average temperature)
E = ε σ T⁴ = 0.7065 × 5.670374419E−8 × 288^4 = 275.61 W/m² (which is about 15% higher than the 239.9 expected — is that because LWIR emissivity is different from the visible & near IR “1-albedo” value that I calculated as 0.7065?)
Increasing temperature by 1°C…
T = 289K
E = ε σ T⁴ = 0.7065 × 5.670374419E−8 × 289^4 = 279.46 W/m²
279.46 – 275.61 = 3.85 W/m² = the increase in outgoing radiation for a 1°C increase in temperature.
So, 0.5 W/m² = 0.5 / 3.85 = 0.13°C in 15 years, a trend of only +0.087 °C/decade.
Ho, hum. That’s substantially slower warming than most temperature indexes claim.
If we tweak ε down to 0.0615, to make emissions at 288K equal the expected 239.9 W/m², the RF difference for +1°C is 3.35 W/m², making the warming trend from 0.5 W/m²/(15yrs) still only +0.10 °C/decade.
Unless I’ve made a mistake in those calculations, it seems to me that the Kramer paper‘s title should have been, “Observational evidence of less global radiative forcing increase than expected,” instead of “Observational evidence of increasing global radiative forcing.”
Have I missed something?
They have effectively PROVEN that most of the highly beneficial warming …
… HAS NOT COME FROM GHG warming,
… of which CO2 could only be a tiny part if it actually existed. 🙂
Oops! Typo correction:
“If we tweak ε down to 0.0615, to make…”
…should have been:
“If we tweak ε down to 0.615, to make…”
(The “3.35” calculation link used the right number.)
I still haven’t found a copy of Kramer’s actual paper, but the abstract reports a TOA radiative forcing change of 0.53±0.11 W/m² from 2003 to 2018.
Per Mauna Loa measurements, average atmospheric CO2 concentration rose from 375.80 ppmv in 2003 to 408.52 ppmv in 2018. log2(408.52/375.80) = 0.12044, so that increase was about 12% of a doubling.
CH4 concentration rose from 1.777 ppmv in 2003 to 1.857 in 2018. Per MODTRAN, the CH4 increase should have accounted for about 298.488 – 298.426 = 0.062 W/m².
If CO2 and consequent feedbacks accounted for the rest, that leaves 0.53±0.11 – 0.06 = 0.47±0.11 W/m², from a 12% CO2 increase, so RF at TOA from a doubling of CO2 should be 0.47±0.11 / 0.12044 = 3.90±0.92 W/m².
That’s about the same as the Myhre 1998 and the IPCC (TAR & later) estimates for radiative forcing from CO2 alone, without feedbacks: 3.7±0.4 W/m² per doubling of CO2.
https://sealevel.info/Radiative_Forcing_synopsis.html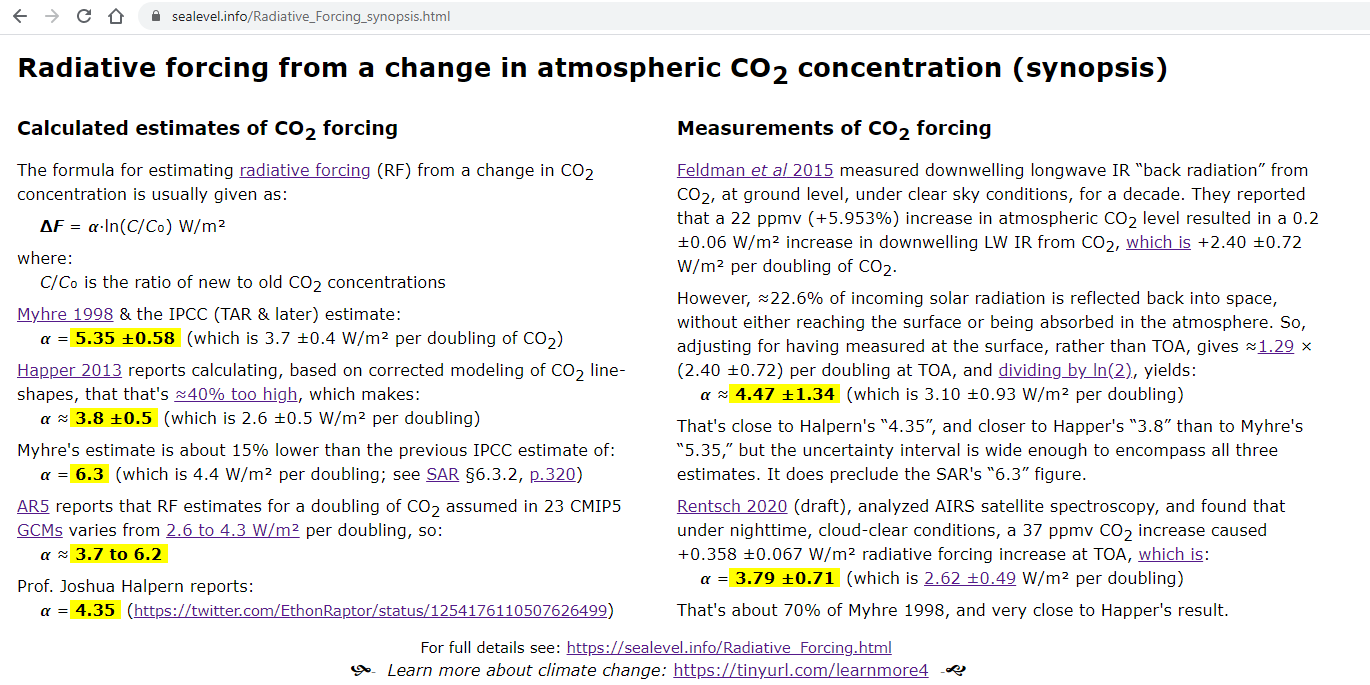
What????
to 1 decimal place, with NO ERROR or DEVIATION bars?
LAUGHABLE NON-SCIENCE.
In order to accurately measure the net radiation imbalance, the researchers would have to integrate the outgoing radiation (in the UV, visible, and infrared ranges) over the entire surface of the earth.
Satellites in geo-stationary orbits (which follow the earth’s rotation) are always over the equator, and must be farther away to orbit every 24 hours. In order to get accurate measurements at all latitudes, satellites would be needed in circumpolar orbits (moving south to north on one side of the earth, then north to south on the other side), but the earth rotating under these satellites would mean that they are not over the same meridian during successive orbits.
Do the researchers have enough satellites in circumpolar orbits that can accurately measure outgoing radiation over temperate and polar areas?
The incoming solar radiation (at 1,368 W/m2) is projected onto a circular area of pi*R^2, where R is the radius of the earth, but the total surface area of a sphere is 4*pi*R^2, so that the average incident radiation from the sun over the entire earth’s surface (including the night side) would be 1,368 / 4 = 342 W/m2.
An imbalance of 0.5 W/m2 is equivalent to less than 0.15% of the average incoming energy from the sun. If there are not enough satellites in circumpolar orbits to accurately integrate the average outgoing radiation over the entire earth’s surface, this “measured” energy imbalance could be merely measurement error, and the errors bars could reasonably include an energy imbalance of zero.
Math is hard. Numbers is easy.
Any discussion of earth’s energy budget that does not mention evaporation is bogus.