Guest “geological perspective” by David Middleton
This is sort of a sequel yesterday’s post: Where’s the sea ice? 3 reasons the Arctic freeze is unseasonably late and why it matters.
With the setting of the sun and the onset of polar darkness, the Arctic Ocean would normally be crusted with sea ice along the Siberian coast by now. But this year, the water is still open.
Mark Serreze, University of Colorado Boulder
What a difference a day can make! Looks like it’s starting to crust over:

“Where’s the sea ice?”
Right here:

September is the most recent monthly ice extent map available. September is also when the annual minimum generally occurs. The magenta outline represents the median September ice edge from 1981-2010. The minimum Arctic sea ice extent generally occurs in September. At 3.9 million km2, this is the second lowest September “on record.” A record that goes all the way back to 1979.

Considering the fact that this is such a short record length, is a 3-5 million km2 annual minimum particularly anomalous? Or are the 6-7 million km2 annual minima from 1979-2000 actually the anomaly? We really need some context and scale here.
Geologists are big on context and scale. When a geologist takes a picture with a person in it, the person is just for scale. Since quarters, lens caps and rock hammers are far too small to provide scale to 3.9 million square kilometers of sea ice, and 42 years is far too short of a time span to provide context, we need something bigger, with a longer time span.
Scale
We can use the Arctic Ocean to provide scale:
The Arctic Ocean is the smallest of the world’s five oceans (after the Pacific Ocean, Atlantic Ocean, Indian Ocean, and the Southern Ocean). The Northwest Passage (US and Canada) and Northern Sea Route (Norway and Russia) are two important seasonal waterways. In recent years the polar ice pack has receded in the summer allowing for increased navigation and raising the possibility of future sovereignty and shipping disputes among the six countries bordering the Arctic Ocean (Canada, Denmark (Greenland), Iceland, Norway, Russia, US).
Area:
CIA World Fact Book
total: 14.056 million sq km

3.9 million km2 represents 28% of the area of the Arctic Ocean.
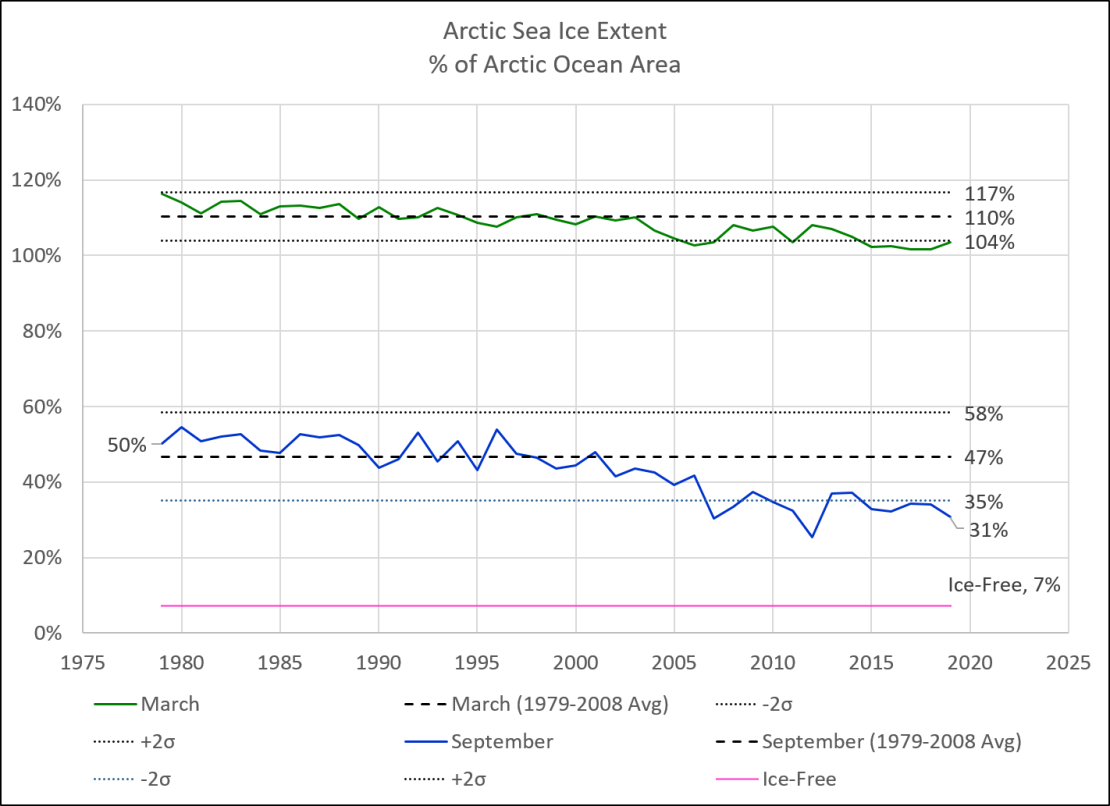
28% of the Arctic Ocean is just a bit below the climate “normal” range of 35% to 58% for the annual minimum. This doesn’t sound like much of a death spiral to me. Bear in mind that the satellite record started right about here:

Context
42 years is much too short of a record length to determine what the climate “normal” should be. It doesn’t provide a meaningful context. Fortunately, there have been efforts to reconstruct sea ice extent prior to the satellite record.

Nearly 70 years is better than 42 years… But still insufficient for context.
To look back into the past, researchers combine data and records from indirect sources known as proxy records. Researchers delved into shipping charts going back to the 1950s, which noted sea ice conditions. The data gleaned from those records, called the Hadley data set, show that Arctic sea ice has declined since at least the mid-1950s. Shipping records exist back to the 1700s, but do not provide complete coverage of the Arctic Ocean. However, taken together these records indicate that the current decline is unprecedented in the last several hundred years.
NSIDC
“The current decline is unprecedented in the last several hundred years” claim is a big, fat No Schist Sherlock. Earth has been warming from the coldest climate of the Holocene (the Little Ice Age) for the last 400-500 years.
Kinnard et al, 2008, pieced together a reconstruction back to 1870…

Oddly, Kinnard indicates minima with about 1 million km2 more ice extent than the satellite data.

Now we ‘re seeing a hint of context. The sea ice decline began when the Arctic sea ice extent was anomalously large. Let’s relate the context to scale:

According to the Kinnard reconstruction, the Arctic Ocean still has about half as much summer sea ice as it did at the end of Neoglacition, the maximum extent of Holocene glaciers and sea ice. Why is this a bad thing? Since 1870, Arctic sea ice has been retreating from this sort of climate “normal”…

Kinnard also featured a neat map:

Panel B is the annual minimum. Kinnard et al assert that the gray area had been covered with summer sea ice 100% of the time from 1870-2003. Let’s overlay the 2020 NSIDC map on Panel B:

Alright… So, the annual sea ice minimum is now clearly lower than it was from the Little Ice Age through “The Ice Age Cometh”… How is this a bad thing? For that matter, we still don’t know which is the true anomaly: The recent 3-5 million km2 annual minima or the 6-10 million km2 annual minima from 1870-2003? The minimum summer sea ice covered about twice as much area for 90% of the past 150 years… So what? Is 150 years a long time? Is it relevant to the Holocene Epoch? Is it one of the “Goldilocks conditions” of the Holocene? We clearly need more context. We need a geological perspective.
A Geological Perspective
Stein et al., 2017 (H/T tty) provided a great description of a rather novel method of determining paleo sea ice extent.
In a pioneering study by Belt et al. (2007), the ability to (semi-)quantitatively reconstruct paleo-sea ice distributions has been significantly improved by a biomarker approach based on determination of a highly branched isoprenoid (HBI) with 25 carbons (C25 HBI monoene = IP25). This biomarker is only biosynthesized by specific diatoms living within the Arctic sea ice (Brown et al., 2014) and appears to be a specific, sensitive and stable proxy for Arctic sea ice in sedimentary sections representing Late Miocene to Recent times (Stein et al., 2012, 2016; Belt and Müller, 2013; Stein and Fahl, 2013; Knies et al., 2014). The presence of IP25 in the studied sediments is direct evidence for the presence of sea ice.
[…]
For more semi-quantitative estimates of present and past sea ice coverage, M€uller et al. (2011) combined the sea-ice proxy IP25 and phytoplankton biomarkers in a phytoplankton- IP25 index, the so-called ‘PIP25 index’:
PIP25 = [IP25]/([IP25] + ([phytoplankton marker] x c))
with c is the mean IP25 concentration/mean phytoplankton biomarker concentration for a specific data set or core.
[…]
Stein et al., 2017
This schematic diagram from Belt et al., 2013 relates the PIP25 index to sea ice conditions:

Generally speaking, the PIP25 index correlates to sea ice extent as follows:
- >0.7 = Extended, perennial (year-round) ice cover
- 0.5-0.7 = Seasonal ice cover/ice edge situation (mostly ice-free in summer)
- 0.1-0.3 = Reduced ice cover (only winter ice)
- <0.1 = Ice-free year-round
Here’s an example from the Chukchi Sea:

Note that the sea ice at this location has only been seasonal since about 1,600 years ago. Prior to that it was considered reduced, covered only partially during winter. It was much lower than it is today for about 85% of the Holocene.
Stein et al. 2017, constructed a cross-section of PIP25 curves across the Arctic from the Fram Strait to the Chukchi Sea.

All four core locations currently reflect seasonal ice cover/ice edge situations (PIP25 index 0.5-0.7), with the Fram Strait being an ice edge situation and the other three reflecting seasonal ice cover.

Two key takeaways:
- Maximum Holocene sea ice extent occurred within the past 500-1,000 years at every location.
- The current sea ice extent is higher at all of the locations than over 50% to 85% of the Holocene.
While this doesn’t tell us what the sea ice extent was in million km2, it does tell us that the modern sea ice extent is larger than it was over most of the Holocene Epoch. It also tells us that the areas of currently seasonal sea ice extent have been seasonal or reduced over most of the past 5,000 years and ice-free or nearly ice-free over the prior 3,000 years or so. Here’s is the Kinnard graph plotted at the same horizontal scale as the Stein cross section:

Where’s the sea ice?
Right where it’s been for most of the Holocene… And that’s a good thing. Had the sea ice continued to expand as it was from 8,000 years ago up until the mid-19th century, this would still be the climate crisis du jour:
So, next time you get gas at an Exxon station, be sure to thank them for this:


Humble Oil was founded in Humble, Texas in 1911. In 1919, Standard Oil of New Jersey acquired a 50% stake in Humble Oil. They acquired the other 50% in 1959. All of the affiliates were merged into Exxon Corporation by 1973 and Exxon ultimately merged with Mobil Oil Corporation, a descendant of Standard Oil Company of New York, in 1999 to become ExxonMobil (Texas State Historical Association).
Here’s your oil industry trivia for the day:

In as few as three more mergers, Standard Oil could be put back together again! That’s fracking awesome!
References
Belt S.T., Müller J. “The Arctic sea ice biomarker IP25: A review of current understanding, recommendations for future research and applications in palaeo sea ice reconstructions”. (2013) Quaternary Science Reviews, 79, pp. 9-25. Belt_2013
Fetterer, F., K. Knowles, W. N. Meier, M. Savoie, and A. K. Windnagel. 2017, updated daily. Sea Ice Index, Version 3. [Sea Ice Monthly By Year]. Boulder, Colorado USA. NSIDC: National Snow and Ice Data Center. doi: https://doi.org/10.7265/N5K072F8. [Accessed October 16, 2019].
Kinnard, C., Zdanowicz,C.M., Koerner,R .,Fisher,D.A., 2008. “A changing Arctic seasonal ice zone–observations from 1870–2003 and possible oceanographic consequences”. 35, L02507. Kinnard_2008
Stein, R. , Fahl, K. , Schade, I. , Manerung, A. , Wassmuth, S. , Niessen, F. and Nam, S. (2017), Holocene variability in sea ice cover, primary production, and Pacific‐Water inflow and climate change in the Chukchi and East Siberian Seas (Arctic Ocean). J. Quaternary Sci., 32: 362-379. doi:10.1002/jqs.2929 stein2017
Three issues. First, establish a baseline in the near frame and separately looking forward, looking backward through inference. Two, determining the normal system distribution: median and variance in time and space, and how to characterize male and female humans in this context. Three, assuming that the observed trends are persistent, is a warmer, greener Earth a desirable outcome. Many argue that it is not, and that the environment would be better if the system was colder and Greener (i.e. grayer).
David
” We really [need] some context and scale here.”
I knew I missed something… D’oh!
David
You remarked, For that matter, we still don’t know which is the true anomaly: …” It is known that polar bears have the ability to swim for hundreds of miles. Would they have evolved with that capability if their environment was perennially frozen? With their webbed feet, they are obviously adapted to spending much of their time swimming, rather than always crashing through the snow cover to get to young seals in their dens. I would suggest that polar bears have always inhabited an environment with a great deal of open water for at least part of the year. Those bears that couldn’t swim well ended up being out-reproduced by bears that could. I think that addresses which is the true anomaly.
Yep. If polar bears evolved 180,000 years ago to specifically occupy a habitat niche that hasn’t existed over most of their natural history, they don’t exist.
😎
David Middleton, deep gratitude for an excellent scientific study.
Work like yours makes WUWT continue to sit in the top ranks of intelligent blogs and investigative scientific research. The scientific method par excellence.
Trolls are taken care of handily by the crew of brilliant commenters. Honest differences of scientific opinion often appear, too, with interesting illuminations. However, the “honest” element appears to be far and few between these days.
Thanks, Anthony for WUWT
Retired geologist Roger Higgs has developed a view on the climate change theory from his professional expertise now that he does not have external pressures to conform to the “consensus”.
https://www.researchgate.net/publication/341622566_IPCC_three_pillars_of_man-made_global_warming_collapsed
He also notes a distinct lack of geologists contributing to the next IPPC report.
https://www.researchgate.net/publication/331974185_IPCC_next_climate_assessment_report_AR6_due_2022_-_784_authors_but_again_no_geologists
To anyone frightened of diminishing Arctic sea ice, or Antarctic sea ice, or Greenland ice cap ice, or mountain glacier ice, please do a search and some reading on ‘latitudinal gradients in species diversity’. I can predict the conclusions from doing this of an open and scientific mind, but not of a closed and alarmist one.
When one has spent a career personally dating rocks from the Juneau Icefields at 900 million years, from mining silver in a Jurassic vein system, and to whom ‘surficial geology’ includes realizing that the Rocky Mountain Cambrian rocks were an un-eroded boring high plain in the Miocene–a few tens to thousands of years of ice-cover oscillations is just so incredibly insignificant.
All Dave tried to do was to present some perspective so people could ‘get a grip’. Note those on whom the message seems lost, it changes nothing. And I have no idea what can be done about this.
In the Jerry Brown regime this would have been good for about 12 miles of high speed rail funding, maybe. That pretty well sums up the role of climate change in the political realm. How much money is in it for me and my special interest groups (unions, Sierra Club donors, and extra share of the Federal funding programs).
Arctic Sea Ice? Let’s see what a real expert had to say, a man who actually went there and made observations and measurements:
Nansen F. Farthest North: Being the Record of a Voyage of Exploration of the Ship “Fram” 1893–96
Nansen, Schmansen! Measurements, schmeasurements!
All that matters is the consensus of expert opinion whose livelihoods depend upon the consensus.
Nansen was so late 19th century!
John,
And I am so late 20th Century …
My understanding of what Nansen was observing and describing is this:
1. First the snow melt water ponds form on the surface of the ice. (hence the boating lake).
2. Then this fresh water pond suddenly drained into the ocean below the ice through a hole at the base of the pond.
3. Nansen describes and measures a layer of fresh water floating on top of the salt water as being some 3 metres thick:
4. It is not absolutely clear if the 3 meter layer of fresh water is measured from the air surface or from the base of the ice ( I will assume from the air surface as his temperature profiles elsewhere show water temperatures as being below zero Celsius below the ice). However 3 metres of fresh water is thicker than the measured 2.57 metres of ice (then increased to 2.76 m). So, in this eventuality we have a skim of fresh water some 43 cm thick lying below the ice (2.57 + 0.43 = 3.00) this skim of fresh water then reduces to a skim of just 24 cm thick as the ice thickness augments (2.76 + 0.24 = 3.00).
5. N.B. Because of density differences the datum air/ice surface will be above datum air/water surface (the freeboard of the ice), so the accommodation space for the fresh water will be more than that of the floating ice.
6. Because the fresh melt water skim below the sea ice is in contact with the dense cold seawater (temp -1.5C ), the fresh is freezing at the base of the water column (not at the ice base). This process then forms mush ice which floats up through the fresh water skim (a form of reverse snow in water) to the base of the ice and then welds onto the solid ice above augmenting its thickness from the base as Nansen describes.
Field work beats computer models every day of the week and twice on holidays.
+10 Very interesting.
I love reading old record logs and scientific diary entries.
I highly recommend Scott’s diary that can be read online here : http://www.bl.uk/turning-the-pages/?id=12878b6a-36b9-44db-a940-365b21bfe524&type=book
Another, more modern history that I came across the other day, is the English version of a Soviet era debacle in the Arctic, concerning the good ship “Lenin”. Here is the abstract:
The Drift of Lenin’s Convoy in the Laptev Sea, 1937 – 1938
WILLIAM BARR
As a result of various miscalculations 25 ships underwent an enforced
wintering at various points in the Soviet Arctic in the winter of 1937-1938. Among the
vessels involved was a convoy of six ships led by the icebreaker Lenin, which spent the
winter drifting in the Laptev Sea. Several of the ships were severely damaged by ice
pressure, and one ship was crushed and sank. Early in 1938 all superfluous personnel were flown south to Tiksi in an emergency airlift operation. The author presents the
first detailed English-language account of this wintering.
http://pubs.aina.ucalgary.ca/arctic/Arctic33-1-3.pdf
Interesting article from Mr Middleton also.
David,
Thanks for another interesting post! I was wondering if you have any specific recommendations for geology texts and writings that would be good to add to my hidden cache of forbidden knowledge! I’m sure that the religious zealots like the griff and Loy-doh will want to burn all the books that contradict their dogma, and geological texts will probably be first on their list!
Basic geology textbook… An early edition (pre-1980) of The Earth by Press & Sister.
Press and Siever
(I bought it already on your advice.)
Great article, David.
And a lot of good comments.
Meanwhile Arctic ice extent is more or less back to normal
http://polarportal.dk/fileadmin/polarportal/sea/SICE_curve_extent_LA_EN_20201031.png
and the ice volume is in rude health
http://polarportal.dk/fileadmin/polarportal/sea/CICE_curve_thick_LA_EN_20201031.png
Yes Phil, the October growth has been more than most years in the 1980s.
The levelling-off at an extent and thickness far above the Holocene normal continues.
Just enough open Arctic sea for sea life to start returning after a long time absent due to the extreme levels of sea ice in the LIA and late 1970s.
https://partner.sciencenorway.no/arctic-ocean-forskningno-fram-centre/the-ice-retreats–whale-food-returns/1401824
https://journals.sagepub.com/doi/abs/10.1177/0959683617715701?journalCode=hola
Unfortunately, there are those that really HATE the idea of Arctic sea life being able to swim and feed freely again…
Sad, but true. 🙁
Phil Salmon November 1, 2020 at 3:08 pm
Meanwhile Arctic ice extent is more or less back to normal
http://polarportal.dk/fileadmin/polarportal/sea/SICE_curve_extent_LA_EN_20201031.png
Back to normal? That graph shows it’s the lowest ever for the date, not normal!
and the ice volume is in rude health
http://polarportal.dk/fileadmin/polarportal/sea/CICE_curve_thick_LA_EN_20201031.png
Rude health? It shows second lowest ever and about 3,500 km^3 below average.
“Back to normal? That graph shows it’s the lowest ever for the date, not normal!
NO , your ignorant twit
Normal for the Holocene is MUCH LOWER than current levels
The ANOMALY was the extreme highs of the LIA and late 1970s
Are you capable of learning any basic facts at all,
or is climate change DENIAL brain-washed into what used to be your mind.
fred250 November 1, 2020 at 11:03 pm
“Back to normal? That graph shows it’s the lowest ever for the date, not normal!
NO , your ignorant twit
Normal for the Holocene is MUCH LOWER than current levels
“That graph” refers to 1981-2000, it does not refer to the Holocene.
So what.
1979 was the EXTREME high.
Why would anyone with an open mind look at a period just after the HIGHEST EXTENT since the LIA and think it was “normal”. That is abnormal, twisted, dumb etc
Normal sea ice extent is FAR LOWER than current levels
Close your mind little philp and leave it closed…..
Only way you can protect you religious based idiocy is by rabid climate change denial.
fred250 November 2, 2020 at 11:44 am
So what.
1979 was the EXTREME high.
Why would anyone with an open mind look at a period just after the HIGHEST EXTENT since the LIA and think it was “normal”. That is abnormal, twisted, dumb etc
Normal sea ice extent is FAR LOWER than current levels
Phil Salmon chose the data we are discussing so unlike you I commented on that data. Your tactic is usually to ignore the matter under discussion and introduce something totally different.
YAWN,
Climate Change DENIAL is deeply ingrained in your little mind, isn’t it Phlip
You just cannot allow yourself to accept the FACT that current levels of Arctic sea ice are FAR higher than for most of the last 10,000 years
DENY, DENY, DENY.. so funny watching you twist yourself into a mindless pretzel. !
https://notrickszone.com/2020/10/29/3-more-new-studies-show-modern-arctic-sea-ice-extent-is-greater-than-nearly-any-time-in-the-last-10000-years/
Perhaps if you concentrated on actual SCIENCE instead of brain-fed mantra, you might look less of a mindless zealot.
fred250 November 3, 2020 at 3:30 am
You just cannot allow yourself to accept the FACT that current levels of Arctic sea ice are FAR higher than for most of the last 10,000 years
It isn’t a fact, it’s an exaggeration, and irrelevant to the subject under discussion but you always have to drag it in.
Arctic sea ice extent is FAR ABOVE the level it has been for MOST of the last 10,000 years
Cover your ears, close your eyes and go la-la-la.
That way the FACTS won’t penetrate your thick empty skull. !
Sad and very pathetic
You have gone from DUMB to DUMBER.. and way past DUMBEST
….. and you just keep going.
Its most hilarious .. 🙂
One day you will wake up and realise what an arrant FOOL you are
LIA and late 1970s were EXTREME outliers
The Arctic is all the better for the RECOVERY back slightly towards the much lower Holocene norm
Not only is the land surface GREENING, but the seas are also springing BACK to life after being TOO COLD and frozen over for much of the last 500 or so years (coldest period of the Holocene)
The drop in sea ice slightly toward the pre-LIA levels has opened up the food supply for the nearly extinct Bowhead Whale, and they are returning to the waters around Svalbard.
https://partner.sciencenorway.no/arctic-ocean-forskningno-fram-centre/the-ice-retreats–whale-food-returns/1401824
The Blue Mussel is also making a return, having been absent for a few thousand years, apart from a brief stint during the MWP.
https://journals.sagepub.com/doi/abs/10.1177/0959683617715701?journalCode=hola
Many other species of whale are also returning now that the sea ice extent has dropped from the extreme highs of the LIA. Whales cannot swim on ice. !
https://blog.poseidonexpeditions.com/whales-of-svalbard/
Great thing is, that because of fossil fuels and plastics, they will no longer be hunted for whale blubber for lamps and for whale bone.
Hopefully the Arctic doesn’t re-freeze too much in the next AMO cycle, and these glorious creatures get a chance to survive and multiply.
Don’t be a HATER of Arctic sea life, even if you do hate your own existence.
And don’t be a rabid DENIER of climate change history.
fred250,
Here is the link to Farthest North Nansen’s account of the Voyage of the Fram: Chapter 5 Voyage through the Kara Sea.
The Fram was deliberately frozen into the ice floe in the Laptev Sea on 25th September 1894.
The sounding shows that the Fram was off the shelf edge of the Laptev Sea in deep water at by my estimate longitude circa 113E.
Correction 25th September 1893.
Yep, a lot of sea ice up there during the LIA and late 1970s.
Anomalously high extents. No room for much sea life.
There are some people how actually think these huge extents of sea ice are “normal” and “desirable”…. locking Arctic sea life out of their 10,000 year of feeding grounds.
They care more about sea ice, than they do about actual sea LIFE.
Sad, but true.
ICE in the arctic increased 441.000 square kilometers over the weekend.
Rapid gains today too, now above 2016 levels in NSIDC.
Pity , Arctic sea life will get squeezed out again from these high sea ice levels.