By Anthony Watts
The media this week are hyping a new study claiming global warming is causing a new megadrought in the American Southwest. In reality, the recent drought in the American Southwest is nothing new when you look at historical data.
The new study, published in Science, is titled “Anthropogenic megadrought.” The title alone suggests this is more of an opinion piece than a work of science.
In the abstract of the paper, author David Stahle claims evidence shows:
“…that the 16th-century megadrought was the worst multidecadal drought episode in the Southwest over the past 1200 years, and that the second-worst event occurred from 2000 to 2018 over southwestern North America (SWNA) and may be ongoing. The study also pinpoints substantial anthropogenic (human) contribution to the severity of the current drought.”
That sounds quite conclusive, and media stories from the Associated Press, USA Today, Washington Post, New York Times, and many others are uncritically distributing the claim made by the paper and its sole author.
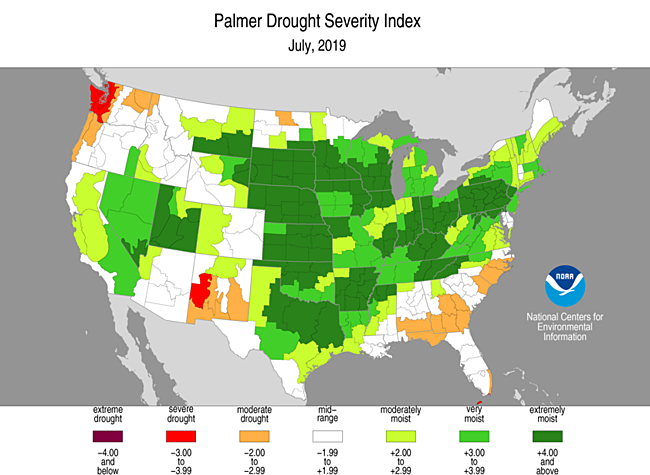
Is the USA in a “megadrought”? Looking at April 14th 2020 data from the United States Drought Monitor, it sure doesn’t seem so. While there are indications of some drought in the USA Southwest, there seem to be equally large areas that have no drought conditions at all. And, just one year ago, there were no indications of drought in the southwest USA whatsoever. This might be why Stahle only used data through 2018, because the “no drought” year of 2019 didn’t support the claims of “megadrought”. Cherry picking anyone?
Looking at the USA drought monitor map for summer 1934 and summer 2019, the difference becomes clear.


Using a tree-ring-based drought record from the years 1000 to 2005 and modern records, scientists from NASA and Lamont-Doherty Earth Observatory found the 1934 drought was 30 percent more severe than the runner-up drought (in 1580) and extended across 71.6 percent of western North America.
Another study suggests that the 1934 dust-bowl drought didn’t even make the top 10 in terms of severity, and another found a “megadrought” in the Southwest USA during the time of the Roman Empire.
With that historical data, it is impossible to claim our use of fossil fuels in the last century is leading to a new megadrought.
Here’s the punch line; the notion that the Anthropogenic megadrought paper published by Stahle is flawed is perfectly illustrated by a single chart also using tree ring data from the Western USA.

The chart above uses data from the 2007 E.R.Cook et al. study showing severe droughts lasting as long as 200 years going back to 1200 years ago. Meanwhile, at the far right, the drought we’ve experienced in the 21st century is clearly evident and miniscule by comparison.
Clearly there have been long-lasting severe droughts in the Western USA long before “man-made climate change” became a social cause célèbre of the left. It is even clearer that the current claim of an impending megadrought is simply the questionable opinion of one scientist that has been serially and uncritically regurgitated by the mass media.
” Meanwhile, at the far right, the drought we’ve experienced in the 21st century is clearly evident and miniscule by comparison.”
But the graph is titled “Percentage of the West affected by drought from 800 ad to 2000”.
Luckily we can look at the indexes comparing 2018 and 2000. Here is one for the continental US at least (from “Open Mind,” no less) which shows the 21st century is better than the blip at the end of the 20th
And then there’s the fictional world of GCMs whose hindcasting and “projections” are/were a joke. https://advances.sciencemag.org/content/1/1/e1400082?ntvDuo=true
I disagree. Paleoclimatology and paleobiology both show a cyclic pattern of megadroughts in the American Southwest. This has been known for years, and several articles plus one book have been written in the past few years about it, with predictions that another megadrought seemed to have just started. It just doesn’t have anything to do with global warming. I wrote an op-ed in the Modesto Bee (California) a few years ago about this.
Now this new article has appeared regurgitating the ones I mentioned but now blaming the incipient new drought on global warming. I expect the current CV19 pandemic to be blamed on global warming too.
The cyclic megadrought science here is real. This new article blaming it on global warming is fake.
Here are the websites for a book and an article about cyclic mega-droughts in the American Southwest which I used as sources for my Modesto Bee op-ed:
http://www.amazon.com/gp/product/B00D4EWHPU/ref=oh_aui_d_detailpage_o02_?ie=UTF8&psc=1, The West without Water: What Past Floods, Droughts, and Other Climatic Clues Tell Us about Tomorrow, Ingram, B. Lynn, and Malamud-Roam, Frances, 2013, University of California Press
http://ngm.nationalgeographic.com/2008/02/drying-west/kunzig-text, Drying of the West, (February 2008), National Geographic, Kunzig, Robert
Is this “Megadrought” anything like California’s “Permanent Droughts” (which are periodically interrupted by “Permanent Flooding)?
The more Climate Changes, the more it stays the same.
Quoting from the paper:
“….and that the second-worst event occurred from 2000 to 2018 over southwestern North America (SWNA) and may be ongoing.”
Really what does the NOAA Precipitation data show?
+.55/ decade INCREASE in Precipitation for the SW Climate Region, for the 2000-2018 time frame.
https://www.ncdc.noaa.gov/cag/regional/time-series/107/pcp/12/1/2000-2018?base_prd=true&begbaseyear=1900&endbaseyear=2000&trend=true&trend_base=10&begtrendyear=2000&endtrendyear=2018
Bwahahahahahahahahahahaha!!!
😆😂🤣😄😝😀
You go, S. Tommy.
🤨 If I could edit….. I would remove the first comma. But. Oh. Well. (I erased the comma, thanks for the tip) SUNMOD
🚗🚛🎈🍕🥤🍫💐🌷🐾🐕🦺🦢🦚🦅
Sure do miss being able to post images (and videos) around this place …. those little emoji things just aren’t cutting it (btw: @ur momisugly anyone wanting to use those little graphics– just type the Windows key and the “.” key at the same time and a little pop up selection will appear — just click on the emoji you want to insert into your comment — sometimes, WordPress turns it into a black and white, boring, version)
Whoa! 🙂 a mod spoke to me!
Thank you. But…. ? (I can still see the comma after “You”)
(Ohhh, I though you were talking about MY comma…) SUNMOD
🙂
Bit like the ‘pause’, but take it back a few years and this happens.
https://www.ncdc.noaa.gov/cag/regional/time-series/107/pcp/12/1/1981-2018?base_prd=true&begbaseyear=1900&endbaseyear=2000&trend=true&trend_base=10&begtrendyear=1981&endtrendyear=2018
And take it back a few more years and this happens:
https://www.ncdc.noaa.gov/cag/regional/time-series/107/pcp/12/1/1900-2018?base_prd=true&begbaseyear=1900&endbaseyear=2000&trend=true&trend_base=10&begtrendyear=1900&endtrendyear=2018
Gee Loydo, don’t you ever read the article?
I am using THEIR timeframe, which was 2000-2018 therefore that I posted was honest and credible.
Your post is not honest since you stray away from the time frames of that foolish paper.
Here is my other comment you must have missed:
https://wattsupwiththat.com/2020/04/18/claims-of-southwestern-usa-megadrought-are-all-wet/#comment-2970111
There I cover several time frames that responds to the article.
The magazine Science appears to not perform even high-school level fact-checking of articles that it publishes, based on the above article.
Boxed quote extract from the Science article at the very top of the this WUWT article:
“. . . that the 16th-century megadrought was the worst multidecadal drought episode in the Southwest over the past 1200 years, and that the second-worst event occurred from 2000 to 2018 over southwestern North America (SWNA) and may be ongoing.”
Now, consider that statement in comparison to the above WUWT article’s annotated graph, presented as Figure 1 (source E.R. Cook, et.al.), that clearly reveals four—yes, count them, four multidecadal droughts over the last 1200 years, all of which are far larger than the drought period of 2000-2018. Therefore, the “second-worst event” portion of the quote extract is COMPLETELY FALSE.
Next the same graph DOES NOT reveal any 16th century AD megadrought as is claimed . . . only a small red blip centered around 1580 AD that may have lasted as much as one single decade. Therefore, the “16th century megadrought” reference in the quote extract is COMPLETELY FALSE, based on the tree ring data.
Getting two things factually incorrect in a single sentence, and then seeing that statement widely published is just . . . well, unacceptable. But that is what Science (the magazine, or rag I should say), but not science (the discipline), has come to in today’s world.
“Therefore, the “16th century megadrought” reference in the quote extract is COMPLETELY FALSE, based on the tree ring data.”
And
“Getting two things factually incorrect in a single sentence, and then seeing that statement widely published is just . . . well, unacceptable. But that is what Science (the magazine, or rag I should say), but not science (the discipline), has come to in today’s world.”
I actually find it “unacceptable” you pontificate in ignorance of the paper.
How about you actually read it before arriving at a conclusion without the facts of the study…
…..
https://sci-hub.tw/downloads-ii/2020-04-16/cd/10.1126@science.aaz9600.pdf
And so too the others here answering the dog-whistle to criticism not knowing what the paper says.
But then again it’s not what this place is about.
Salt River Project reservoir (AZ)
Jan 1, 2019 47%
Jan 1, 2020 74%
Apr 18, 2020 98% (excess water is being released)
https://streamflow.watershedconnection.com/Dwr
Not exactly a MegaDrought! Last spring and this spring the hill and mountain sides are green.
Ed of Mesa
Ed,
Highlighting full reservoirs to refute a drought is just ‘cherry picking’, dontcha know? /s
I bought this article to check what it actually says. And what I read is really disturbing.
The paper combines tree ring-based moisture reconstruction to 1900-century precipitation data – wait, that is what you would expect it to do, but no. It combines tree ring-based reconstruction to _modeled_ soil moisture data for years 1901-2018:
“Here, we use 1586 tree-ring chronologies to reconstruct 0- to 200-cm summer (June to August) soil moisture and snow water equivalent (hereinafter termed “soil moisture” collectively) anomalies on a 0.5° latitude-longitude grid back to 800 CE across western North America [(30); Fig. 1]. Soil-moisture anomalies are standardized relative to the entire 800–2018 CE period, and the magnitude of negative anomalies indicates drought severity. The soil moisture record targeted in the reconstruction covers 1901–2018 and is referred to as Noah calibrated soil moisture (31). Because true observations of soil moisture do not exist, this soil-moisture record is modeled based on observed climate. Monthly precipitation, temperature, humidity, wind speed, and radiation data are used to force a bucket-type water balance model with inter month persistence tuned to emulate the Community Noah landsurface model (32)”.
By doing this “Williams trick” is manages to transform the extremely flat precipitation data for years 1901-2018 into something entirely different. From the original precipitation data for this area you cannot see anything special at all for the years 2000-2018:
https://www.ncdc.noaa.gov/cag/regional/time-series/109/pcp/12/11/1901-2018?base_prd=true&begbaseyear=1900&endbaseyear=2000&trend=true&trend_base=10&begtrendyear=1902&endtrendyear=2018
But the data in the study looks like this (reconstruction: figure C):
 &imgrefurl=https%3A%2F%2Fscience.sciencemag.org%2Fcontent%2F368%2F6488%2F314&tbnid=ELcCUXkUQ-IpEM&vet=12ahUKEwjM8teI5_LoAhVCZxoKHYFwCfgQMygAegUIARDjAQ..i&docid=TxP-87FTJQokuM&w=1280&h=1035&q=Large%20contribution%20from%20anthropogenic%20warming%20to%20an%20emerging%20North%20American%20megadrought&ved=2ahUKEwjM8teI5_LoAhVCZxoKHYFwCfgQMygAegUIARDjAQ
Sorry about the long link, but even the supplemental material seems to be behind the paywall. For some reason google see it, though.
The whole result is based on something really weird happening in the climate model. This study is totally bogus and should be retracted.
The Williams, et al research article that you apparently paid for is reference #2 of the Stahl perspective that Anthony references.
Quoting reference #2 from Stahl.
“A. P. Williams et al ., Science 368, 314 (2020). OpenUrl Abstract/FREE Full Text Google Scholar”
So, by clicking that Stahl #2 reference link would give you the Williams article in “Free Full text.”
No charges.
Climate models are poor at predicting temperature changes and miserable at predicting precipitation changes.
Historically, the annual precipitation in the contiguous 48 United States between 1895 and 2006, according to the U.S. National Climatic Data Center, U.S. Department of Commerce 2006 Climate Review, increased by 1.8 inches or ~6% during the 110 years. Year to year regional fluctuations are normal.
Anthony,
The Stahle essay is merely a alarmist perspective article on this study (below), also in the same issue of Science:
Open access:
https://science.sciencemag.org/content/368/6488/314
“Large contribution from anthropogenic warming to an emerging North American megadrought”
By authors: A. Park Williams1,*, Edward R. Cook1, Jason E. Smerdon1, Benjamin I. Cook1,2, John T. Abatzoglou3,4, Kasey Bolles1, Seung H. Baek1,5, Andrew M. Badger6,7,8, Ben Livneh6,9
The research paper of course comes out of those two leading junk climate science universities in the US — Columbia U, and UC-Boulder.
These fraudster snake-oil sellers use tree rings of course in their fraud. Tree rings can do anything. They can be thermometers accurate to better than 0.5 C while simultaneously being soil moisture monitors depending on the needs of these climate dowsers.
It is pretty much circular logic for them. In their research article they wrote:
“Here, we use 1,586 tree-ring chronologies to reconstruct 0- to 200-cm summer (June to August) soil moisture and snow water equivalent (hereinafter termed “soil moisture” collectively) anomalies on a 0.5° latitude-longitude grid back to 800 CE across western North America [(30); Fig. 1]. Soil-moisture anomalies are standardized relative to the entire 800–2018 CE period, and the magnitude of negative anomalies indicates drought severity. The soil-moisture record targeted in the reconstruction covers 1901–2018 and is referred to as Noah-calibrated soil moisture (31). Because true observations of soil moisture do not exist, this soil-moisture record is modeled based on observed climate. “
So they use 20th century to calibrate and then tree ring to discern climate and temperatures, then they use climate and temperature to use a model to guess soil-moisture. These guys are just doing nothing but smoke and mirrors.
Those authors pretty much violated what Richard Feynman said was the First Principle of Science:
“The first principle is that you must not fool yourself and you are the easiest person to fool.
– Richard P. Feynman
Not only do they fool themselves, they are making themselves into fools quite willingly for the climate hustle and their own self-serving rent-seeking.
It’s CU Boulder not UC Boulder.
Quoting exactly the listed author affiliations,
“6Cooperative Institute for Research in Environmental Sciences, University of Colorado Boulder, Boulder, CO 80302, USA.
7Universities Space Research Association, Columbia, MD 21046, USA.
8NASA Goddard Space Flight Center, Greenbelt, MD, USA 20771, USA.
9Civil, Environmental, and Architectural Engineering, University of Colorado Boulder, Boulder, CO 80309, USA.
Sizzr,
I know that people refer to it a CU to distinguish it from the Uof California system, but UC-Boulder is how it would come out from the above affiliation. When I write “UC-Boulder,” no one is going to think I’m referring to UC- Berkeley
Joel
You can use what you want, I’m just pointing out that you are going against the proper convention. The proper acronym is CU for the University of Colorado, Boulder, which I don’t think that people will confuse with UC-Berkeley.
The people that use “CU” includes the university itself. See the link below for example, “CU Boulder Today.”
https://www.colorado.edu/today/syndicate/article/read?unit=1179
Anthony Banton,
I did, in fact, read the full content of the article that you linked [Williams et al., Science 368, 314–318 (2020) 17 April 2020], and offer the following observations:
1) Direct quote from its Abstract: “We use hydrological modeling and new 1200-year tree-ring reconstructions of summer soil moisture to demonstrate that the 2000–2018 SWNA drought was the second driest 19-year period since 800 CE, exceeded only by a late-1500s megadrought.” This is fully consistent with what the above WUWT extract and article asserted was being claimed, and which I stated to be factually incorrect on two accounts.
2) Direct quote from its Abstract: “Anthropogenic trends in temperature, relative humidity, and precipitation estimated from 31 climate models account for 47% (model interquartiles of 35 to 105%) of the 2000–2018 drought
severity, pushing an otherwise moderate drought onto a trajectory comparable to the worst SWNA
megadroughts since 800 CE.” So, not mentioned in the above WUWT article is the fact that the severity of the 2000-2018 drought is PREDICTED to be on a TRAJECTORY “comparable to the worst SWNA megadroughts since 800 CE.” If there is nothing else that the IPCC has taught humanity, it is that today’s best climate models (well, perhaps with the singular exception of the Russian Academy of Sciences climate model) are worthless in making climate predictions.
3) Direct quote from its second paragraph: “Any attribution of recent drought to anthropogenic climate change must consider this region’s capacity for large internal hydroclimatic variability (16,17). Although 21st-century drought
conditions have been clearly promoted by natural Pacific Ocean variability (18–20), certain elements are also consistent with projected drying due to anthropogenic radiative forcing(21–23).” Note the authors’ sleight-of-hand trick here: they state “consistent with” (presumably as a CYA maneuver), yet then assert CERTAINTY in the article’s title (“. . . from anthropogenic warming . . .”).
4) Even though E.R Cook is listed as one of the co-authors, the article makes no attempt to reconcile his data that is the basis of the WUWT Figure 1 graph that I referenced with the cited claims in the Science article. Moreover, in the sixth paragraph there is this statement: “The regionally averaged SWNA reconstruction (Fig. 1C) reveals four megadroughts that satisfy this criterion in the late 800s, mid-1100s,1200s, and late 1500s.” And in the subsequent seventh paragraph there is this statement: “The most severe SWNA 19-year soil moisture anomaly during the late-1500s megadrought was −0.80 s in 1575–1593.” (redefining “multidecadal” to mean 19 years). These statements are, again, inconsistent with the claim that 2000-2018 is the second-worst multidecadal (drought) event in the last 1200 years.
5) From the second-to-last paragraph is this astonishingly revealing sentence: “Our relatively simple hydrological modeling approach also does not account for coupled land-atmosphere interactions or dynamic vegetation responses to climate.” Yet tree ring data is fundamental to the very basis of this article, as stated in its abstract (Item 1 above of this post).
I could go on and on with the failings of this Science-published article, but need I really? Have you, yourself, read it?
Now, you were saying something about answering to dog-whistles? . . . I think I hear the AGW camp calling you home.
In the year 2525… will man still be alive
“Well, it rained all night the day I left,
The weather, it was dry.
Sun so hot I froze to death!
Suzanna, don’t you cry.”
On the first part of the journey
I was looking at all the life
There were plants and birds and rocks and things
There was sand and hills and rings
The first thing I met was a fly with a buzz
And the sky with no clouds
The heat was hot and the ground was dry
But the air was full of sound
I’ve been through the desert on a horse with no name
It felt good to be out of the rain
In the desert you can remember your name
‘Cause there ain’t no one for to give you no pain
La, la
After two days in the desert sun
My skin began to turn red
After three days in the desert fun
I was looking at a river bed
And the story it told of a river that flowed
Made me sad to think it was dead
You see I’ve been through the desert on a horse with no name
It felt good to be out of the rain
In the desert you can remember your name
‘Cause there ain’t no one for to give you no pain
La, la
After nine days I let the horse run free
‘Cause the desert had turned to sea
There were plants and birds and rocks and things
there was sand and hills and rings
The ocean is a desert with it’s life underground
And a perfect disguise above
Under the cities lies a heart made of ground
But the humans will give no love
You see I’ve been through the desert on a horse with no name
It felt good to be out of the rain
In the desert you can remember your name
‘Cause there ain’t no one for to give you no pain
La, la
“….global warming is causing a new megadrought in the American Southwest.”
Translation: Summer is a-commin’ in.
https://www.wcc.nrcs.usda.gov/ftpref/states/co/snow/state/daily/co_update_snow.pdf
Lake Mead was at the highest level this year since 2014. It will never catch up to the growing needs for farm irrigation and populations in the desert sw. More people means less water.
I’ve just been through a drought here in inland Australia and a fire to cap it off. Is this the worst drought I’ve seen? No, I don’t think so. The one in the early eighties was pretty crook. The one earlier this century was similar.
Droughts happen all too frequently. However, high in the ivory towers of the megacities of the eastern Australian coastal fringe, far removed from having to live and farm through such extreme dry periods, there are plenty of publicity-seeking academic types who will happily announce that the next drought is the worst ever seen. It will be proof positive of a doomed future if we don’t change our ways.
People should change their ways, indeed. They should stop listening to these so-called experts. Their expertise, it seems, is but a figment of a fevered imagination. It is not the planet that is getting hotter, rather the desperation of some to be noticed and that of others to misuse this to political advantage.
The cult of the expert is now a mainstay of the radical left (and that’s almost all of the left, these days). Long ago, the radicals stormed the ivory towers, to assume the role of gate-keepers to knowledge, with a complicit media in tow. The real drought we face is one of scientific truth.
Here’s a good laugh…
Well we’ve had a bit of rain lately so it’s going to be a wet winter-
https://www.abc.net.au/news/2020-04-18/wet-winter-likely-amid-speculation-of-la-nina-negative-iod/12149510
Or something like that.
Yes, it is very funny to compare that linked graph to:
a) Figure 1 of the above WUWT article . . . whatever happened to the pre-2000, multidecadal droughts? . . . oh, that’s right, we should not expect models to accurately hindcast factual history, should we?
b) What is claimed in the Science article (the linked graph shows NOTHING unusual happening in “the late 800s, mid-1100s,1200s, and late 1500s.”)
c) the “severity” of the 2000-2018 drought being based on computer model predictions of a future TRAJECTORY that will, it is claimed, “push an otherwise moderate drought onto a trajectory comparable to the worst SWNA megadroughts since 800 CE”; whereas the linked graph is so bold as to actually plot the Summer Palmer Drought Severity Index out to year 2100 . . . and with, no less, predicted “noise” levels about the future trend line that are only 50% to 30% of the “noise” in the PDSI-RNET data plotted from 800 to about 1900 AD. Just laughable!
But, but, we nevah saw it comin’…
I have been in Tucson since the late 70’s and this is the latest I have had to wear my 1.5 suit to go into the pool because of the cooler temps. It has been wet and to prove that we have had some of the best wild flower displays in the last couple of years, this year in front of my house they lasted over 7 weeks. Please tell the morons to stop with the lies. On a side note I can tell the virus is coming to an end as Global warming is back in the news. That is the only time I would call that a good thing. Be safe and happy and bring back my sports, please…
I’m not at all sure where this guy gets the idea the SW is in a mega-drought. I live in the SW and sure hadn’t noticed it. Either has the state governments.
https://www.drought.gov/drought/states/arizona
With this link, you can get drought conditions. It just doesn’t look bad at all.
It’s raining in San Diego as I write this; and it has rained almost every day, sometimes torrential, for the past two weeks. Some megadrought.
lol
If “a picture tells a thousand words” then those first two diagrams surely tell two thousand words.
I’ve lived in Southern california for quite a while (over 50 years) and then climate here is basically wet winters and dry summers. The climate is also one of decade or more long dry periods separated by very wet years. These decade long periods vary quite a bit in both duration and precipitation. That’s one reason I think any claim that “climate” can be determined by a fifty year period is nonsense. Several hundred years is more like it for So. Cal.
Given all that, the previous drought is not significantly different than others I’ve seen here.