Catastrophic shock to US agriculture would deplete reserves, including those of other countries
Frontiers
The American Dust Bowl of the 1930s – captured by the novels of John Steinbeck – was an environmental and socio-economic disaster that worsened the Great Depression.
The Dust Bowl was an extreme event. But due to climate change, massive crop failures are more likely to happen again in the future. New research in Frontiers in Sustainable Food Systems aimed to answer what these impacts may look like.
The Dust Bowl was centered on the Great Plains of the USA, where decades of unsustainable deep plowing had displaced native, moisture-retaining grasses. An atypical La Niña then brought intense droughts, high temperatures, and strong winds which blew away the topsoil in the form of large-scale dust storms.
Apart from its direct impact on people (around 7,000 deaths and two million homeless), the Dust Bowl had a catastrophic effect on crops where wheat and maize production in the USA plummeted by 36% and 48% during the 1930s.
Currently, the Intergovernmental Panel on Climate Change predicts that in another three to four decades that most of the USA will have further warmed by 1.5-2 °C. This compounds issues that already exist today, where global food security is under pressure from the increased frequency of extreme weather events.
“We wanted to forecast how a multi-year production decline in a major exporting country, similar to that which occurred during the Dust Bowl, would affect modern food supplies globally via international trade,” says first author Dr Alison Heslin, a postdoctoral researcher at the Center for Climate Systems Research of Columbia University and NASA’s Goddard Institute for Space Studies.
“In today’s system of global food trade, disruptions are not bound by borders. Shocks to production are expected to affect trade partners who depend on imports for their domestic food supply.”
To assess the possible impacts of a second dust bowl, the authors first developed two alternative computer simulations of the worldwide trade in wheat. They then delivered a shock to these model systems in the form of a four-year-long Dust Bowl-like anomaly, restricted to the USA.
Under one simulation, countries first use their reserves and then divide the absorbed shock between imports and exports, propagating it in one direction by increasing imports and in another by decreasing exports.
Under the more complicated second model, the USA first reduces only its exports, propagating the shock to all receiving trade partners, after which all countries with a shortage respond by increasing their imports.
Their results predict a severity similar to that of the original event, estimated from historical data. The results show that the USA would fully exhaust 94% of its reserves over the first four years of a Dust Bowl-liked agricultural shock.
They also show that without exception, all countries to which the USA exports wheat would decrease their reserves, even though they didn’t themselves suffer crop failure.
“We focused on a subset of the possible impacts, specifically changes in trade, drawing down strategic reserves and decreases in consumption,” says co-author Dr Jessica Gephart, Assistant Professor at the Department of Environmental Science of the American University in Washington DC.
“We found that global wheat trade contracts and shifts toward other wheat exporters, and that wheat reserves around the world decline, in many cases to zero. This suggests that the impacts would not only raise prices for US consumers but would also raise prices far beyond the US borders,” says Gephart.
Key impacts of another four-year dust bowl could include an initial 31% loss of global wheat stocks, and by the end of the four years, between 36-52 countries could have used up over 75% of their starting reserves. The 10 countries with the highest initial reserves (China, USA, India, Iran, Canada, Russia, Morocco, Australia, Egypt, Algeria) would see their reserves decline by 15-22 % relative to the starting points.
However, a silver lining is that due to the high initial starting point of global reserves, most supply shocks, even in countries without reserves, could be addressed through trade flow adjustments without reducing consumption.
“Our results remind us that mitigating climate risks requires accounting for not only the direct effects of climate change, like local extreme weather events, but also the climate impacts which travel through our interconnected system of global trade.”
“In the context of food security, we show that accessing food reserves can, for a time, buffer populations from trade-induced supply shortages but as reserves deplete, people are at risk of food shortages,” says Heslin.
###
Notes to Editors
Please link to the original research article in your reporting: https://www.frontiersin.org/articles/10.3389/fsufs.2020.00026/full
There is a book called “The Worst Hard Time” by Timothy Egan about the dust bowl. VERY informative.
Right now it is free on Amazon if you are a prime member. What a steal.
The dust bowl was a direct result of US policy in WW I. Russia before the war was a major exporter of wheat to Western Europe. When war broke out, Western Europe faced starvation. Most people don’t know that Western Europe cannot feed itself, then or now. (The German decision to invade Russia in WW II was in part based on this reality. Western Europe could no longer import food by sea because of the British blockade.) Wilson decided that America would take up the slack, and offered guaranteed prices for wheat. This lead to a boom in production, with speculators buying up land, plowing the sod under, and growing wheat. They made a lot of money. Then, the war ended, the heat and drought came, and the price guarantees ended. The speculators left the land, which was abandoned to the elements. No ground cover planted. Washington D.C didn’t really get excited until dust storms from the Great Plains reached D.C. and dimmed the sun.
Also note that Russia, while under the Bolsheviks, had about 60 years of bad weather, and never was a major exporter of wheat during their rule. Talk about climate change impacting food production.
If anyone wants to see an example of NOAA data inconsistent with their rhetoric go to the NOAA site below. Set the period for 1900 to the present, select July and set for “Maximum Temperature Anomalies”. You will see the high temperatures were higher in the 1930’s than recently.
Then set for “Minimum Temperature Anomalies” and the lows are much lower in the 1930’s than present. This is a very clear representation on how urbanization effects night time lows, thus artificially creating higher average temperatures.
In the early 1930’s, CO2 concentrations had increased by ~30ppm over pre-industrial levels. Today they are ~135ppm higher. Why then did we have higher high temperatures if it’s all bout CO2?
It is this distorted average temperature record that is used as a basis for computer models. Is it any wonder they are so far off from empirical satellite measurements.
https://www.ncdc.noaa.gov/temp-and-precip/national-temperature-index/time-series?datasets%5B%5D=uscrn&datasets%5B%5D=climdiv&datasets%5B%5D=cmbushcn¶meter=anom-tmin&time_scale=3mo&begyear=1900&endyear=2020&month=7
“In the early 1930’s, CO2 concentrations had increased by ~30ppm over pre-industrial levels. Today they are ~135ppm higher. Why then did we have higher high temperatures if it’s all bout CO2?”
Good question. The answer is it is not all about CO2. It was just as warm in the 1930’s as it is today, yet the CO2 content of the atmosphere has increased. So we have a CO2 increase, but no temperature increase since the 1930’s.
CO2 seems to be tagging along for the ride, instead of being behind the wheel.
Btw, those “temperatures” in that link you provide are bastardized versions of the real temperatures.
If you want the real temperatures, you have to look at a Tmax chart that has not been modified. If it says “anomaly”, it’s been modified. What you want is the so-called “raw” data. The “raw” data is the actual temperature reading. I suppose the computer data manipulators call it “raw” to give the impression that somehow the “raw” data needs to be improved by their computers.
The Data Manipulators “improvements” lead to the bogus, bastadized, fraudulent Modern-era Hockey Stick global surface temperature chart, which leads to all the insanity that makes up modern, alarmist climate science.
Without this fake Hockey Stick temperature profile, the promoters of CAGW (Catastrophic Anthropogenic Global Warming) would have nothing to point to as “evidence”. It’s all they have, and it’s all a Big Lie.
All the unmodified Tmax charts from around the world show the same temperature profile,i.e., that it was just as warm in the Early Twentieth Century as it is today.
None of the unmodified Tmax charts from around the world resemble the bogus, fraudulent Hockey Stick chart. The fraudulent Hockey Stick chart is the only thing purporting to show a correlation between CO2 and temperature increases. Throw away the Hockey Stick and there is no CAGW crisis.
Fully aware that I was using their “bastardized” data, but the fact that the average high temperatures in the 1930’s are higher than any in the last decade, even using the homogenized data, just reinforces how obvious the UHI effect is distorting temperature records.
Last time I heard, they had gone through 13 homogenizing exercises. A few more iterations and we can wipe the Dust Bowl from our historical records.
What’s even worse than their data manipulation is that much of NASA/NOAA dialog is opinion and presumptive claims that they don’t link to data. Debate someone with data and they will quote NASA/NOAA rhetoric and question how you would ever consider challenging the men that got us to the moon.
I just wish that Congress or this Administration would require more rigorous quality standards to these agencies analytical practices and prevent them from presenting science and information from other sources that did not work to these rigorous standards (e.g. the secret science of Mr. Mann, the “97% of scientist” quotes, or much of the IPCC’s assessments).
Michael Mann has regularly informed us that temperatures today are higher than in the 1930’s. Why are we not seeing a Dust Bowl at the moment?
Because Michael Mann is not telling us the facts.
I live in part of the former Dust Bowl and our weather couldn’t be nicer. If this is CAGW, give me more of it!
There is no comparison between now and the Dust Bowl of the 1930’s. Not even close. In fact, there is no comparison between the severe weather we had in the 1950’s and today’s weather.
Today’s weather is a blessing for this area. If anything we are getting too much moisture over the last couple of years, but living in Oklahoma, it is hard to say we are ever getting too much mositure. 🙂 We are usually drought-prone.
no till /ground till are a lot different then older plow type farming.
no ground cover left created the dust bowl.
farmers today don’t dig a hole and drop a seed but practice efficient water/irrigation usage as well as sustainable ground prep.
they do this to allow continuing use of the resources.
Roundup-Ready GMO crops help. They enable weed control without tilling.
Of course, the same people who pretend to be environmentally sensitive do their best to bring back the dust bowl, by refusing to eat GMO food, just like they do their best to “brown” the Earth by restricting CO2 emissions.
From “1930s Dust Bowl: Government Policy + Climate + Farming Methods:”
“Lofty ideals ran aground upon the climatic realities of the arid region west of the 100th meridian where precipitation was too little and too inconsistent to support traditional farming, especially on plots as small as 160 acres. Although this had been understood at least since 1878, larger homesteads—John Wesley Powell proposed homesteading units of 2,560 acres (4 square miles)—were less politically beneficial because fewer people would have settled in the region to be represented in Congress; large homesteads were counter to the free land reformist view that small farms would serve as an antidote to land control by large interests.
“Ultimately, 160 acres proved simply too small to be a viable farm in this more arid (or semiarid) region, especially considering that the Homestead Act did not help poor people raise the capital necessary to survive, let alone succeed. ”
https://agfax.com/2019/10/25/1930s-dust-bowl-combination-of-gov-policy-climate-farming-methods/
Had the weather and climatic conditions not been very hot and dry for a decade, would there have been a dust bowl? Timothy Egan’s book makes many very good points but to concluded that the dust bowl was a direct result of government policies is a stretch. Yes, government policies made things drastically much worse. If sound government polices are not made there will undoubtedly be catastrophic consequences, likely much greater than anything we have ever experienced, regardless of the weather conditions.
Over here in the United States, we tend to associate droughts with warm periods, but that’s a local prejudice.
1. In part, we tend to think that because of the local seasonal correlation: in much of the USA, droughts occur mostly during summertime. However, in much of the rest of the world, including India, Bangladesh, and the Sahel, summertime is monsoon season, and it’s winters which are dry.
2. We also tend to associate droughts with warm periods because on the American Great Plains the 1930s warm period coincided with the Dust Bowl (drought). However, in general, globally, droughts are not positively correlated with warm periods. In fact, during the Roman Warm Period two millennia ago, arid North Africa was the breadbasket of the Roman Empire.
The one indisputable drought-related impact of manmade climate change is very positive: higher CO2 levels help mitigate damage to plants by droughts.
Overall, the increase in atmospheric CO2 level from just under 0.03% (at the beginning of the 20th century) to just over 0.04% (now) has increased crop yields by an average of about 20%, by “CO2 fertilization.” That’s one of the factors which have helped eliminate major famines. But higher CO2 levels are even more beneficial when crops are under drought stress, because elevated CO2 makes plants more water-efficient and drought-resilient, by improving stomatal conductance relative to transpiration. That’s especially important for preventing famine, because droughts used to be a major cause of catastrophic famines. In fact, the global drought & famine of 1876-78 killed about 3.7% of world population; for comparison, WWII killed about 2.7% of world population, and the 1918 flu pandemic killed about 2% of world population.
Refs: Donohue, et al, 2014, Chun, et al, 2010, Fitzgerald, et al, 2016, https://sealevel.info/learnmore.html#droughts and many others.
Pictures: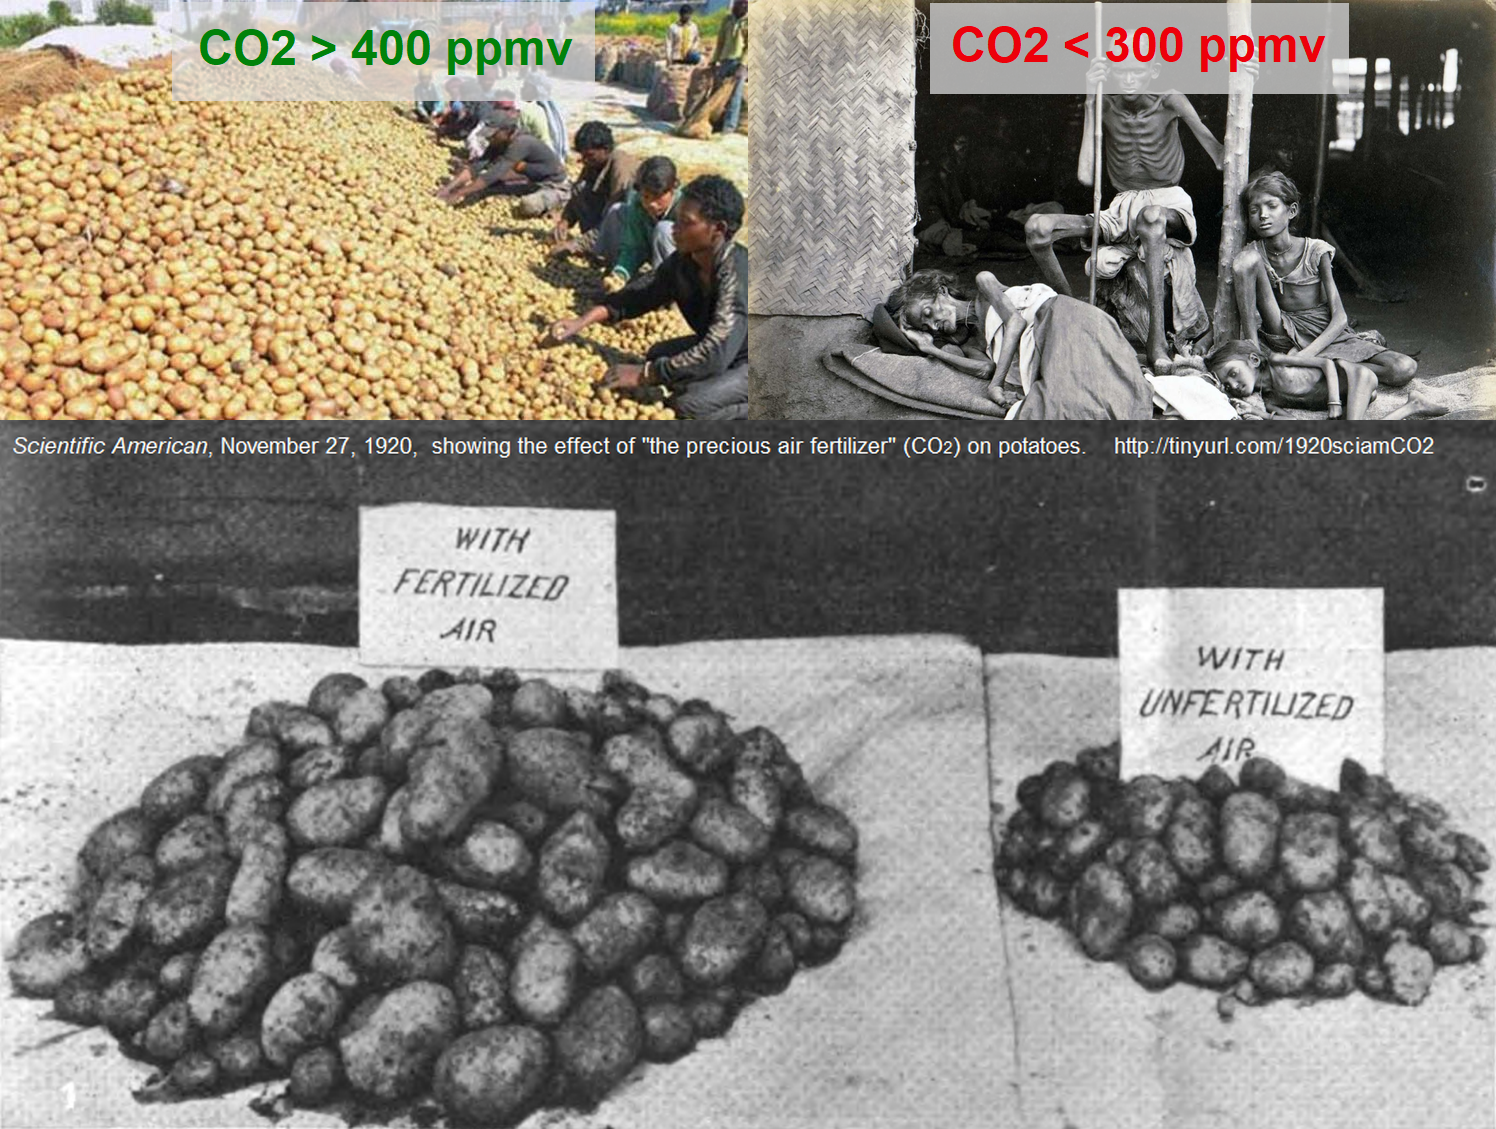
As CO2 levels have risen, global drought incidence and severity have not increased. If anything, they’ve decreased very slightly.
Graphs: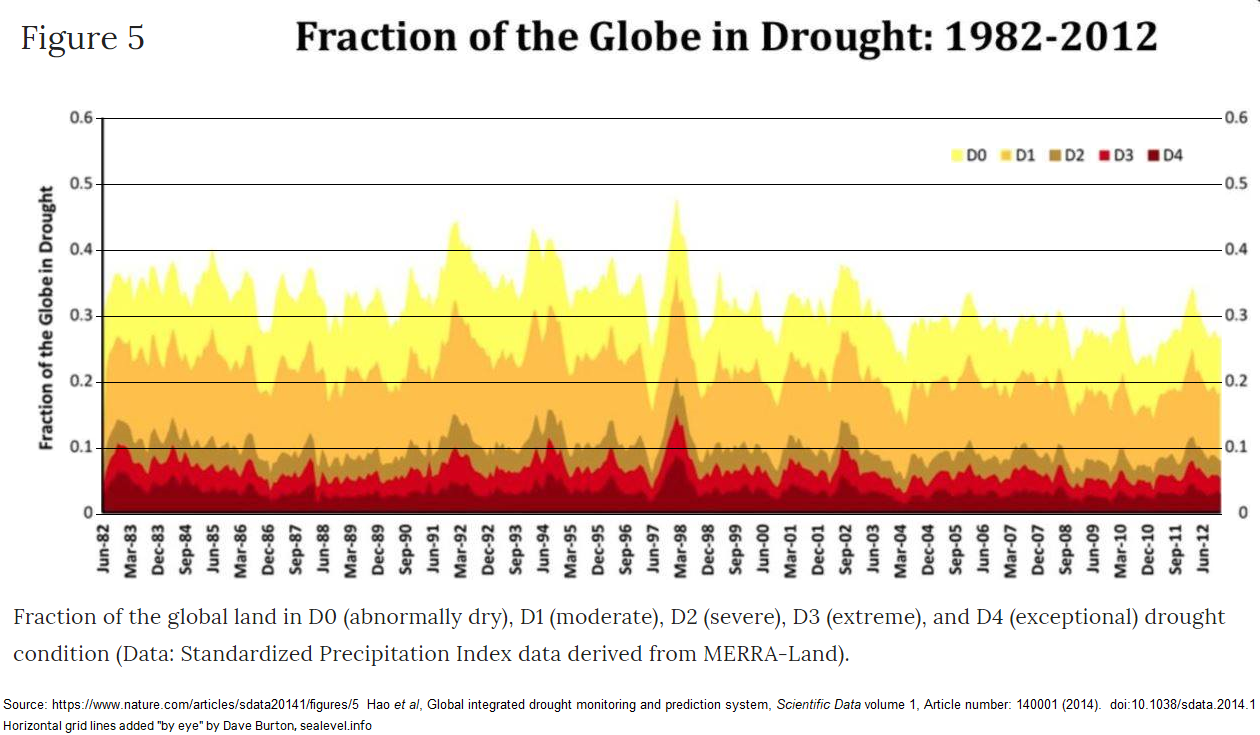 and
and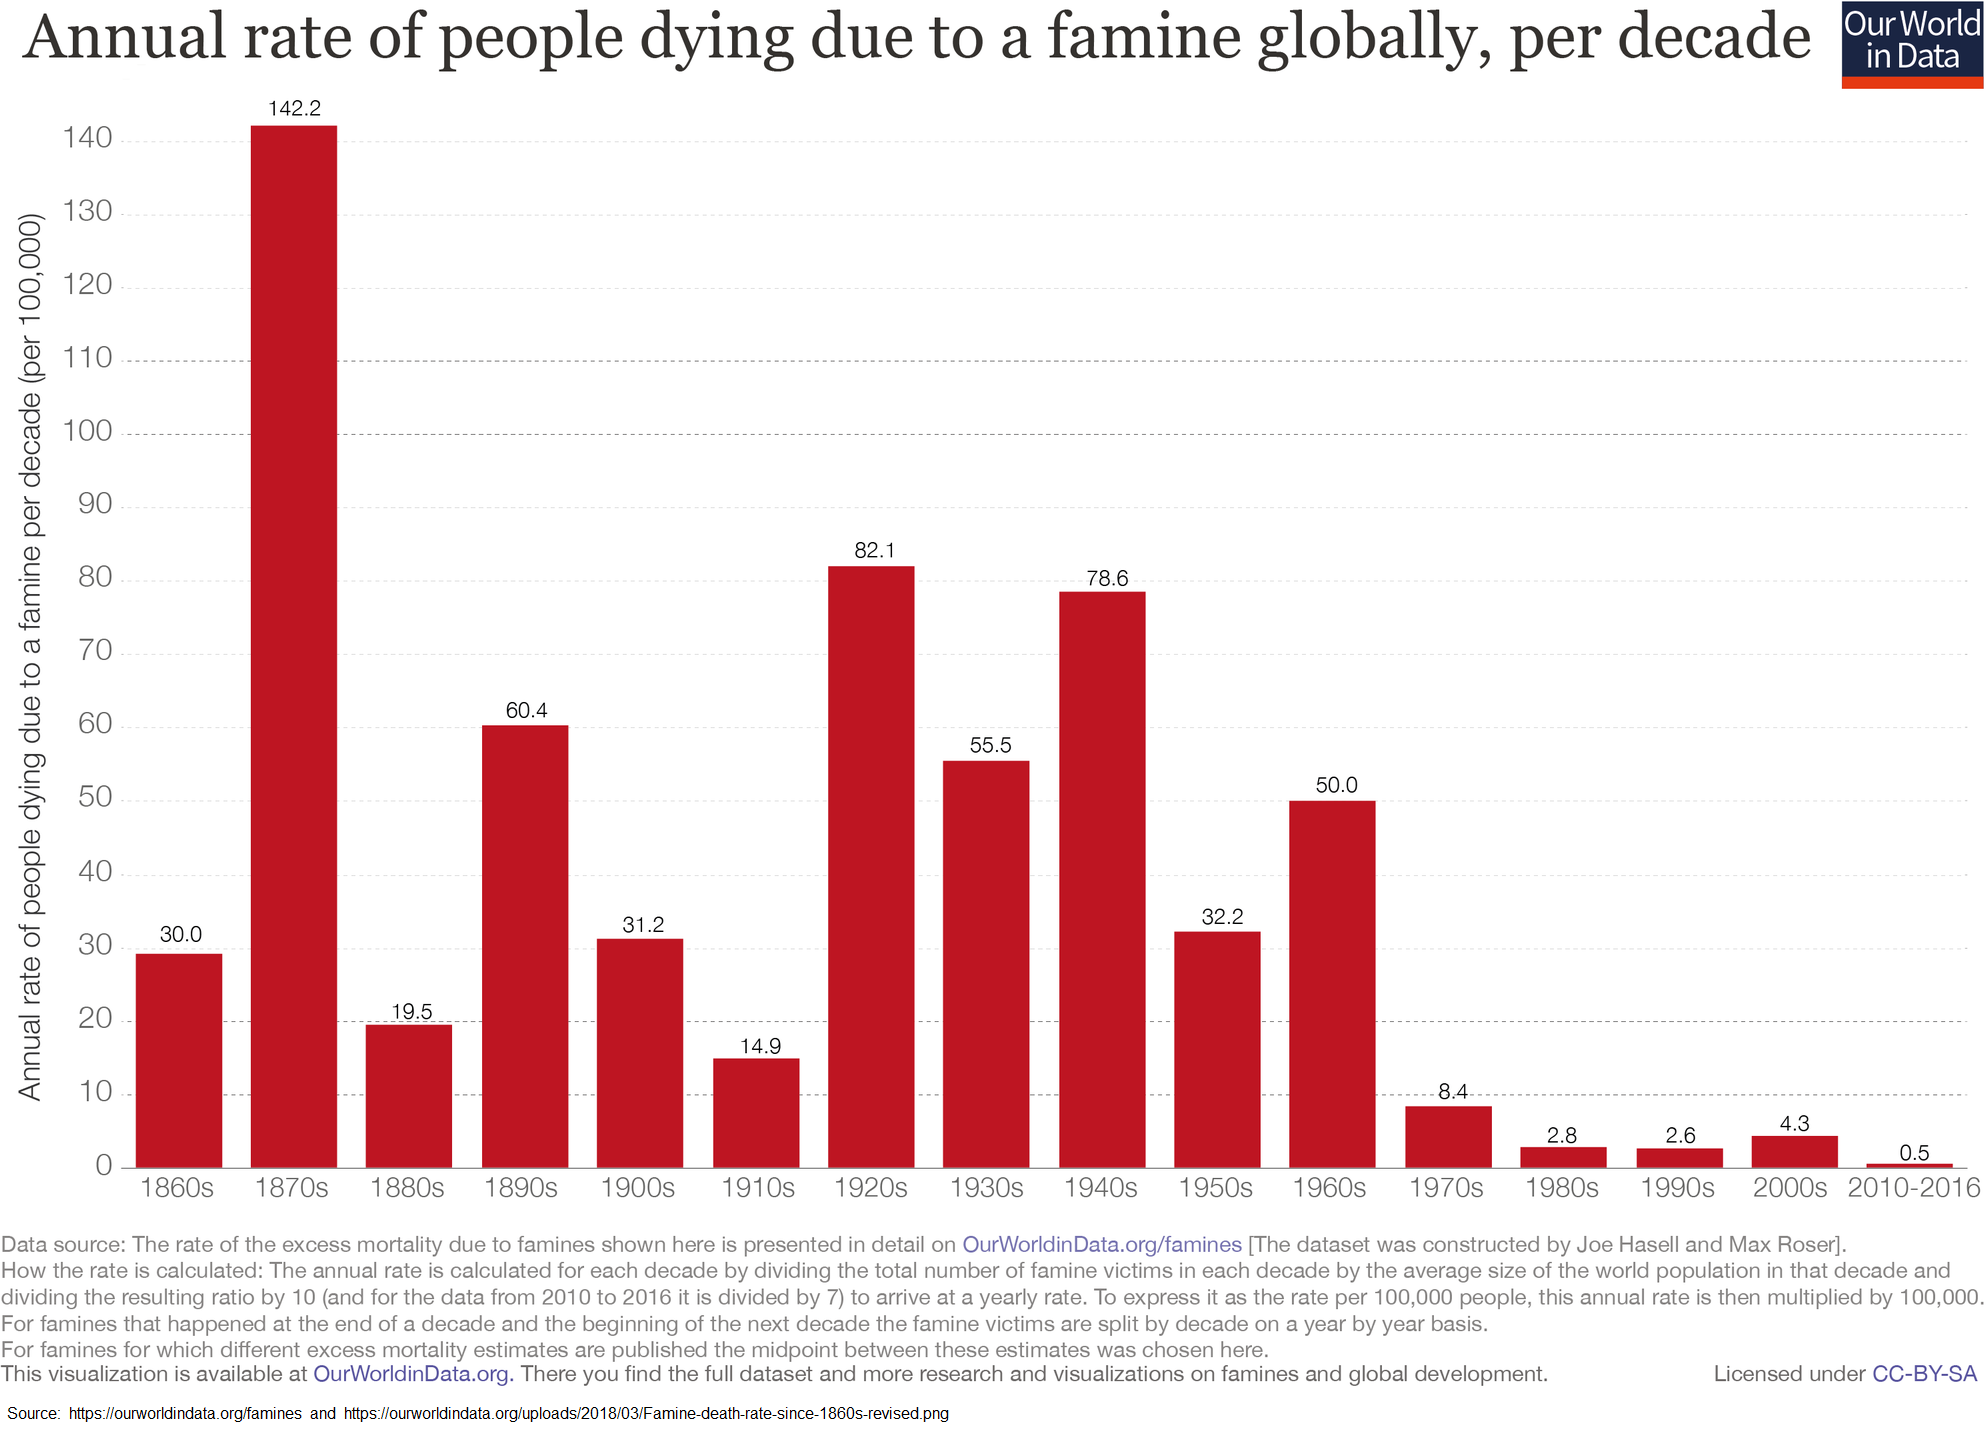
NASA Video: https://www.youtube.com/watch?v=zOwHT8yS1XI
Thanks for sharing this impressive information. I find it difficult to understand why would we want try and manage the climate when there is no empirical evidence of the possibility. However, we do have technology and capability to manage many other things necessary for human survival. Changing human behavior may be one the greatest opportunities. Just in America alone we waste enough food to feed another population of our size.
EurekA! The evolution of a novel social contagion, which can be mitigated through social distancing.
This is when I stopped reading. There is NO trend indicated in the data that supports this statement, AIUI, laying a trend line on the data produces a line that appears to slope downward, not upward, but that slope is not statistically significant. And not only are we not seeing such a trend in the current data, there is no proof or support for such a trend in the future, even if the world warms that 1.5-2.0°C the article’s author carelessly threw out there! Which brings up another issue, the IPCC only predicts a 1.5-2.0°C rise from preindustrial levels hinting that the baseline is a level not seen since 1850, and the world has already warmed 1.0°C from there, further warming should be only 0.5°C from there. But I digress. So while the headline statement may be correct, given the egregious errors in their background assumptions, I have no faith in the results of their “study”. Which likely relies entirely upon computer models again (did anybody make it that far?), continuing the horrendous trend in science of taking the output of a dodgy computer model and using that as input “data” for another dodgy computer model. That ain’t science.
Agricultural practices since the 1930s have advanced more than in the previous 10,000 years. This article starts with a false conclusion and spirals in from there:
> But due to climate change, massive crop failures are more likely to happen again in the future.
Absolutely flies in the face of crop yield data.

Another 1.5 degrees in three decades? When it took 150 years to go 1.5 degrees?
Sure. Ok.