By Christopher Monckton of Brenchley
Much has been made of the alleged standstill in global CO2 emissions, which are asserted to have been about the same in 2019 as in 2018, at 33.3 gigatonnes of CO2:

Obsession over transient phenomena such as this is commonplace among the climate genociders, whose cruel, dangerous and expensive global-warming abatement policies are killing tens of millions annually through the coordinated refusal of most of the world’s leading merchant, central and intergovernmental banks to lend to developing countries to install the one kind of electricity they can afford and can maintain and are desperate for – coal-fired generation.
Nothing lifts a poor nation faster, more surely and more permanently out of poverty, misery, disease and death than the universal availability of universal, affordable, continuous, base-load, coal-fired electricity.
Were it not for the genocidal emissions-abatement policies driven by the totalitarian fanatics and extremists of the far Left in the West, the whole world would by now be electrified, prosperity in the developing countries would have increased no less dramatically than it has in the electrified advanced economies, and the net benefit to the environment in the consequent stabilization of population would have been overwhelming.
Almost two centuries of official demographic statistics have demonstrated that, by a long chalk, the most effective method of stabilizing a previously-burgeoning population is to increase the general prosperity of that population. Frankly, nothing else works. The fastest way to displace poverty with prosperity is to give the people electricity. We should make this moral case against the genociders daily until they are compelled to pay heed.
The genociders’ trumpeting of the supposed standstill in global CO2 emissions is – as usual – misplaced. As the IEA’s graph shows, the imagined level of global emissions remained static for five years from 1990-1995. In Their terms, we were doing “better” then than now, for no increase in our sins of emission was reported over that period.
Their “our policies are at last working” meme is misplaced for a second reason. The emissions data are inaccurate. As with temperature, so with emissions, we are incapable of determining global data to a precision of a tenth of a unit. We know that the emissions data are inaccurate because if they were accurate – and if the link between emissions and concentration were as direct as They tell us it is – then the stabilization of emissions would have been matched by at least some diminution in the rate at which CO2 concentration is accumulating in the atmosphere.
However, the CO2 concentration at Mauna Loa shows a continuing and undiminished rate of increase over the past four or five years:

Since the trend in global temperatures has been generally downward over the past five years, additional outgassing of CO2 from the oceans does not account for the continuing increase in CO2 concentration.
Nor can it legitimately be argued (though some genociders have tried) that the terrestrial CO2 sink is failing. If it were failing, the rapid growth in the total plant biomass on the planet – the net primary productivity of trees and plants – would not have been as spectacular as it has been.
The question arises whether the decades of hot air generated by the climate genociders’ intergovernmental conferences, at vast expense in treasure as well as in common sense, have reduced global CO2 emissions below the business-as-usual prediction made by IPCC in its First Assessment Report in 1990.
The answer is No. The annual, official, peer-reviewed estimate of global CO2 emissions from all sources, Friedlingstein et al. (2019), who used the same wider measure of emissions as IPCC, shows that emissions are above the business-as-usual trajectory predicted by IPCC in 1990:

The 11.5 givatonnes of carbon estimated by Friedlingstein et al. is equivalent to 42.2 gigatonnes of CO2.
In short, the quintupling of electricity prices compared with what they would be without global warming abatement policies, the doubling of gasoline prices, the destruction of heavy industries such as coal, steel, aluminum, coal-fired power generation and motor manufacture throughout the Western world, the trashing of the countryside and the killing of billions of bees, birds and bats by windmills, the slowing of storms and the consequent flooding caused by those same windmills, and all the deaths that the genociders are inflicting upon our less fortunate cousins in the developing world with their refusal to countenance the immediate electrification of the one-sixth of the planet whose population subsists in enforced and involuntary darkness, have achieved precisely nothing.
I wonder if perhaps anyone here can help me. Perhaps even the good Lord himself is willing to humble himself and have a go at it.
I think I can narrow down the problem with ‘CO2 emission” to a single mathematical problem by carefully analyzing the infra-red absorption spectrum of CO2.
By my account, the theory of heat entrapment by CO2 is based on the fact that LW radiation is sent back to earth, especially the radiation around 14-15 um. After absorption, the molecule back-radiates, (also called re-radiation) and assuming the molecule is like a perfect sphere, it radiates 62.5% in the direction where the original light came from. The other 37,5% goes in all other directions. [this is the physics of spherical mirroring and it is my assumption that this really forms the basis for the whole GH concept theory; note that there is only ca. 0,8% GH gas in the atmosphere and the rest of the gases are mostly all penetrable by all kind of radiation, including the re-radiation of the GH gases]
Here is the spectrum of CO2.
https://documentcloud.adobe.com/link/track?uri=urn:aaid:scds:US:e0a7125a-739a-4988-a789-78af79792fba
[Unfortunately, it appeared now also to me that the above spectrum is not exactly on scale. We need to get something better to start with, I think…..but that should not be a big problem.]
Anyway, looking at the spectrum, you must be drawn to the fact that there is also absorption in the area where the sun emits, 0-5 um. You can see that this also causes back radiation by studying this report, here, http://w.astro.berkeley.edu/~kalas/disksite/library/turnbull06a.pdf
Note the green line Fig 6 bottom. That radiation went: Sun => Earth {CO2] => Moon = Earth. (comes back in Fig 7)
Even in the abstract of the report, it is mentioned that the absorption and subsequent re-radiation at ca. 2 um of CO2 in the near infra-red is recognized as a strong sign for life (on a planet). Obviously the absorption of CO2 in the sun’s spectrum, and subsequent back radiation [mostly to space] also means that [more] CO2 in the air, also has [more] cooling effect.
Apart from the absorption of CO2 around the 2um wavelength, there is also the strong absorption (=reduction of transmittance) of CO2 at around 4.3 um. Now, I know there are some people claiming that earth also radiates 4 um, but I dispute this. I think the earth is not really a blackbody and therefore you have to be discrete about the areas where earth radiates, namely 7-50um, and where the sun radiates, namely 0-5 um.
I think you know now where I am heading with this. I am saying that the cooling caused by the CO2 by re-radiating sunshine could be as big or bigger than the warming caused by the re-radiation by CO2 of the earth shine. At this stage we should acknowledge that the earth shines 24 hours a day and the sun only shines 12 hours per day, on average on each area of earth, per year. That means a factor 2 i.e. dividing the sun (0-5um) result by 2. Not a factor 4. This is important. We are not looking here at energy per surface area. We are interested in looking at energy per um (wavelength). With this calculator: see broken link below, if you scroll down, you can calculate the quantum energy in eV that is related to each wavelength:
h ttp://hyperphysics.phy-astr.gsu.edu/hbase/wien.html
You just fill in the exact wavelength and this then spits out the quantum energy in eV. Apparently, there is a formula for this.
The mathematical challenge is now to carefully analyze the spectrum of CO2 and integrate the surface areas of the absorptions – I think it has be done line by line – as the eV changes per wavelength, i.e. um – and to quantify the energy caused by the reduction in transmission (back radiation) of earth shine 7-50um (mainly 14-20um) and then quantify the reduction in transmission (back radiation) of sunshine (mainly around 2 and around 4.3 um).
I hope you understand. If anything is not clear, you can always come back to me and we can correspond again. I have no other interest, except to try and free people from their feeling of guilt when getting behind the wheel. No sinning when emitting!!!
In the meantime, I shall see if I can get a proper CO2 spectrum that is exactly on scale, preferably in um or nanometer. There are even a few absorptions of CO2 in the UV – this is how we can identify and measure it on other planets – but I think it is not even necessary to bring that in as well, at this stage.
Let me know if anyone of you here think you understand the problem and if you can help solve it?
Interesting thoughts professor are you
“I think I can narrow down the problem with ‘CO2 emission” to a single mathematical problem by carefully analyzing the infra-red absorption spectrum of CO2.”
…Refractive index and so Co2 is 1.00045, water is 1.333
” […]0,8% GH gas in the atmosphere […]”
…I presume you mean total greenhouse gases, clouds included?
Henry Pool – re “ the cooling caused by the CO2 by re-radiating sunshine could be as big or bigger than the warming caused by the re-radiation by CO2 of the earth shine“: I don’t think that is correct. I’m working on other things at the moment, so, with apologies, I will have to leave it to you to check this out …
Incoming sunshine is mostly short-wave (SW). Outgoing earthshine is all long-wave (LW). CO2 intercepts principally LW. Consequently, CO2 does little to reduce incoming radiation, ie. it does little to cool, but by turning back some of the outgoing radiation it does act to provide some warming. CO2 is a very small part of Earth’s atmosphere, so that last statement needs to be interpreted in that context – ie. that the described effect is on a scale that relates to CO2 concentration.
There are other related issues, but I think that the above is the main one – or at least that it is the main one on modest time scales.
PS. re my: “CO2 intercepts principally LW”. The two shorter-wave bands in the link you gave on CO2 absorption are I think outside the main body of solar radiation, which is mostly much shorter-wave than that, so intercepting them would have little effect. Please correct me if I am wrong.
It appears you did not read the report on earthshine that I quoted. The emits – 0-5 um. CO2 has reduction in transmittance at both 2/and 4 um.
The sum emits 0-5….
Sorry Mike. I have a new phone with smaller screen. Have to get used to that. No the sun emits 0-5 um and in the 2um and the 4 um band. The CO2 absorbs in these areas. That causes reduction in transmittance. That re-radiation goes back to space. Hence we can pick it up on earth again via the moon. Read the Berkeley report on earth shine that I quoted.
Henry Pool February 19, 2020 at 10:34 am
After absorption, the molecule back-radiates, (also called re-radiation) and assuming the molecule is like a perfect sphere, it radiates 62.5% in the direction where the original light came from. The other 37,5% goes in all other directions. [this is the physics of spherical mirroring and it is my assumption that this really forms the basis for the whole GH concept theory;
Not correct.
The CO2 molecule absorbs an IR photon which excites its internal rotations and vibrations, it takes of the order of millisecs to re-radiate the energy. In the meantime the molecule endures of the order of millions of collisions and many vibrations and rotations, so if the molecule does re-radiate the direction in which it does so is random compared to where the photon originated from. Consequently it’s half up and half down.
Phil.
I disagree with.you. I told you before. Go back to the lab. Do a test to measure something in the visible with a spectrophotometer. Lift the lid off the cuvette holder and take a peak inside to check exactly what happens when you turn the wavelength to the spot where you must measure your component. Tell me what you see happening.
Henry we’re not talking about the visible range of liquid spectroscopy which is due to electronic excitation but IR spectroscopy of gases which is due to vibrational/rotational excitation which is subject to completely different physical chemistry. If you want a more relevant experiment take an IR pulsed laser, tune it to the absorption band of CO2, and install detectors in back, side and forward scatter configurations. With a delay of about 5ns to avoid elastic scattered light monitor emissions in all directions.
By the way a good source for the CO2 spectra which you were asking for is spectracalc.com
Phil.
now you say
the visible range of liquid spectroscopy which is due to electronic excitation but IR spectroscopy of gases which is due to vibrational/rotational excitation which is subject to completely different physical chemistry
Phil, again, we seem to disagree, as usual. Clearly, I can show you by many examples, that the re-radiation is caused by a mirroring effect whereby, if we assume that the molecule is like a sphere, and behaves like a sphere, 62.5% goes into the direction of the original source. That is real old fashioned physics that everyone has forgotten. About all types of mirrors.
It is the same when you put your brights on in misty, humid conditions: the light comes straight back at you….62.5 %…..at least. Because the other 37.5 goes in all other directions.
Anyway, taking the discussion into another direction, Look at these graphs:
http://www.woodfortrees.org/plot/hadsst3gl/from:1964/plot/hadsst3nh/from:1964/plot/hadsst3sh/from:1964/plot/hadsst3gl/from:1964/trend
note the increase in T of the NH waters….any ideas why NH is warming up faster?
I think that is most probably is due to 1) shift in the inner core of earth, NNE, re-aligning itself with that of the sun and 2) increase in sun hours as predicted on the higher latitudes, (click on my name to read that report). Nothing to do with CO2.
Many thanks for the tip on spectracalc. but it seems I dont get in there without paying. If you [or anyone] have access, can you get the actual data for me for the absorbance / transmittance of CO2 1-20 um [probably obtained using FTIR]? That would be great.
Henry Pool February 21, 2020 at 8:29 am
Phil, again, we seem to disagree, as usual. Clearly, I can show you by many examples, that the re-radiation is caused by a mirroring effect whereby, if we assume that the molecule is like a sphere, and behaves like a sphere, 62.5% goes into the direction of the original source. That is real old fashioned physics that everyone has forgotten. About all types of mirrors.
No the old fashioned physics is due to Rayleigh and isn’t forgotten. For molecules smaller than the wavelength of the light (certainly true for CO2 and IR) the back scatter equals the forward scatter in elastic scattering, however that isn’t followed if the molecule absorbs the light which is the case at 15micron.
It is the same when you put your brights on in misty, humid conditions: the light comes straight back at you….62.5 %…..at least. Because the other 37.5 goes in all other directions.
In that case you’re talking about elastic scattering by water particles where the particle size is greater than the wavelength so Mie scattering applies, in which case back scatter exceeds forward scatter but there’s no fixed percentage as it depends on size and wavelength. Not relevant to molecules.
Great stuff Christopher, thanks!
Life on this greening planet is not celebrating the plateau in CO2 emissions.
https://www.marketforum.com/forum/topic/47705/
“GLOBAL WARMING has been “ironically” set back by more carbon dioxide (CO2) in the atmosphere, NASA scientists have astonishingly claimed.”
Astonishing……………because it took them so long to re-discover the law of photosynthesis:
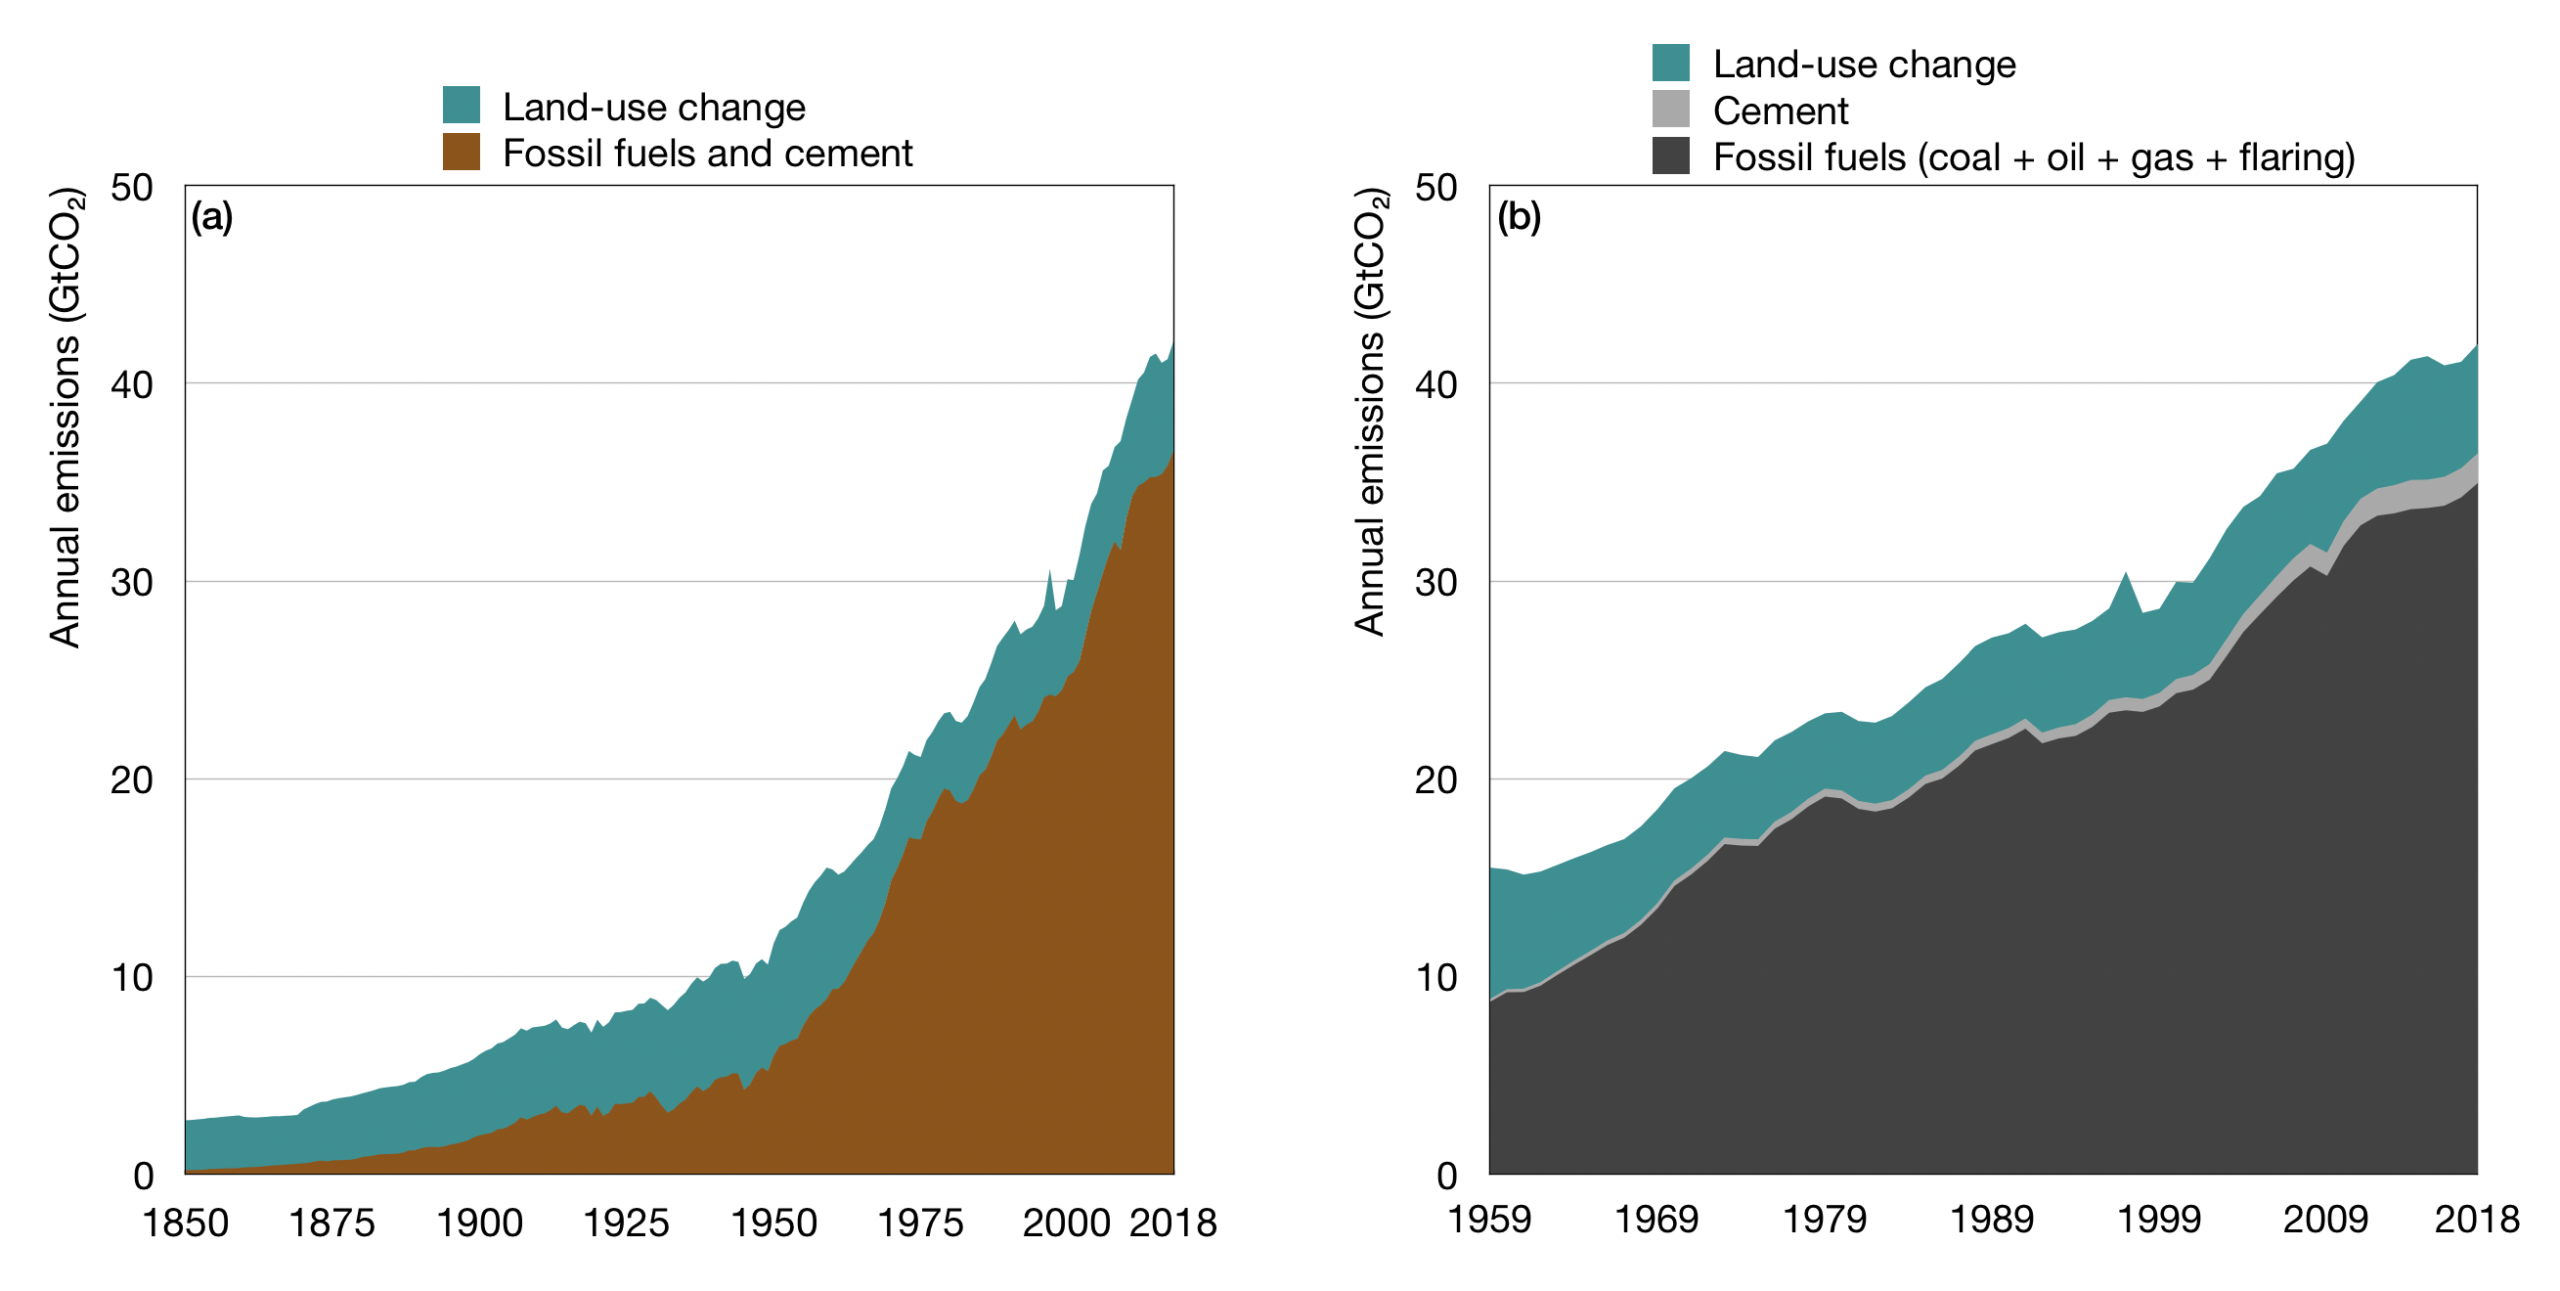
The first graph presented by Lord Monckton shows that CO2 emissions by “advanced economies” have declined slightly since 2000 (from about 12 GT/yr to 11 GT/yr), while those of the “rest of the world” have doubled from about 11 GT/yr to 22 GT/yr.
While it is not clear which countries are included in “advanced economies”, the slight decline in emissions, despite the increasing energy consumption in “advanced economies” may be due to switching from coal to natural gas for electricity generation, and better efficiency of engines in cars and trucks.
But if reduction in CO2 emissions is a worldwide goal, trying to force “advanced” countries like the USA and Europe to give up fossil fuels is a fool’s errand, while the rest of the world doubles its emissions, and their emissions increase is 11 times the decrease in emissions from “advanced economies”.
It is not clear why Fredlingstein’s 2019 estimate of 11.5 GT/yr carbon (equivalent to 42.2 GT/yr CO2) is so much higher than the IEA’s estimate of 33.5 GT/yr CO2. While it may be difficult to measure global CO2 emissions from all sources, when many small sources may not be known to governmental or international agencies, a 26% discrepancy is hard to explain. Which, between Fredlingstein and the IEA, are fudging the data?
If the IEA’s estimate of 33.5 GT/yr CO2 (equivalent to 9.14 GT/yr carbon) is used, then the 2018 emissions are slightly below the “business as usual” scenario (about 10.3 GT/yr carbon, as closely as can be read from the graph).
In order to link CO2 emissions to increases in CO2 concentration in the air, a mass balance on the atmosphere is needed. Assuming that the earth is a sphere with a radius of 6,378 km, the surface area of the earth is 4 * pi * [6.378E+6]^2 = 5.11E+14 m^2 (where E means 10 raised to the power of the number following). Average sea level pressure is 101,300 N/m2, and dividing by the acceleration of gravity (9.807 m/s2) gives the mass of atmosphere above 1 m^2 of the earth’s surface, or 101,300 / 9.807 = 10,329 kg/m2. The total mass of the atmosphere would be 10,329 * 5.11E+14 = 5.28E+18 kg.
If the average molecular weight of air is assumed to be 29.6, then the atmosphere contains a total of 5.28E+18 / 29.6 = 1.783E+17 kg-moles of gases. In order to raise the CO2 concentration by 1 ppm, this would require an emission of 1.783E+17 * 1E-6 = 1.783E+11 kg-moles of CO2 * 44 kg/kgmol = 7.847E+12 kg, or 7.847 gigatons (GT) of CO2.
However, if global anthropogenic CO2 emissions are 33.5 GT/yr (per the IEA), if all CO2 emissions remained in the atmosphere, the CO2 concentration should be rising at a rate of 33.5 / 7.847 = 4.27 ppm/yr. If Fredlingstein’s 42.2 GT/yr emission rate is correct, the CO2 concentration should be rising at a rate of 42.2 / 7.847 = 5.38 ppm/yr.
However, the actual rate of increase in CO2 concentration at Mauna Loa is on the order of 2.6 to 2.8 ppm/yr, meaning that some of the anthropogenic CO2 is removed from the atmosphere by natural processes, including net absorption in oceans and by photosynthesis. There are also natural sources of CO2, such as animal respiration and volcanic eruptions. So the true balance CO2 balance of the atmosphere would be
CO2 from natural sources + anthropogenic CO2 – CO2 to natural sinks = 7.847 * (increase in CO2 ppm in air)
The magnitudes of the first term and third term are hard to measure, so that trying to calculate the second term from the right side of the equation will be subject to the errors in the first and third terms.
However, it has been shown that plant growth rates increase with increasing CO2 concentration in the air, so that CO2 removal rate by photosynthesis will increase in the future. If the CO2 concentration in the air increases, the equilibrium (Henry’s Law) between CO2 in air and the oceans will be shifted toward greater net absorption by the oceans, and if the carbonate and bicarbonate ion concentrations increase in the oceans, there will be faster conversion to calcium bicarbonate by mollusks. This means that the magnitude of the third term (CO2 to natural sinks) will increase in the future.
We know from observations that (CO2 from natural sources) – (CO2 to natural sinks) is now a negative number, so that if the (CO2 to natural sinks) increases, the net total on the left side will tend to decrease, and eventually reach zero at some future CO2 concentration higher than today’s value, which would lead to a stable value for the CO2 concentration in the atmosphere. But if the photosynthesis rate is higher, this will lead to higher crop yields, able to feed a growing human population.
This is not a “thermal runaway” situation envisaged by the global-warming alarmists, since the CO2 concentration in the air has an upper bound. This would be an equilibrium that will be shifted toward a greener, more fertile earth, that may be just slightly warmer.
Boy, you guys are smart. Absolutely no sarcasm intended. I think that most of this flies over the heads of most people (including myself.) IER and NASA published what should have been broadly distributed news, even if they claim “greening” may “only help control” AGW. That’s never going to happen, unless governments de-fund the CBC, BBC,and ABC. (And probably a lot of others I don’t know about.) How do we get AT&T Inc. to de-fund CNN?
How do we ever educate Mark Carney?
There are there main sources of human CO2 emissions – fossil fuels burning, cement production and land use. Total is 42.2 GtCO2/year, 33.5 GtCO2/year is only fossil fuels (I think).
Steve Z
This is an excellent post.
It is not clear why Fredlingstein’s 2019 estimate of 11.5 GT/yr carbon (equivalent to 42.2 GT/yr CO2) is so much higher than the IEA’s estimate of 33.5 GT/yr CO2. While it may be difficult to measure global CO2 emissions from all sources, when many small sources may not be known to governmental or international agencies, a 26% discrepancy is hard to explain. Which, between Fredlingstein and the IEA, are fudging the data?
Fredlingstein et al. estimate ~10 GT/yr ±5% from fossil fuel emissions (combustion & cement production) and ~1.5 GT/yr ±50% from land use changes and was an estimate of the current situation. The IEA estimate was projected from 1990 data.
Excellent article. If my kids were still in school I would want this to be part of the compulsory curriculum. For those skids still in school and coming to schools ion the next few years they need to see this as do all voters and those who care about helping the less fortunate in developing countries gain better lives.
The last sentence damaged my brain.
Too long, far too long.
Christopher,
Another welcome contribution, thank you. You present understandable science with clear logic, give us a fresh new look at the old problem of poverty and put the blame squarely on respectable institutions we thought were trustworthy. For those still undecided, you state plainly:
Who could cavil at that without praising poverty? Then, you give thundering good advice:
When the voters speak loudly they shut down the misleaders.
“[T]he rapid growth in the total plant biomass on the planet” is a carbon sink. Natural Carbon Recapture. And it’s green, Green, GREEN.
Someone upthread used the word saturated with regards to C02 sinks.
Am I wrong to think the earth cannot be saturated by our puny efforts?
I think money would be better spent on stopping Continental Drift.
/s
clipe
Are you referring to me? I used the word with respect to the cold, ocean-bottom water that is under high pressure as a result of the pressure from the depths. When it reaches the surface, with upwelling, it is no longer in equilibrium and the excess CO2 is given off. “Excess” is with respect to the temperature, pressure, and atmospheric CO2 partial pressure encountered at the surface.
Lord Monckton,
I have a question arising our of Friedlingstein et al 2019,“Global Carbon Budget 2019”.
Any contributor here is free to answer.
Figure 1 gives the seasonally corrected trend for CO2 concentration now at some 410 ppm.( The Keeling Mauna Loa figure). This is not controversial.
Figure 2 is the Schematic representation of the overall perturbation of the global carbon cycle caused by anthropogenic activities averaged globally for the decade 2009-2018.
The legends show the corresponding arrows and units.The uncertainty in the atmospheric growth rate is very small (+/-0.02 GtC/year) and is neglected for the figure.
The anthropogenic perturbation occurs on top of an active carbon cycle represented in the background (of Figure 2)and taken from Ciais et al (2013) for all numbers with the ocean gross fluxes updated to 90 GtC/ year-1 to account for the increase since publication etc.
The “background active carbon cycle” is what interests me.
In 2008 following AR4, Dr.Tim Ball gave the common estimates of AR4 as follows-
Respiration- 43.5- 52 GtC/yr.
Ocean Outgassing (tropical areas)- 90-100 GtC/yr.
Soil bacteria, decomposition 50-60 GtC/yr.
Volcanoes, soil degassing -0.5-2 GtC/yr.
Forest cutting, forest fires- 0.6-2.6 GtC/yr.
Anthropogenic emissions (2005) 7.2 -7.5 GtC/ yr.
TOTAL- 192-224 GtC/yr.
ERROR- 32 GtC/yr.(~15%)
These figures can now be updated give the increased Anthropogenic CO2 contribution.
Tim Ball’s point is that the Anthropogenic emissions lie within the error range of the first three natural sources and the total error range is almost 5 times the human production.
Is he correct?
The mapping of Anthropogenic CO2 contribution done by Finnish scientists using satellite data showed that in the United States that CO2 contribution correlated with the location of intense levels of broad leaf vegetation not human population centers.
Lord Monckton, I would have thought that you of all people would be particularly sensitive about correctly presenting annual CO2 emissions as being on the order of 800 gigatons per year. Not “global CO2 emissions, which are asserted to have been about the same in 2019 as in 2018, at 33.3 gigatonnes of CO2″… You left out the important adjective ANTHROPOGENIC, and thus fail to put man-induced emissions of this gas of life in proper perspective.
I couldn’t get pat this
“genociders, whose cruel, dangerous and expensive global-warming abatement policies are killing tens of millions annually”
While Monkton’s language is generally a good read, I don’t think hyperbole helps in a scientific dis purse.
And where is the evidence for “are killing tens of millions annually”?
“And where is the evidence for “are killing tens of millions annually”?”
Agreed.
“… the stabilization of emissions …”
Unfortunately, since the human emissions are only 5% of the global emissions (ie 95% natural), any change we make will be completely swamped by the unchanging natural emissions.
Amid all the talk of insect apocalypse, biodiversity crisis and looming extinction, an actual scientific study by the NERC on 5000+ species of invertebrates and plants (plus mosses, lichens etc) finds that between 1970 and 2015, biodiversity has increased in the UK. There has been on average an 11% increase of habitat range.
https://www.sciencedaily.com/releases/2020/02/200217112736.htm
CAGW is a death cult. Looking at life they see only death. Monckton is quite right to call them genociders.
Those of us who are fair minded with common sense are held in a vice like grip by hysterical environmentalists and global warming fanatics referred to as eco fascists and rightly so by James Delingpole. For instance in France the fair minded common sense approach of citizens, voters and Le Penn supporters who declared that they were not racist to suggest that migrants crossing the Med in overloaded trafficked boats should be encouraged to stay in their own countries particularly sub Saharan Africa by economic development of those countries. However as this would require investment in massive power projects using fossil fuels similar to China and India, this was vetoed by the IPCC influenced western governments particularly the collective voice of the EU.
I could go on and declare that this hysteria has been driven along by environmentalism using global warming as the main vehicle which has no basis in science whatsoever and is a complete myth ever since its inception in 1988 when CO2 was declared a dangerous pollutant that would lead to catastrophic anthroprogenic global warming.
Reply
Regarding my comment up the thread,
https://wattsupwiththat.com/2020/02/19/sins-of-emission/#comment-2920631
I have a friend who understands exactly what I want to calculate. He says:
I understand you want me to integrate the attached graph areas; 14-20um and 0-5um respectively. [he refers to the infra red spectrum of CO2]
I can only do that if the data is plotted in Excel. Would you do that for me (that makes you responsible for errors of deviation!)?
Then I’ll generate an approximate function for each of the three characteristics and integrate accordingly.
Anyone out there who has an idea or who knows how to make/get an infra red spectrum of CO2 (presumeably made with FTIR) in Excel?
or if the data is in an CSV file we could probably convert it to Excel.
There is an infra red spectrum; it is part of electromagnetic spectrum which can be mapped and summed for any temperature using Planck’s Law. This can be done using excel. Ordinate values of radiation intensity from Planck’s Law are calculated incrementally for increasing abscissa values of wavelength from 0.1 to 180 microns. The area under the curve is found by graphical integration – multiplying the ordinate values by the incremental wavelength abscissa values and summing them from 0.1 to 180 microns. The spreadsheet layout should include an input for absolute temperature so that any number of curves may be integrated from absolute zero to flame temps of 1200 C plus. the absorption bands for CO2 lie on the X axis of the spectrum and can calculated for each by the graphical integration method outlined above
The graphical integration ( summing the squares) on an Excel spreadsheet for 15 C gives the emissive power for the entire spectrum (area under the curve or Stefan-Boltzman) as 420 W/m^2 and infra red absorbed by CO2 bands as 85 W/m^2 or 20.3% this is for a black body a grey body would give a similar %.
“We know that the emissions data are inaccurate because if they were accurate – and if the link between emissions and concentration were as direct as They tell us it is – then the stabilization of emissions would have been matched by at least some diminution in the rate at which CO2 concentration is accumulating in the atmosphere.”
This may have already been asked, but I’d like to know the rational for this claim.
If emissions remain constant than everything else being equal the rate of increase in CO2 concentrations should be constant, not diminish.
Also, if we are only interested in the last year, it should be noted that the rise during 2019 was slightly less than in 2018. An increase of 2.48ppm compared with 2.86ppm. I doubt this is anything other than natural variability, but its odd to claim 2019 emission figures must be wrong because there was no diminution in the rise of CO2 levels whilst ignoring the fact that there was a diminution.
Should have added the source for the rate of increase figure:
https://www.esrl.noaa.gov/gmd/ccgg/trends/gr.html
Amid all the talk of insect apocalypse, biodiversity crisis and looming extinction, an actual scientific study by the NERC on 5000+ species of invertebrates and plants (plus mosses, lichens etc) finds that between 1970 and 2015, biodiversity has increased in the UK. There has been on average an 11% increase of habitat range.
https://www.sciencedaily.com/releases/2020/02/200217112736.htm
So in the UK the wellbeing of these 5000 or so species is getting better, not worse.
I found this spectrum of CO2.
Now if I could just get the related digital data from nist. The e-mail given by nist not does not work.
https://webbook.nist.gov/cgi/cbook.cgi?Scan=cob8753&Type=IR
The lack of CO2 correlation with surface temperature is due to IR intensity and emissivity. The notable blackbody line at about 10um is only going to raise temperature of It’s neighbours when -80C. That’s not the surface temperature at most of the planet. By the time it reaches few kms up, its outward bound because no mass left to collide .
No correlation between that wavelength and temperature the source, the -80ºC temperature is just a fable. The 10 micron wavelength can be emitted by a source at any temperature, the hotter the source the higher the spectral energy density at any given wavelength.
HenryP, I downloaded the data file (124-38-9-IR.jdx) from the NIST link you suggested. I removed the header and tail leaving pure data.
I then converted it into a .csv and xls file.
I also converted it from wavenumber to wavelength.
See the files here… and let us know how you get on.
The original file:
https://drive.google.com/open?id=1zza9lrqcxLaz-rP15fehAGJheth7PWTZ
Above top and tailed:
https://drive.google.com/open?id=1-apr3rD0_EuoyBTIcnwq1zpGCnh9ARjp
Converted to a csv file (wavenumber):
https://drive.google.com/open?id=1pl1ivWt00416I5XYsNjjP8B1_zgK4Cx8
Above as an .xls file:
https://drive.google.com/open?id=1L3d0G_AVdYglJr51K-waokXg0Dcw5g0p
Converted to a csv file (micrometres):
https://drive.google.com/open?id=1tw9aW_v8v7Cgm4pwbosFQm_LN5H-EQmG
Above as an xls file:
https://drive.google.com/open?id=1pV-sdSzhkEyG0mX4zmEHFVpWZe6HXMWh
And the awk file that converts the input file to a csv:
https://drive.google.com/open?id=15U1RAjT5f_KxH4mwFF7YkFXNZIMoBiSA
Steve, thanks do much! I will get to work on it straight away.
The Excel file is really super. We can work with this. I have a question. The Berkeley report on earthshine that I quoted earlier up the thread shows also peaks before 2.6 um. See fig 6 bottom.
How do I get the data for that?
Anyone?
Infra red absorption for 2.6 micron bands is very small and is not significant at < 0.05%
Robert
It is in fact so strong that we can pick it up via the moon.
http://w.astro.berkeley.edu/~kalas/disksite/library/turnbull06a.pdf
See fig 6 bottom. It comes via the moon fig. 7
So that went: sun => earth [CO2] => moon => earth (measured)
Anyway, we are looking if the net effect of more CO2 in the air is that of cooling or warming, so we have to evaluate all absorption in the spectrum of the sun 0-5 um in terms of eV (divided by 2) and compare it to all absorption in the spectrum of the earth 7-20 um. You understand?
In sunshine there seems to be very little radiation in the 2 to 3 micron range – it is mostly in the visible light region < 1micron.
Thanks for Berkeley ref looks like a long read.
…thanks so much!
Modelling Earth’s atmosphere and trying to include every conceivable variable such as cloud cover, scattering etc seems far too complex – why don’t you concentrate (as in your earlier post) on
(1) absorption by CO2 alone of first generation photons and then
(2) calculate the effect of reradiation on a spherical basis of these photons subsequently. This would be very useful. Perhaps reflectivity and transmissivity are important but I would think that absorptivity is the important one to consider at first.
I’m beginning to suspect the rising CO2 level has more to do with a weakening of the earth’s magnetic field. Less protection from cosmic rays means more heating causing CO2 release, along with the activation of negative feed backs. Nothing we can do about it.
@ur momisugly Steve Richards
You truly helped me a lot. I think I will be able to finish my investigation soon now.
Could I possibly ask one more favor? Could you see if you can convert this file for me to Excel as well?
https://pastebin.com/1ChMSLRJ
I battled but I cannot get it done.
The file serves as a control and I also need the area 1.8-2.2 um as explained
https://wattsupwiththat.com/2020/02/19/sins-of-emission/#comment-2922190
& further down.
@ur momisugly Henry Pool
https://drive.google.com/file/d/1RIh9aTgWxP2c3Xl_ps_sPBf-agtHgsgB/view?usp=sharing
for an excel version of your data.